Download presentation
Presentation is loading. Please wait.

1
Filtering the data

2
Detrending Economic time series are a superposition of various phenomena If there exists a « business cycle », we need to insulate it from other phenomena. Low frequency: long-term growth, long waves, demography… High frequency: seasonal fluctuations, sales, football matches…

3
Linear detrending is not enough Trend growth may change, and introducing structural breaks is arbitrary High frequency fluctuations are not filtered. To insulate business cycles, one uses pass-band filters To understand pass-band filters, we need to study the spectrum of stochastic time- series

4
Consider a stationary time series

5
Fourier transforms If a sequence of numbers is deterministic, we can decompose it (in C) into a sum of deterministic cycles of all frequencies The weight on each frequency is computed as the Fourier transform of the original sequence The initial series is recovered from FT by applying the inverse Fourier transform, which proves the decomposition
 into a sum of deterministic cycles of all frequencies The weight on each frequency is computed as the Fourier transform of the original sequence The initial series is recovered from FT by applying the inverse Fourier transform, which proves the decomposition")
6
Definition:

7
Ex.: The lowest frequency component: The highest frequency component:

8
Properties of the Fourier transform The FT is linear The FT preserves the norm

9
Can we extend it to a stochastic time series? We can define periodicity as the average length of a shock Shocks only last one period: highest frequency Shocks last long: low frequency To measure the length of shocks we define the correlogram

10
The correlogram

11
Example: White Noise

12
Example: AR1

13
The spectrum By definition, it is the Fourier transform of the correlogram. Because the correlogram is symmetrical, the spectrum is real.

14
Example: White Noise A white noise has all frequencies with the same weight

15
Example: AR1 An AR1 has more weight on low frequencies, more so, the more persistent it is (the higher ro)
")
16
The spectrum as a variance decomposition Using the inverse FT and the definition of the correlogram we get

17
Computing the spectrum: the covariance-generating function

18
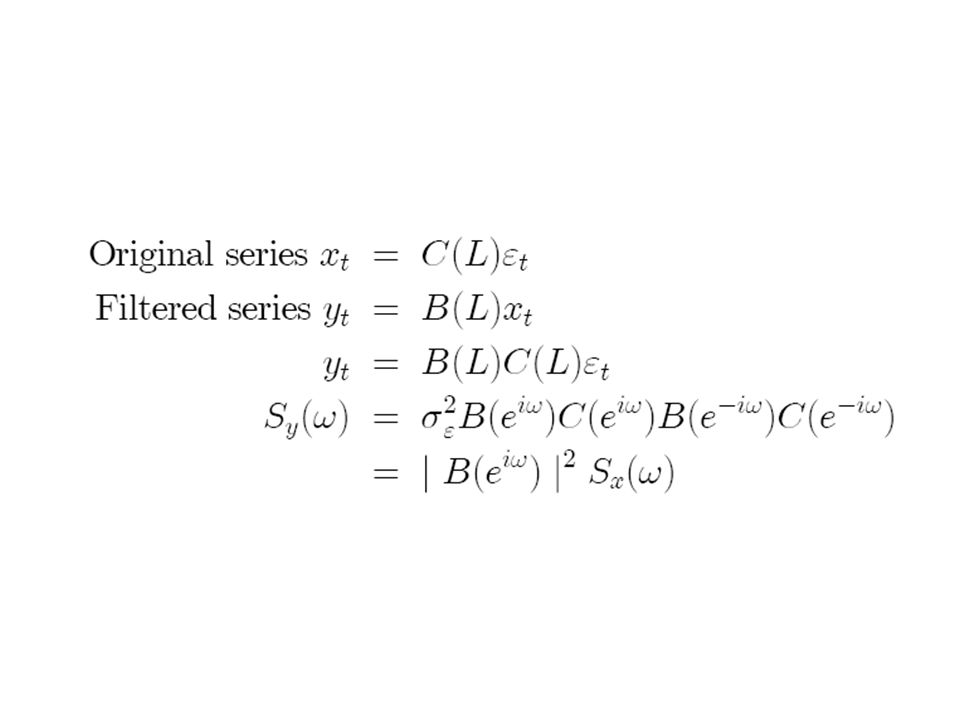
Filtering In the time space, filter characterized by a lag polynomial applied to the series In the frequency space, characterized by its spectrum, i.e. the proportions in which each frequency appears The inverse FT transform allows to get the coefficients from the filter’s spectrum

20
The pass- band filter

21
The Hodrick-Prescott filter Minimize a loss function which –Increases when the trend differs more from the series –Increases when the trend accelerates or decelerates more

22
Unit roots and filtering I(1) series are not stationary and have no MA representation Their correlogram has no norm and their spectrum is not defined To make them stationary, a filter must satisfy B(1)=0 Consequently, it must eliminate zero frequencies
 series are not stationary and have no MA representation Their correlogram has no norm and their spectrum is not defined To make them stationary, a filter must satisfy B(1)=0 Consequently, it must eliminate zero frequencies")
23
U.S. Business cycles

24
Stylized facts I All GDP components move together Employment in all sectors is pro-cyclical « Tension » variables are pro-cyclical: hours, capacity utilization, employment rate The vacancy rate is pro-cyclical and a leading indicator The job loss rate is counter-cyclical and a leading indicator

25
Stylized facts II Stock prices are pro-cyclical and lead output The price level (detrended) is counter- cyclical The price level is a leading indicator Inflation is pro-cyclical and lagging
 is counter- cyclical The price level is a leading indicator Inflation is pro-cyclical and lagging")
26
Stylized facts III Nominal wages move like prices Real wages are a-cyclical Nominal interest rates are pro-cyclical and leading The nominal money stock is pro-cyclical and leading

Similar presentations


 Discrete Fourier transform.>")


![Fluctuations and facts Chapter 2. R. Lucas (1977) «Understanding Business Cycles» “…[understanding] business cycles means constructing a model in the.](/15/4818334/big_thumb.jpg "Fluctuations and facts Chapter 2. R. Lucas (1977) «Understanding Business Cycles» “…[understanding] business cycles means constructing a model in the.>")


