Download presentation
Presentation is loading. Please wait.

2
Analyzing and Interpreting Data

3
To understand a set of data, you need to organize and summarize the values. A measure of central tendency is used to describe a typical value in the data set. The Mean, median, and mode are all measures of central tendency.

4
MEAN The Mean is the numerical average of a data set. Mean = sum of the data items total number of data items

5
MEAN Determine the mean of this data set: Determine the mean of this data set: 2, 5, 8, 13, 19, 24, 28, 37 2, 5, 8, 13, 19, 24, 28, 37 Find the sum of the data values. 2+5+8+13+19+24+28+37 = How many items are in this data set? Calculate the mean. 136 / 8 = 136 / 8 = 136 8 17

6
MEDIAN The median is the middle value in the data set when the numbers are arranged in order from least to greatest. 2 6 8 11 15 2 6 8 11 15
7
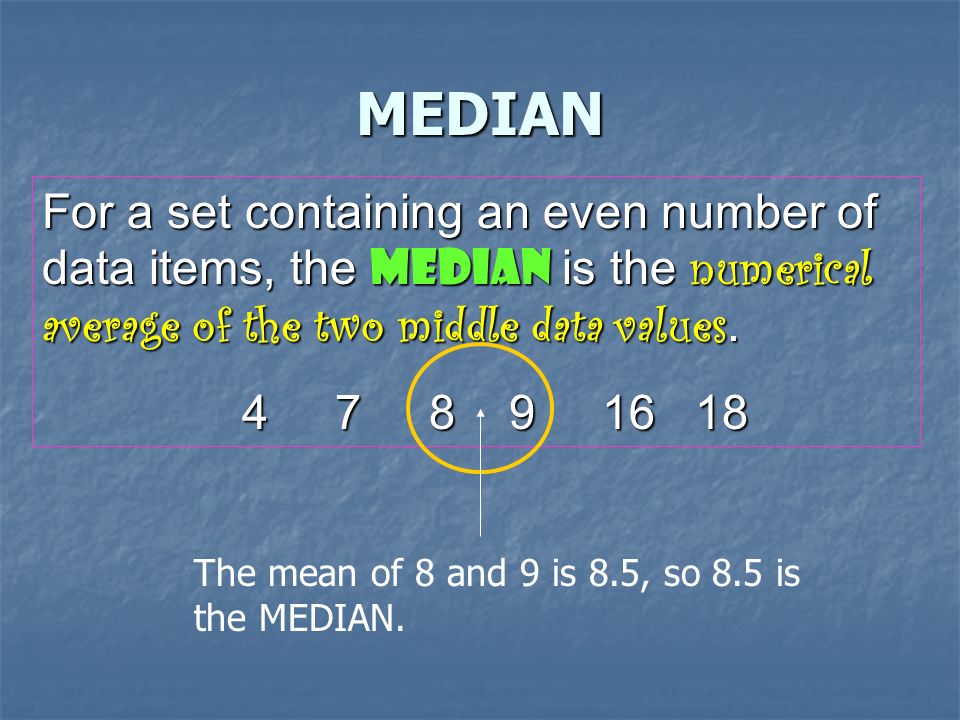
MEDIAN For a set containing an even number of data items, the median is the numerical average of the two middle data values. 4 7 8 9 16 18 4 7 8 9 16 18 The mean of 8 and 9 is 8.5, so 8.5 is the MEDIAN.

8
MODE The mode is the data item that occurs the most often. There can be more than one mode: Ex. 5 6 8 10 5 10 7 Mode: 5 and 10

9
MODE Determine the mode of this data set. Determine the mode of this data set. 2, 5, 8, 13, 19, 24, 28, 37, 2, 5, 8, 13, 19, 24, 28, 37, 25, 18, 2, 35, 3, 5, 19, 13, 5 25, 18, 2, 35, 3, 5, 19, 13, 5 Find values that are the same. The mode is. 5

10
We can use the calculator STAT key to locate the MEAN and the MEDIAN: Data: 4 6 7 12 6 Data: 4 6 7 12 6 Step 1: Enter the data into list 1 in your calculator (STAT EDIT). Step 1: Enter the data into list 1 in your calculator (STAT EDIT).
..")
11
Step 2: Tell your calculator to determine the measures of central tendency. (STAT CALC, ENTER on 1) Step 2: Tell your calculator to determine the measures of central tendency. (STAT CALC, ENTER on 1) Read the answers! Read the answers! = 7
 Step 2: Tell your calculator to determine the measures of central tendency. (STAT CALC, ENTER on 1) Read the answers. Read the answers. = 7.")
12
Scroll down to MED to locate the median value: MED = 6

13
Note: The calculator cannot tell you the mode. Note: The calculator cannot tell you the mode. So… determine what value is the most frequent in your data: So… determine what value is the most frequent in your data: 4 6 7 12 6 4 6 7 12 6 The MODE = 6 The MODE = 6

14
OUTLIERS An outlier is a data value that is much higher or lower than the other data values in the set. (think: outlaw someone whose activities lie out side the law)
.")
15
What is the OUTLIER in this data set? 3, 5, 1, 8, 6, 10, 2, 9, 5, 65, 4, 7, 5, 3

16
Lets go back to our earlier data: 4 6 7 17 6 4 6 7 17 6 Mean = 8 Mean = 8 Median = 6 Median = 6 Mode = 6 Mode = 6 Does the MEAN or the MEDIAN represent the typical value in the data? Why? Does the MEAN or the MEDIAN represent the typical value in the data? Why?

17
RANGE of a Data Set The RANGE is the difference between the highest (maximum) and lowest (minimum) value. The RANGE is the difference between the highest (maximum) and lowest (minimum) value. Given: 4 7 9 10 3 Given: 4 7 9 10 3 What is the range? What is the range? Answer: 10-3= 7 Answer: 10-3= 7
 and lowest (minimum) value. Given: Given: What is the range. What is the range. Answer: 10-3= 7 Answer: 10-3= 7.")
18
Question 1: A computer company had a warehouse sale. The sales manager found that the mode of the sale prices of computers was $1,200. What does this price represent? Half of the computers sold for $1,200. The most common sale price was $1,200. Half of the computers sold for more than $1,200. The difference between the highest and lowest sales price was $1,200. A B C D

19
Box-and Whisker Plots 3 4 5 6 7 8 9 MIN Q1 MED Q3 MAX Each of the quartile divisions represents 25% of the data.

20
Question 2: The box-and-whisker plot below shows student scores on a physical fitness test. Students receive an award for scores at or above the upper quartile. What is the lowest score a student can get to receive an award? Answer: 74

21
Question 3: The box-and-whisker plot below summarizes the test scores of an algebra class. the test scores of an algebra class. Which of the following must be true? The median score is 70. The lower quartile score is 50. Half of the scores are between 60 and 75. The interquartile range is half of the range. A B C D

22
USING THE TREND OF PAST DATA TO PREDICT THE FUTUE: If you are analyzing a relationship between TWO events (x and y), you can use a line of best fit (linear regression) to predict the future. If you are analyzing a relationship between TWO events (x and y), you can use a line of best fit (linear regression) to predict the future.
, you can use a line of best fit (linear regression) to predict the future..")
23
How do you determine a line of best fit? Use your calculator! Use your calculator! Step 1: Enter your data in L 1 and L 2. Step 1: Enter your data in L 1 and L 2. (STAT EDIT) (STAT EDIT)xy16 311 411.5 616
 (STAT EDIT)xy")
24
Step 2: Determine the line of best fit. Step 2: Determine the line of best fit. STAT CALC: LIN REG (4) STAT CALC: LIN REG (4) Then y = ax + b a = 1.942307692 a = 1.942307692 b = 4.326923077 b = 4.326923077 Be sure to fill in the a and b values! y = 1.942x + 4.327 y = 1.942x + 4.327
 STAT CALC: LIN REG (4) Then y = ax + b a = a = b = b = Be sure to fill in the a and b values. y = 1.942x y = 1.942x")
25
Use the line of best fit for prediction: What will be the y value when x = 7 ? What will be the y value when x = 7 ? y = 1.942x + 4.327 y = 1.942x + 4.327 y = 1.942(7) + 4.327 y = 1.942(7) + 4.327 y = 17.921 y = 17.921
 y = 1.942(7) y = y =")
26
A taxi company uses a formula to determine the fare. Let x represent the number of miles driven. Let y represent the total fare (in dollars) owed by the passenger. An equation for the line of best fit is: y =.5x + 3 What is the slope of this line of best fit? What does the slope mean in the context of this problem? What is the y-intercept of this line of best fit? What does the y-intercept mean in the context of this problem? John has $10. How many miles can he travel by taxi?
 owed by the passenger. An equation for the line of best fit is: y =.5x + 3 What is the slope of this line of best fit. What does the slope mean in the context of this problem. What is the y-intercept of this line of best fit. What does the y-intercept mean in the context of this problem. John has $10. How many miles can he travel by taxi .")
27
The End

Similar presentations


: the 25 th percentile Median: the.>")
