Download presentation
Presentation is loading. Please wait.

1
NOVA SCOTIAGROUND SEARCH AND RESCUE ASSOCIATION
SEARCHER – Module one

2
MAP READING AND COMPASS
SEARCHER MODULE 1 MAP READING AND COMPASS

3
NOTICE Map skills are not optional for searchers.
ALL SEARCHERS MUST be able to use maps easily and effectively

4
TOPOGRAPHIC MAPS A MAP is a pictorial representation of a portion of the earth’s surface Many types of maps exist but for our purpose, they can be divided into two main categories:

5
TOPOGRAPHIC MAPS Those that, record to scale, natural and man-made features Those that record and display other types of information and features

6
TOPOGRAPHIC MAPS Maps that record to scale and features are:
Atlas Maps- very small scale maps showing whole countries,continents,or regions Topographic Maps-used primarily for map reading. They show as much detail as their scale allows. Their purpose is to present a complete and accurate picture of the ground as it exist, Plans- very large scale maps drawn in great detail. A plan covers so small an area, they are used basically for special operations

7
TOPOGRAPHIC MAPS Maps that display other types of information are:
Relief Maps- solid maps built as a model,using any scale Road Maps-intended only for use in road connections Photo Maps- produced by making a mosaic of vertical airphotos so as to completely cover an area to be mapped

8
TOPOGRAPHIC MAPS The most useful and commonly used map by the searcher is the TOPOGRAPHIC MAP, which can be defined as: A two dimensional representation of a three dimensional configuration of a land surface

9
TOPOGRAHIC MAPS Advantages of a Topographic Map
Represent physical features of the earth’s surface without distortion Made to scale,which means there is a ratio of the distance on the map to the actual distance on the ground

10
TOPOGRAPHIC MAPS Topographic maps…cont’d;
Provide a base of all SAR activities Have grids which allow the searcher to describe a point on the map with accuracy Provide a wealth of information about a particular location

11
TOPOGRAPHIC MAPS Disadvantages of a Topographic Map
Most common scale 1:50,000, meaning 2cmon the map equal 1km on the ground Difficult to chart maneuvers Updated only every 10 years or so, and may be incomplete

12
MAP CONVENTIONS Topographic maps have a wide variety of applications
Maps are made with north at the top A black margin frames the ground area represented

13
MAP CONVENTION The title, Scale, Contour Lines,Reference System,Legends and other information are shown outside, and displayed in the margins Topographic map symbols are usually displayed on the back of the map

14
MAP CONVENTION Instructors note
Insert a copy of your local map, to help familiarize your student to the area

15
MAP CONVENTIONS TITLE In Canada, there is a National Topographic System (NTS) of indexing maps Each topographic map is named after some prominent community or place within the area. The title of our map is__________

16
MAP CONVENTIONS TITLE…cont’d
The map number is usually displayed in the upper right corner of the map. The number of our map is ____________ The map number and index number to adjoining maps are usually displayed in the lower right corner

17
MAP CONVENTION SCALE The scale of a map is a ration between a unit of length on the map and the actual distance represented on the ground and can be stated in three ways

18
MAP CONVENTION VERBAL-scale in the form of an equation
example, one cm to one km, meaning one cm on the map represents one km on the ground

19
MAP CONVENTION Ratio or Fractional –for example
SCALE …cont’d Ratio or Fractional –for example 1:50,000 or 1/50,000, meaning that one unit (centimeter,inches,etc) on the map is equivalent to 50,000 like units on the ground Map Distance/Ground Distance- 1cm/50,000cm = 1cm/500m = 1cm/0.5km
 on the map is equivalent to 50,000 like units on the ground. Map Distance/Ground Distance- 1cm/50,000cm = 1cm/500m = 1cm/0.5km.")
20
MAP CONVENTION SCALE…cont’d Graphic Scale- a bar scale marked off to show distance in Kilometers, miles, or any unit. Check your local map to view the scale bar

21
MAP CONVENTION SCALE …cont’d
The scale 1/50,000 map is the most commonly used by SAR personnel. The scale simply states : 1 cm on the map equals 0.5 km on the ground

22
MAP CONVENTION SCALE EXERCISE Convert Fractional Scales to Verbal
Fractional Scales Verbal Scales 1/20, cm represents____km 1/50, cm represents____km 1/250, cm represents____km 1/1,000, cm represents____km

23
MAP CONVENTION SCALE EXERCISE…cont’d
Convert Verbal Scales to Fractional Scales Verbal Fractional 1 cm equals ten feet __________________ 1 cm equals ten km __________________ 1 inch equals one mile __________________ 1 cm equals 200 km __________________

24
MAP CONVENTION MEASURING DISTANCE
There are several methods for measuring distance between two points on a map. The simplest uses the graphic scale at the bottom of the map. Simply measure between the two points with a ruler then measure the same distance from the scale

25
MAP CONVENTION MEASURING …cont’d
If you don’t have a ruler, the two points may simply be marked on the edge of a piece of paper then laid along the scale. You will need to measure the distance in sections if it is longer than the graphic scale Another method is to measure the two points with a piece of string and lay that along the scale Use a Romer that is designed for the scale of the map being measured

27
MAP CONVENTION MEASURING…cont’d
Distance may also be measured with a map wheel, were it is rolled along the map and the display will be either be on a dial or LED screen Finally, distance can be measured on a map, by using the scale and simple mathematics, this distance can be converted to actual ground distance

28
MAP CONVENTION Instructor note
Using your local map have students find and measure between two points. And then convert the distance to miles and km

29
MAP CONVENTION GRID REFERENCE SYSTEM
Topographic maps have two types of grid reference systems: Geographic (latitude and longitude) Universal Transverse Mercator (UTM)
 Universal Transverse Mercator (UTM)")
30
MAP CONVENTION Geographic Grid Reference System
Locations on a map are given by Latitude and Longitude Coordinates Latitude is measured by degrees, from 0-90 north and south of the equator Latitude is parallel to the equator and are called Parallels

31
MAP CONVENTION Grid system…cont’d
Longitude is an angular distance measured east and west from the prime meridian which runs through Greenwich,England. It ranges from degrees east or west. Lines of longitude are termed meridians and encircle the earth in a direction perpendicular to the equator

32
MAP CONVENTION Grid System…cont’d
Latitude and Longitude coordinates are expressed in units of Degrees, minutes, and seconds. Each degree is subdivided into 60 minutes(‘) and each minute is subdivide into 60 seconds(“)
 and each minute is subdivide into 60 seconds( )")
33
MAP CONVENTION

34
MAP CONVENTION Grid System …cont’d
By convention, Latitude is stated first, followed by Longitude. Also include the direction you are referring, such as North,or south latitude East or west Longitude

35
MAP CONVENTION Grid System …cont’d
To read Latitude and Longitude of a map, start at the lower right corner and remember the following: FIRST GO UP AND THEN GO LEFT

36
MAP CONVENTION Grid system…cont’d
It is critical that all ground searchers understand the use of the geographic grid since they may have to communicate their position to an aircraft/helicopter or vessel, and virtually all their navigational equipment is designed to use the geographic grid system only.

37
MAP CONVENTION Instructor note
Using your local map, have students practice 4 or 5 points and identify by using lat/long.

38
MAP CONVENTION Universal Transverse Mercator (UTM) Grid Reference System The UTM grid is more “user friendly” The grid consists of a system of blue lines forming 2cm squares over the entire map Each square represents 1 square kilometre

39
MAP CONVENTION UTM …cont’d
The entire UTM grid is comprised of 100x100kilometre blocks. The grid lines are numbered every kilometre, 0-99 eastward and northward within each block. These numbers are printed along the borders of the map and at intervals on the map area

40
MAP CONVEBTION UTM..cont’d
Using this system, any point can be designated to an increment of 1 meter The UTM system is commonly called the Military Grid Reference System

41
MAP CONVENTION UTM…cont’d
A grid map reference is given in six figures and is unique to a particular map A six figure grid reference will locate any point within 100 meters, and is usually accurate enough for SAR purposes

42
MAP CONVENTION UTM…cont’d
Since grid numbers are repeated every 100 kilometres, the map name and number must be stated along with the grid map reference The method used to determine a six figure grid reference is illustrated in the diagram

43
UTM EXERCISE

44
MAP CONVENTION Instructor note
using the same points as in lat/long. Exercise, have students now find the points using UTM reference system

45
MAP CONVENTION DATUMS Map grids are based on a series of accurately surveyed points called Datums Two Datums currently in use are the North American Datum 1927,(NAD 27) and North American Datum 1983(NAD 83)
 and North American Datum 1983(NAD 83)")
46
MAP CONVENTION Datums…cont’d
These two Datums are several hundred metres apart in grid spacing thus, It is very important if you are using GPS, to check to ensure you are using the correct datum Map datums are located on the bottom margin of the map

47
MAP CONVENTION MAP SYMBOLS
Symbols are used to represent features on the ground. The key for these symbols is either on the reverse side of the map or in the margin All map symbols on Canadian topographic maps conform to the following colour code:

48
MAP CONVENTION Canadian colour code black human-made features
blue water green forest or vegetation brown elevation (contours) white open areas,field,or snowfields red highways orange secondary or dirt roads pink high population density areas purple updated data
 white open areas,field,or snowfields. red highways. orange secondary or dirt roads. pink high population density areas. purple updated data.")
49
MAP CONVENTION Instructors note
show students the location of the symbols on the local chart you are using.

50
MAP CONVENTION TOPOGRAPHIC CONTOURS
A map is prepared on a flat (2-D) paper but the surface it represents has three dimensions. On topographic maps the third dimension or elevation can be indicated with Contour Lines
 paper but the surface it represents has three dimensions. On topographic maps the third dimension or elevation can be indicated with Contour Lines.")
51
Map convention Contours…cont’d
A CONTOUR LINE on a map is a line that connects points of equal elevation above sea level. The vertical distance between two contour lines is the Contour Interval

52
MAP CONVENTION Contour..cont’d
The contour interval is located on the bottom margin of the map The contour interval for our working map is ___ Contour lines are drawn with reference to a datum plane or zero contour,usually mean sea level

53
MAP CONVENTION Contour…cont’d There are three kinds of contour lines
elevation contours brown lines depression contours hachured brown lines water depth contours blue lines On most topographic maps, every fifth contour line is printed darker, and is usually labeled with its elevation.This is called the Index Contour

54
MAP CONVENTION The following 10 rules apply to all contour lines
All points on the same line are at the same elevation All contour lines close somewhere, although it may be outside the map at hand

55
MAP CONVENTION Rules …cont’d
3. Contour lines never cross, except when they are representing an overhanging cliff in which case those lines beneath the overhang are dotted. On a vertical cliff several contour lines may become superimposed 4. Contour lines never divide 5. Contour are far apart on a gentle slope

56
MAP CONVENTION 6. Contours are close together on a steep slope
Rules…cont’d 6. Contours are close together on a steep slope 7. Contours bend upstream in valleys and cross streams at right angles 8. On level ground there are no contours 9. An isolated closed contour has the same elevation as the next adjacent contour 10. All points inside a depression contour are lower than the line

57
MAP CARE In the field, maps can be subject to a considerable amount of abuse. Maps are fragile,expensive and often in short supply. HANDLE WITH CARE Avoid opening a map full out in the open air especially if there is a slight breeze. The wind will cause small tears to start and quickly spread Avoid refolding the map any more than you must. Refolding causes the paper to weaken and results in tears or loss of detail

58
MAP CARE A map should be folded using the following procedure:
Fold the map in half down its longest length with the map showing outwards Next fold the map three times the other way in an accordion fashion The idea is to fold the map to a suitable carrying size while ensuring that there is a reasonable size area to study when the two folds are open

60
MAP CARE Try to keep maps dry at all times. This can be accomplished by placing it in clear,sealable plastic bag or map case If a map becomes wet, open them as soon as possible and allow them to dry. Wet maps will tear and stain easily Laminating maps or covering them with clear adhesive plastic film will increase their durability, but will make them cumbersome to carry in the field

61
MAP ORIENTATION A map is “ORIENTATED” when it is turned by the map reader to correspond with the ground it represents The next four slides will describe ways to “orientate” a map

62
MAP ORIENTATION Orientation 1 Compass Set compass to north
Place orientating lines on the compass parallel to north on the map Rotate map until “ red goes to bed”

63
MAP ORIENTATION Orientation 2 Distant Objects
Find two objects/natural landmarks that are also distinct on the map Stand between the two objects Orientate the map to line up with the objects

64
MAP ORIENTATION Orientation 3 Watch and Sun
Orientate your watch by pointing the hour hand directly at the sun Bisect the angle between the hour hand and 12 o’clock You will have an imaginary line running north and south The direction reverses from morning to evening

65
MAP ORIENTATION Orientation 4 Stars Locate the pole star
Face it and you are facing north You can locate the pole star by using the big dipper

66
DIRECTIONS and TRENDS Directions are angular measurements with respect to the position of the observer,north, and the position of the distant object or intended destination course Directions may be expressed in terms of-points of the compass-Bearings-Azimuths Features that lack a particular direction are said to “trend”(a lake may have a sw-ne trend)
")
67
DIRECTIONS and TRENDS CARDINAL and INTERCARDINAL Points of a COMPASS
A compass rose may be broken down into a series of 16 Cardinal and Intercardnial points All 16 Cardinal and Intercardinal points are separated by 22.5 degrees

69
DIRECTIONS and TRENDS Instructors note
Using your local map determine the trends of lakes,runways,ridgelines etc.

70
DIRECTIONS and TRENDS BEARINGS
Bearings are always measured within the four quadrants of the directional circle Bearings are always measured as the angle from the North or South Pole towards either the East or West Bearings cannot exceed 90 degrees

71
DIRECTIONS and TRENDS Instructors note
Using BLM No. 9 determine the bearings for the following 8 courses A,B,C,D,E,F,G,H

73
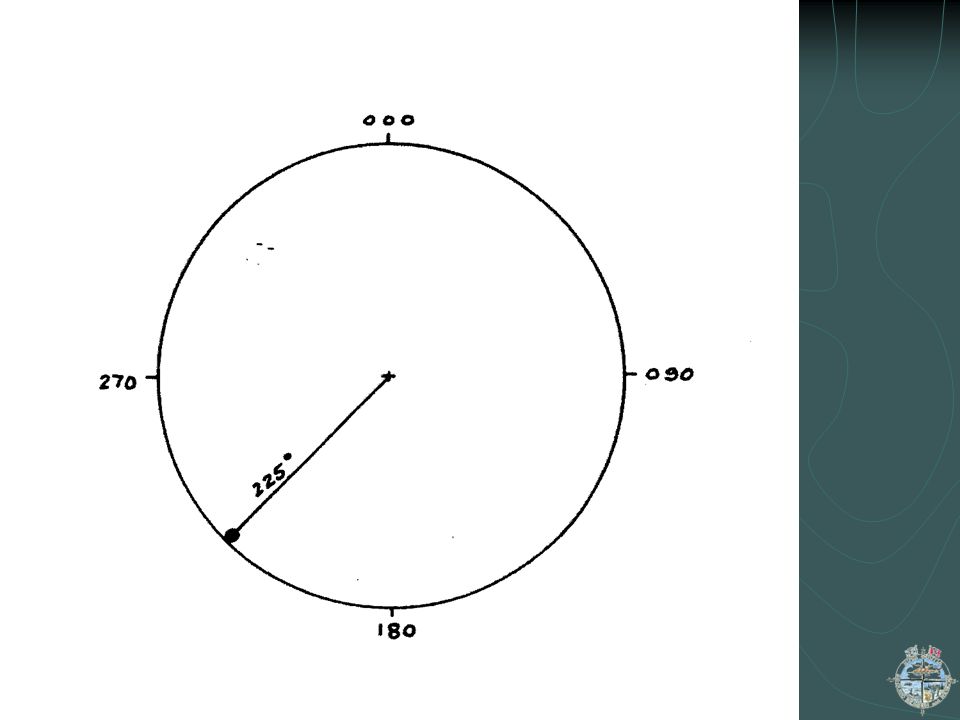
DIRECTIONS and TRENDS AZIMUTHS
Azimuths are directions expressed as angles,measured clockwise from North through the full range of the directional circle. Azimuths range from degrees The following diagram illustrates how Southwest would be expressed as 225 degrees

75
DIRECTIONS AND TRENDS AZIMUTH EXERCISE
Using BLM 10, plot the following bearings as azimuths a. S20E B. N75W C. S35W D N45E E. N10W

77
MAGNETIC DECLINATION Direction can be defined as the position of one point in relation to another On a map there are three primary references that are used to measure direction: True North Magnetic North Grid North

78
MAGNETIC DECLINATION Declination…cont’d
True North (TN)- The direction of the earth’s North geographic pole. All lines of Longitude meet there Magnetic North(MN)- The direction to the earth’s North magnetic pole. This is were all compass needles point. Grid North(GN)- The direction indicated by the N-S lines on the grid which overlay the map.Grid north is slightly different than true north, for GSAR purposes, grid north and true north are the same
- The direction of the earth’s North geographic pole. All lines of Longitude meet there. Magnetic North(MN)- The direction to the earth’s North magnetic pole. This is were all compass needles point. Grid North(GN)- The direction indicated by the N-S lines on the grid which overlay the map.Grid north is slightly different than true north, for GSAR purposes, grid north and true north are the same.")
79
MAGNETIC DECLINATION The angular difference between True North and Magnetic North is called Magnetic Declination All topographic maps display a declination diagram either on the right hand margin or to the left on the bottom margin (only on newer topo maps)
")
80
MAGNETIC DECLINATION DECLINATION…cont’d Depending on your location,declination will be either east or west. In Nova Scotia all declinations are westerly A line passing through both magnetic and true north poles has no declination. It is referred to as the AGONIC LINE The agonic line in Canada passes through Saskatchewan

81
MAGNETIC DECLINATION Calculating current declination
ALL searchers responsible for navigation should check the map each time they use it, and calculate the current declination if required The sample calculation is based on BLM No. 12 The diagram indicates the declination was 23 degrees17’ in 1976 and was decreasing 5.4’annually

83
MAGNETIC DECLINATION Calculating current declination…cont’d
Calculate the number of years since the declination was established, present year(A)-1976= ( B)years Multiply the annual change by the number of years, to obtain the total declination change, B X 5.4= TOTAL CHANGE in minutes remember,1 degree equals 60 minutes
-1976= ( B)years. Multiply the annual change by the number of years, to obtain the total declination change, B X 5.4= TOTAL CHANGE in minutes. remember,1 degree equals 60 minutes.")
84
MAGNETIC DECLINATION …CONT’D
Since declination is decreasing the angle between grid north and magnetic north is decreasing. Therefore the total amount of change is subtracted from the original figure. It is virtually impossible to measure fractions of degrees with a hand-held compass, so round off to the nearest degree

85
MAGNETIC DECLINATION Declination…cont’d
Note on which side of the grid north arrow the magnetic north arrow is located. If it is right the declination is east. Conversely if it is left, the declination is west. Each year make a pencil note of the new declination beside the declination diagram on the map

86
MAGNETIC DECLINATION Instructors note
Using your local map have the students determine the current magnetic declination

87
CONVERTING BEARINGS and AZIMUTHS
Whether the declination is east or west is critical, when it comes to map and compass work Whenever you take a grid direction from a map and want to follow it with a compass, you must take into account the magnetic declination. Conversely, the same holds true when you want to plot field data taken from your compass,onto a map

88
MAGNETIC DECLINATION All searchers responsible for navigation should remember the following rhyme: Declination West-Magnetic Best Declination East-Magnetic Least

89
MAGNETIC DECLINATION Cont’d
The rhyme can be broken down into the following rules to go from grid bearing to magnetic bearing ADD DECLINATION to go from magnetic bearing to a grid bearing SUBTRACT DECLINATION

90
MAGNETIC DECLINATION Cont’d With a Easterly Declination
To go from a grid bearing to a magnetic bearing Subtract declination To go from a magnetic bearing to a grid bearing Add declination

91
MAGNETIC DECLINATION Converting Bearing Exercise
Complete the following mag.dec.17E Mag. Dec. 24 W Azimuth (mag) Azimuth (true) 167 Azimuth (true)_____ Azimuth (mag)________ mag.dec. 16W MAG.DEC.17E Azimuth (mag) Bearing (true) 17 E Azimuth (true)______ Bearing (mag) ________
 264 Azimuth (true) 167. Azimuth (true)_____ Azimuth (mag)________. mag.dec. 16W MAG.DEC.17E. Azimuth (mag) 094 Bearing (true) 17 E. Azimuth (true)______ Bearing (mag) ________.")
92
REFERENCES Merry,Wayne,1999, Basic Ground Search and Rescue in Canada: A Home Study Guide, Context North. Smith,Richard:LaValla,Richard: Hood,Rick,Lawson, Norman and Kerr,Guy 2003,Field Operating Guide to Search and Rescue (FOG SAR)-SAR Skills Handbook, ERI Canada, Alberta, Canada Newfoundland and Labrador Search and Rescue Association,2002, Provincial Training Standards Manual
-SAR Skills Handbook, ERI Canada, Alberta, Canada. Newfoundland and Labrador Search and Rescue Association,2002, Provincial Training Standards Manual.")
Similar presentations


>")


