Download presentation
Presentation is loading. Please wait.

1
Visualizing State Transition Graphs Hannes Pretorius Visualization Group, TU/e 17 October 2007 a.j.pretorius@tue.nl www.win.tue.nl/~apretori/

2
Introduction

17
State transition graph Graph G = (V, E) where: Node s in V is a possible system state Directed edge t = (s, s’) in E is a transition from source state s to target state s’
 where: Node s in V is a possible system state Directed edge t = (s, s’) in E is a transition from source state s to target state s’")
18
Research question “How can visualization be used to gain insight into state transition graphs?”

19
Research question “How can visualization be used to gain insight into state transition graphs?” What is insight? –Symmetries, patterns… What about size? –System behavior is often complex Typical users? –Small number of expert users

21
Related work Van Ham et al., TVCG, 2002.

23
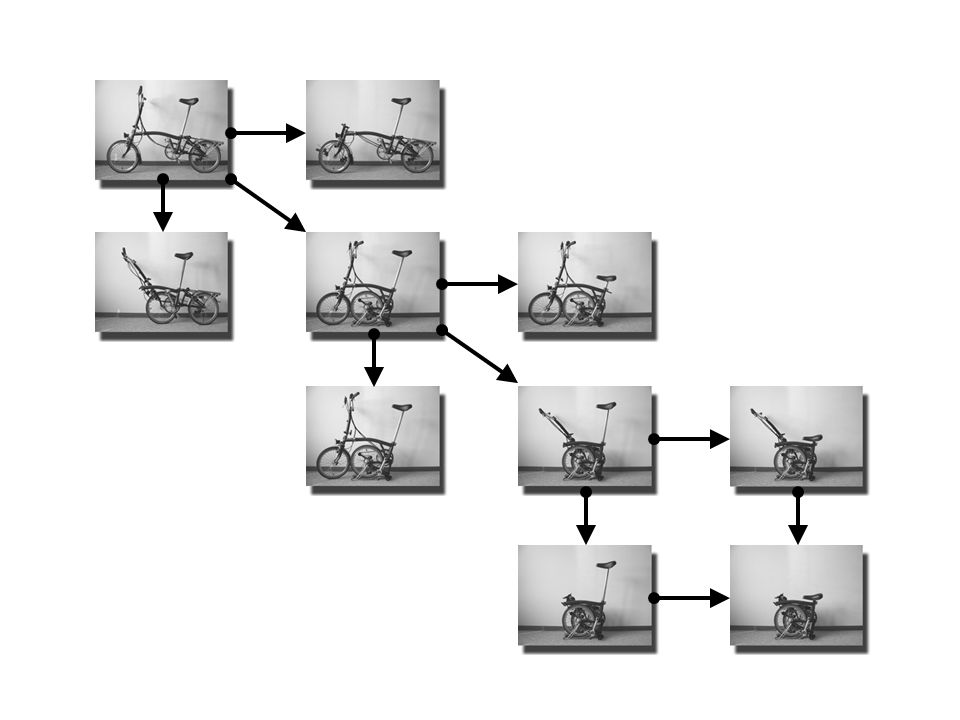
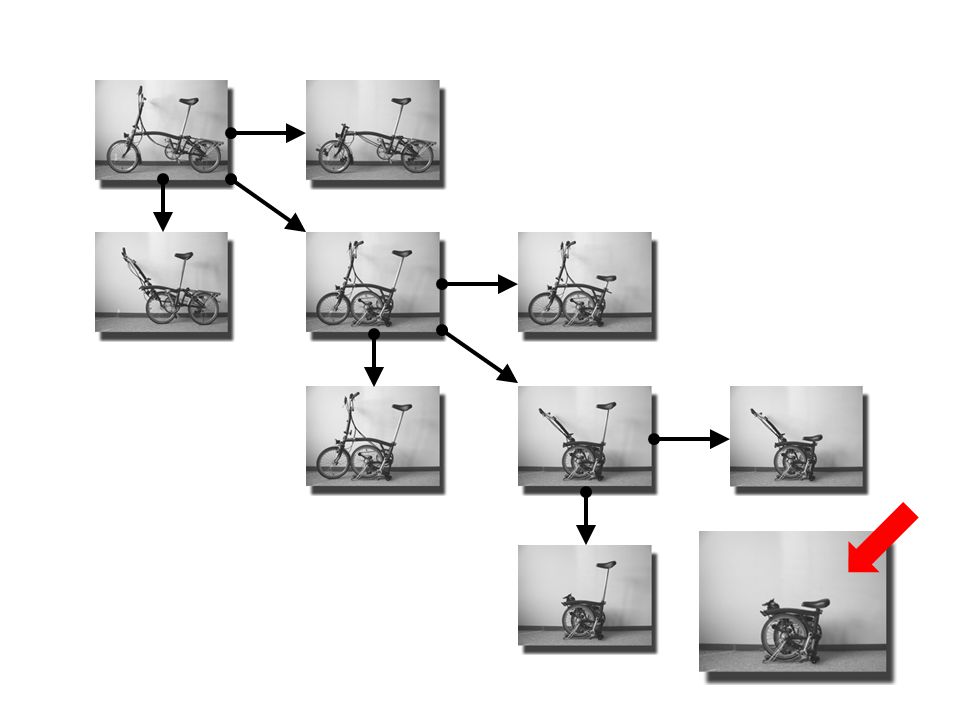
Approach

26
Handle_pos Front_wheel_pos Back_wheel_pos Seat_pos = up = out = in = down

27
Handle_pos Front_wheel_pos Back_wheel_pos Seat_pos = down = in = out = up

28
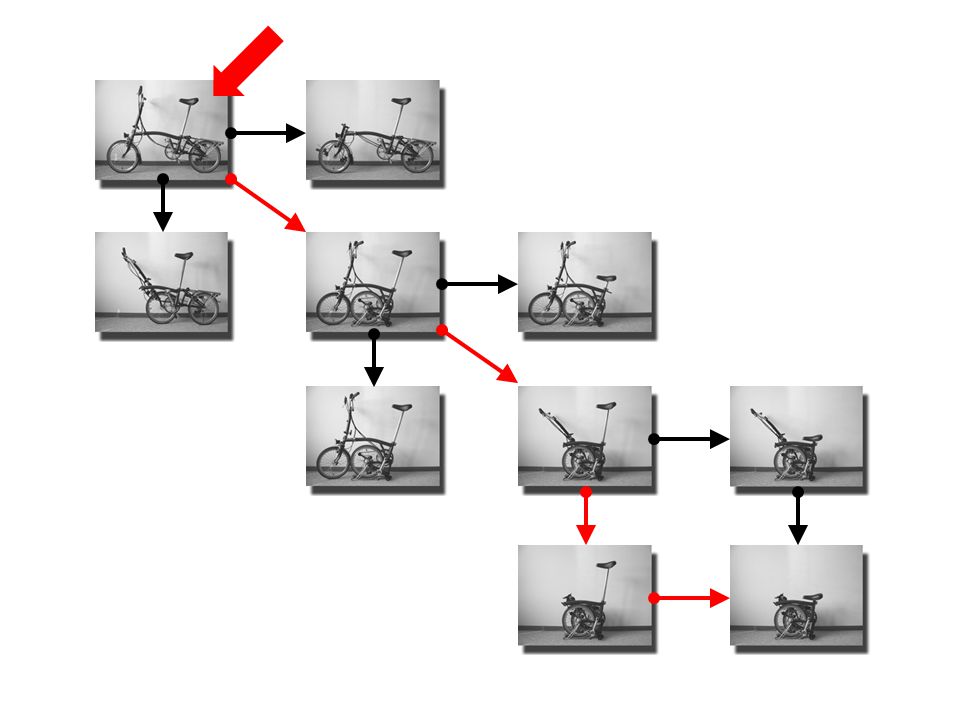
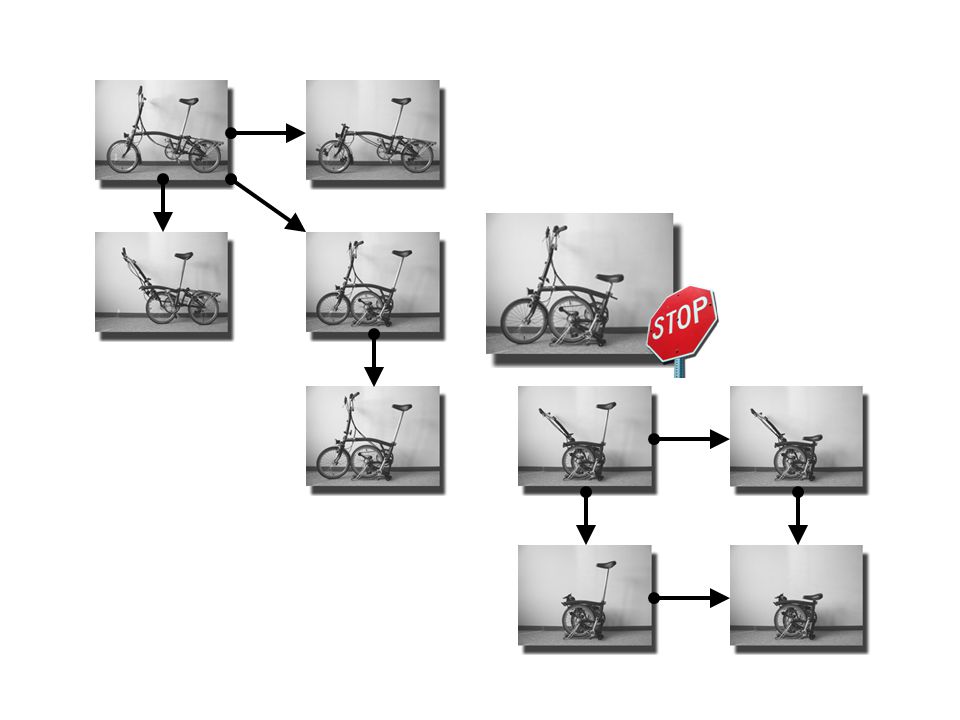
State transition graph Graph G = (V, E) where: Node s in V is a possible system state Directed edge t = (s, s’) in E is a transition from source state s to target state s’
 where: Node s in V is a possible system state Directed edge t = (s, s’) in E is a transition from source state s to target state s’")
29
State transition graph Graph G = (V, E) where: Node s in V is a possible system state Directed edge t = (s, s’) in E is a transition from source state s to target state s’ Every node s in V has: n associated attributes a i a i has domain A i = {a i,1, …, a i,k i }
 where: Node s in V is a possible system state Directed edge t = (s, s’) in E is a transition from source state s to target state s’ Every node s in V has: n associated attributes a i a i has domain A i = {a i,1, …, a i,k i }")
30
Projection Pretorius and Van Wijk, IV, 2005.

36
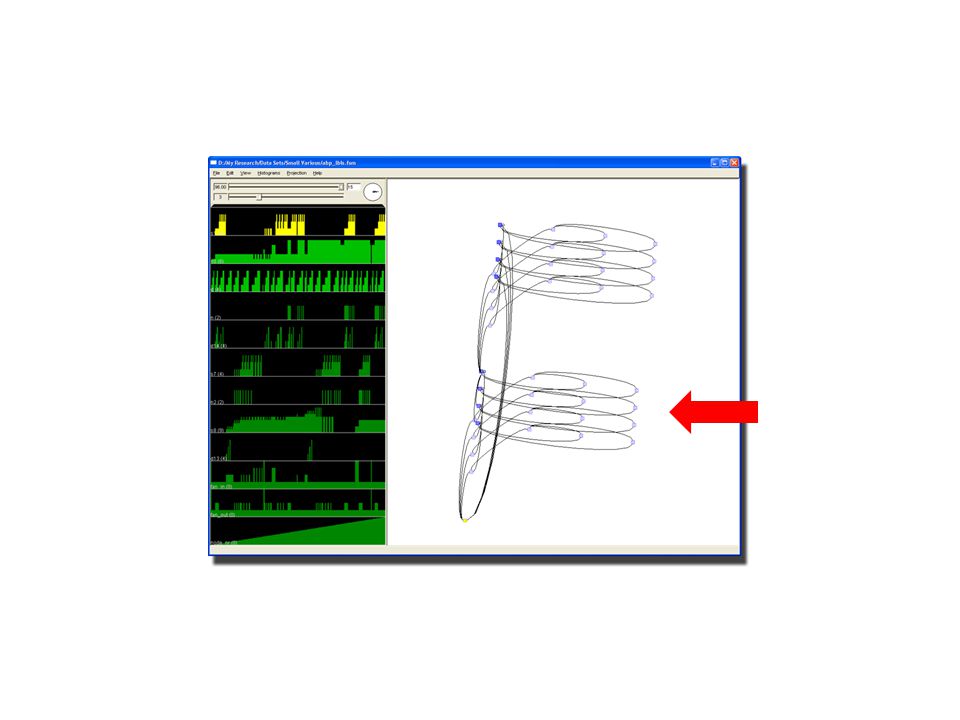
Projection Multivariate data: –Select interesting subset –Show low-dimensional projection Pretorius and Van Wijk, IV, 2005.

37
Projection Multivariate data: –Select interesting subset –Show low-dimensional projection Suggestive behavioral patterns Meaning of positions projected to not clear Select subset based on domain knowledge Pretorius and Van Wijk, IV, 2005.

38
Clustering Pretorius and Van Wijk, InfoVis, 2006.

42
All states Handle_pos Seat_pos

52
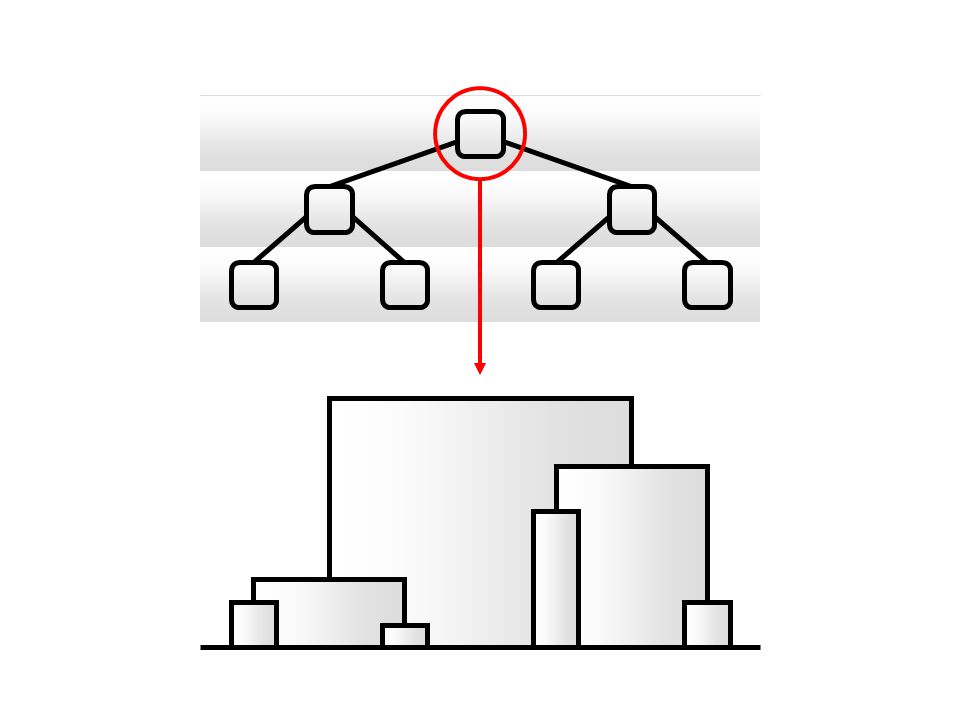
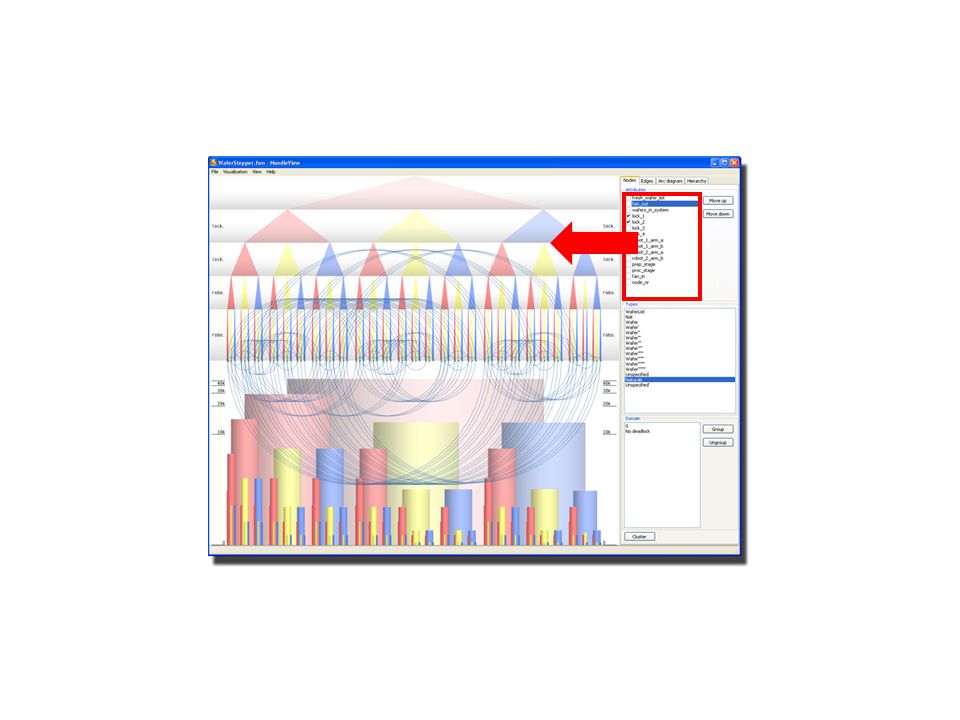
Clustering Choose subsets based on domain knowledge Position clusters linearly Show additional information on top of this: –Clustering hierarchy –Arcs representing transitions –Bar tree representing size of clusters Pretorius and Van Wijk, InfoVis, 2006.

53
Clustering Reduce complexity –Location has meaning Patterns: –Attribute values –Behavior –Cluster sizes Different types of analysis: –Explorative (e.g. different perspectives) –Specific (e.g. deadlock analysis) Pretorius and Van Wijk, InfoVis, 2006.
 –Specific (e.g. deadlock analysis) Pretorius and Van Wijk, InfoVis,")
54
Custom diagrams Pretorius and Van Wijk, CG&A, 2007. Mathijssen and Pretorius, LNCS, 2007.

57
Custom diagrams Support diagramming in general way: –Edit diagrams –Link with attributes Capture conceptualization of problem Pretorius and Van Wijk, CG&A, 2007. Mathijssen and Pretorius, LNCS, 2007.

58
Custom diagrams Support diagramming in general way: –Edit diagrams –Link with attributes Capture conceptualization of problem Semantics clear and intuitive Analysis and communication Flexible Pretorius and Van Wijk, CG&A, 2007. Mathijssen and Pretorius, LNCS, 2007.

59
Wafer stepperPaint factoryPetri nets

60
Trace visualization Submitted, PacificVis, 2008.

63
Time Attributes 1k 1 n 1 2

64
Time Attributes 1k 1 n

66
3

67
Submitted, PacificVis, 2008.

68
Trace visualization Traces: –Curb size and complexity –Users intuitively relate to time Submitted, PacificVis, 2008.

69
Trace visualization Traces: –Curb size and complexity –Users intuitively relate to time Three views: 1.Diagram: easier to interpret 2.Time series: general trends 3.Transition graph: generalized behavior Submitted, PacificVis, 2008.

70
Conclusion Visualization of state transition graphs Prototyping Focus on state attributes –Clear semantics Explorative analysis: –E.g. different perspectives Focused analysis: –E.g. deadlock, steam flow

71
Questions www.win.tue.nl/~apretori/

72
Projection (cont.)
")
Similar presentations


>")

 Chaomei Chen, Il-Yeol Song, Weizhong Zhu>")


 Presentation By - SANDEEP REDDY CHEEDEPUDI (Student No: 17037032) - VISHNU CHANDRADAS (Student.>")


