Download presentation
Presentation is loading. Please wait.

1
Application of Autonomous Driving Technology to Transit
Washington State Transit Insurance Pool Quarterly Board Meeting, Tacoma, WA December 5, 2013 Jerome M. Lutin, Ph.D., P.E. Senior Director, Statewide & Regional Planning (retired) NJ TRANSIT
 NJ TRANSIT.")
3
Transit and Autonomous Vehicle Technology
Impact of Self-Driving Cars on Transit Opportunities for Autonomous Driving Technology in Transit Our proposal to FTA

4
How Autonomous Cars Will Affect The Market for Transit
Transit riders generally fall into two categories, captive and choice Captive riders – cannot drive or do not have access to a car Choice riders - generally do own cars, but choose transit when it can offer a faster, cheaper or more convenient trip. Choice riders can avoid congestion, use time on transit to read, work or sleep, and can avoid parking costs and hassles at their destinations.

5
Automation Coming in Stages
NHTSA Preliminary Policy on Automated Vehicles Level 2 (Combined function automation) Automation of at least two control functions designed to work in harmony (e.g., adaptive cruise control and lane centering) in certain driving situations. Level 3 (Limited self-driving) Vehicle controls all safety functions under certain traffic and environmental conditions. Driver expected to be available for occasional control. Example: Google car Level 4 (Full self-driving automation) Vehicle controls all safety functions and monitors conditions for the entire trip. Vehicle may operate while unoccupied.
 Automation of at least two control functions designed to work in harmony (e.g., adaptive cruise control and lane centering) in certain driving situations. Level 3 (Limited self-driving) Vehicle controls all safety functions under certain traffic and environmental conditions. Driver expected to be available for occasional control. Example: Google car. Level 4 (Full self-driving automation) Vehicle controls all safety functions and monitors conditions for the entire trip. Vehicle may operate while unoccupied.")
6
Functional Capabilities of Currently Available Commercial Collision Avoidance and Driver Assist Packages for Autos Adaptive cruise control Adaptive headlights Autonomous emergency braking Blind spot detection Cross traffic alert/avoidance Driver fatigue/inattention alert Forward collision avoidance Lane departure warning Lane keeping assist Parking assist Pedestrian detection/avoidance Rear collision warning/mitigation Self-parking Side impact detection

14
These Systems are Reducing Claims
Vehicles rated “Superior” in front crash avoidance by the Insurance Institute for Highway Safety Cadillac ATS sedan and SRX crossover-utility vehicle Mercedes-Benz C-Class sedan Subaru Legacy sedan and Outback wagon Volvo S60 sedan and XC60 crossover

15
Impact of Level 2 Technology - Cars
Key Features Jam assist Adaptive Cruise Control Lane-keeping Likely Impacts Fewer crashes Lower Stress Some increase in auto commuting trips

16
Google Self-Driving Car (Level 3 Automation) and Someone Who Really Needs One!
 and Someone Who Really Needs One!")
17
Impact of Level 3 Technology - Cars
Key Features Automatic Valet Parking Limited Self-driving – freeways, pre-mapped or programmed routes, good weather Likely Impacts Significant reduction in center city parking time and cost Drivers safely can do some non-driving activities Increases in longer auto commuting trips

18
Impact of Level 4 Technology - Cars
Key Features Unrestricted self-driving Empty vehicle movements permitted Likely Impacts Growth in shared automated taxi services Non-drivers can make low-cost individual trips Time spent in motion no longer wasted – in-vehicle experience is transformed Vehicle trips may exceed person trips

19
Could This be the Future of Self-Driving Cars?

20
The self-driving car as an extension of living or working space

21
You could live in this.

22
Impact of Self-Driving Cars on Transit
Self-driving cars will offer mobility to those transit captives who cannot drive, and, in conjunction with car-sharing, can offer mobility to those who do not have ready access to a car. For choice riders, self-driving cars can offer amenities similar to those of transit in terms of how one can use time while traveling, to read, sleep or work. According to studies, automated cars could double highway capacity. Couple that with the ability to self-park, and the transit advantage could melt away. So the impact on many transit systems could be huge.

23
Potential Applications of Autonomous Driving Technology to Bus Transit
How can transit benefit?

24
Use Autonomous Collision Avoidance Technology to Address a BIG CURRENT Problem

25
Good News! Travel by Bus is getting safer!

26
Good News! Injuries have been trending down!

27
Terrible News! Claims are going through the roof!

28
NTD 2011 Bus Casualty and Liability Expense for All Transit Agencies
NTD 2011 Bus Casualty and Liability Expense for All Transit Agencies Casualty and Liability Amount General Administration $432,228,288 Vehicle Maintenance $50,847,722 Sub-Total Casualty and Liability $483,076,010 Maximum Available Buses 59,871 Sub-Total Casualty and Liability Amount Per Bus $8,069

29
Casualty and Liability Claims are a Huge Drain on the Industry
For the 10 year period , more than $4.1 Billion was spent on casualty and liability claims For many self-insured transit agencies these expenses are direct “out-of-pocket” Large reserves for claims must be budgeted Claims experience is reflected in insurance premiums There are gaps in data reporting

30
Costs of Bus Crashes – Industry Wide
Tangible – reported as casualty and liability expense Physical damage insurance premiums Recovery of physical damage losses for public liability and property damage insurance premiums Insured and uninsured public liability and property damage settlement pay outs and recoveries Other corporate insurance premiums (e.g., fidelity bonds, business records insurance)
")
31
Costs of Bus Crashes – Industry Wide
Tangible -likely not reported as casualty and liability expense Accident investigation D & A testing Emergency services response Hearings and discipline In-house legal services In-house vehicle repair Lost fare revenue Overtime Passenger and service delays Sick time Spare vehicles and replacements Vehicle recovery

32
Costs of Bus Crashes – Industry Wide
Intangible Human loss and suffering Media attention Good will

33
Level 2 Automation - Potential Impact for Transit – Claims Reduction
Adaptive Cruise Control Autonomous emergency braking Blind spot monitoring (for vehicles and pedestrians) Driver fatigue and attentiveness monitoring Lane keeping assistance Obstacle detection and avoidance Rear collision warning and mitigation
 Driver fatigue and attentiveness monitoring. Lane keeping assistance. Obstacle detection and avoidance. Rear collision warning and mitigation.")
34
The Cost of Installing an Autonomous Collision Avoidance System on a Bus Could be Recovered in as Little as One Year Through Reductions in Casualty and Liability Claims

35
Potential for Cost Savings in Annual Claims Paid by Installing a Collision Avoidance System on NJ TRANSIT Buses Estimated Average Annual Claims Reduction per Bus Collision Avoidance System Installation Costs Based on Mercedes Intelligent Drive System $2,800 per Bus – 2014 Base Price $5,600 per Bus – 2x Base Price $8,400 per Bus – 3x Base Price $11,200 per Bus – 4x Base Price $14,000 per Bus – 5x Base Price (%) ($) Estimated Years to Recoup Installation Cost 10 484.60 5.8 11.6 17.3 23.1 28.8 20 969.20 2.9 8.7 14.4 30 1,453.80 1.9 3.9 7.7 9.6 40 1,938.40 1.4 4.3 7.2 50 2,423.00 1.1 2.3 3.5 4.6 60 2,907.60 1.0 4.8 70 3,392.20 0.8 1.7 2.5 3.3 4.1 80 3,876.80 0.7 2.2 3.6 90 4,361.40 0.6 1.3 2.6 3.2
 ($) Estimated Years to Recoup Installation Cost , , , , , , ,")
36
Potential Impact for Transit – Level 3 Automation
Key Features Co-operative Adaptive Cruise Control Lane keeping Precision docking Potential Impacts Increased capacity in high volume bus corridors

37
A Capacity Bonus for NJ TRANSIT Exclusive Bus Lane (XBL) to New York City Source: Port Authority of New York and New Jersey
 to New York City Source: Port Authority of New York and New Jersey")
38
Port Authority Bus Terminal (PABT) New York City
Source: Google Maps 2013

39
Potential Increased Capacity of Exclusive Bus Lane (XBL) Using Cooperative Adaptive Cruise Control (CACC) (Assumes 45 toot (13.7 m) with 57 seats) Average Interval Between Buses (seconds) Average Spacing Between Buses (ft) Average Spacing Between Buses (m) Buses Per Hour Additional Buses per Hour Seated Passengers Per Hour Increase in Seated Passengers per Hour 1 6 2 3,600 2,880 205,200 164,160 47 14 1,800 1,080 102,600 61,560 3 109 33 1,200 480 68,400 27,360 4 150 46 900 180 51,300 10,260 5 (Base) 212 64 720 - 41,040
 Average Spacing Between Buses (ft) Average Spacing Between Buses (m) Buses Per Hour. Additional Buses per Hour. Seated Passengers Per Hour. Increase in Seated Passengers per Hour ,600. 2, , , ,800. 1, , , , , , , , (Base) ,040.")
42
Potential Impact for Transit – Level 4 Automation
Key Features Bus capable of fully automated operation Potential Impacts Unstaffed non-revenue operation Paired or bus “train” operation possible BRT systems can emulate rail in capacity at less cost

43
Connected Vehicle and Autonomous Driving Technology for Bus Platooning – Leader/Close-Follower Concept Schematic – Wireless Short-Range Connections Between Busses Interface with Automated Driving and Passenger Systems Functions

45
Opportunities for Autonomous Driving Technology in Transit - Recommendations
Institutional Response Technological Response

46
Recommendation - Transit Institutional Response
Promote shared-use autonomous cars as a replacement for transit on many bus routes and for service to persons with disabilities Exit markets where transit load factors are too low to justify operating a transit vehicle Concentrate transit resources in corridors where more traffic and parking will be too costly and too congested, and where transit can increase the people carrying capacity of a lane beyond that of a general traffic lane

47
Recommendation - Transit Institutional Response- Continued
Focus attention on land use – work with partners to create Transit-Oriented Development that limits the need for driving and where trip-end density will provide enough riders Create compact activity centers Allow higher density Promote mixed use development Make streets pedestrian and bike friendly Manage parking ratios and configuration

48
Recommendations- Transit Technological Response
What we need to do

49
Prepare for Technological Evolution and Obsolescence
Buses last from 12 to 18 years or more Computer technology becomes obsolete in 18 months to two years Expect to replace components and systems several times during the life of a bus Do not expect replacement parts to still be available Sometimes stuff does not work as expected

50
Need Open Architectures and Standards
Avoid problems of legacy systems and sole source procurements Modular systems and components Standard interfaces between systems and components Multiple sources and innovation from vendors “Plug and play”

51
Federal Transit Administration Notice of Funding Availability
Federal Register October 1, 2013 Seeking Research Development Demonstration & Deployment Projects – 3 Categories Operational Safety Resiliency All Hazards Emergency Response & Recovery $29 million available Grants from $500k to $5 million Open to anyone Deadline December 2, 2013

52
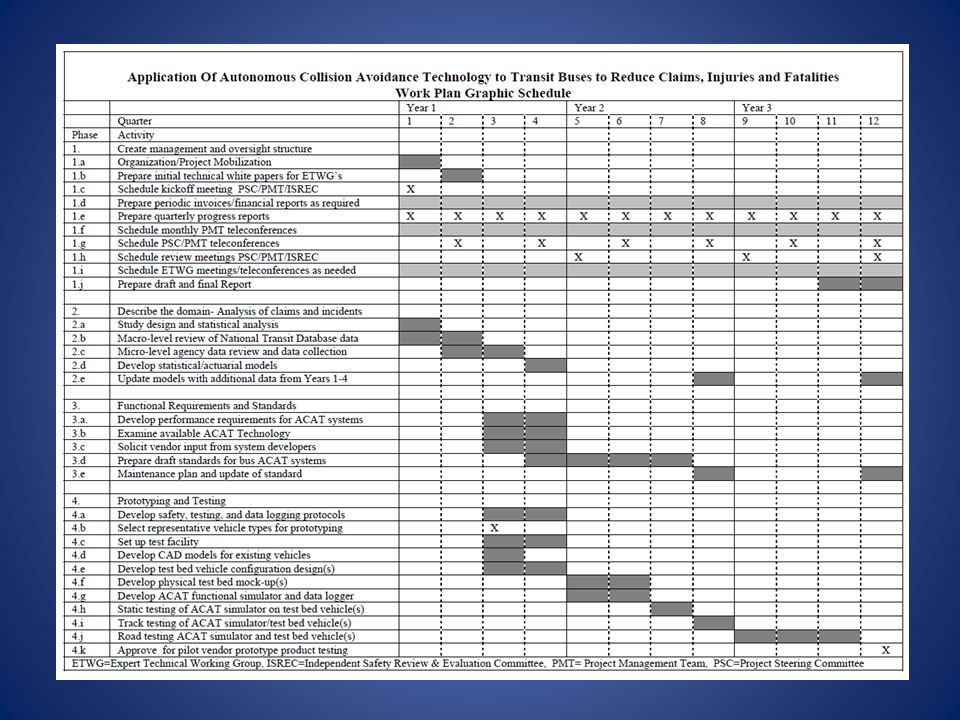
Proposal Title: Application of Autonomous Collision Avoidance Technology to Transit Buses to Reduce Claims, Injuries and Fatalities Submitted by Princeton University In association with: American Public Transportation Association Greater Cleveland Regional Transit Authority Washington State Transit Insurance Pool Jerome M. Lutin, PhD, LLC

53
ENDORSING/SUPPORTING ENTITIES Washington State Transit Insurance Pool On Behalf of 25 Member Agencies: Asotin County Public Transportation Benefit Area Kitsap Transit Link Transit Ben Franklin Transit Mason County Transit Clallam Transit Pacific Transit Columbia County Public Transportation Pierce Transit Community Transit Pullman Transit C-Tran River Cities Transit Everett Transit Skagit Transit Grant Transit Spokane Transit Grays Harbor Transit Twin Transit Intercity Transit Valley Transit Island Transit Whatcom Transit Jefferson Transit Yakima Transit

54
ENDORSING/SUPPORTING ENTITIES
California Transit Indemnity Pool On Behalf of 33 Member Agencies Ohio Transit Risk Pool On Behalf of 10 Member Agencies Virginia Transit Liability Pool On Behalf of 7 Member Agencies

55
1. Create a broad, inclusive stakeholder group of transit agencies and other members of the transit industry, and achieve a comprehensive view of the problem and potential solutions from all sides representatives of transit agencies risk management and insurance providers consultants vehicle manufacturers systems developers standards organizations vendors motor vehicle regulators USDOT officials

56
Expert Technical Working Groups (ETWG’s)
Claims analysis and data collection Human factors/operations/safety Bus interfaces/systems/maintainability Autonomous systems and controls Testing and certification

57
2. Conduct a research assessment of why casualty and liability claims are increasing and determine the potential for automated collision avoidance systems to reduce fatalities, injuries and claims historical trends reasons that the costs of collisions are increasing relationship between costs and types of accidents link individual claims and other expenses with individual incidents assemble an accurate record of the total agency cost of each collision identify cost-effective autonomous collision avoidance technologies

58
3. ETWG’s develop functional requirements and standards to allow installation of autonomous collision avoidance technology (ACAT) and driver assist technology on new transit buses and retrofit of existing buses define the capabilities and performance requirements for autonomous collision avoidance technology for buses allow autonomous collision avoidance technologies to be retrofitted to buses, using competitive procurements and “plug and play” interfaces balloted set of standards for autonomous collision avoidance technology and for the electromechanical and data on-board interfaces needed to host the technology

59
4. Develop a prototype test bed that would allow developers of innovative collision avoidance and driver assist technologies to work with transit agencies and researchers to expedite development and deployment on-board test-bed network using electromechanical and data interface standards developed in Phase 3, to accommodate the installation and testing of prototype autonomous collision avoidance technologies collision avoidance system simulator that can be installed on a new or retrofitted bus to test the bus’s ability to host, and autonomously respond to inputs from, a collision avoidance system data logger and analyzer that will monitor multiple performance parameters of both the bus and the autonomous collision avoidance technology and produce reports that can be used to certify compliance with the performance requirements and standards extensive field operational test of all three elements

60
Contribution from Greater Cleveland Regional Transit Authority (GCRTA)
Four technical staff members, one to participate in each of four Expert Technical Working Groups for the duration of the project, representing approximately 10% time for each staff member Staff time for data collection on collisions and claims, representing 10% time for two staff members for six months Two buses to be used as test beds for installation and testing of autonomous collision avoidance technology for a period of approximately two years. Approximately 3,600 square feet of space in our garage for two years for prototype development Technical support from bus maintenance and operations staff representing approximately 50% time for two technicians

62
Next Steps Wait to hear about FTA grant If awarded, get busy!
If not awarded-find out why Revise proposal Resubmit Look for alternative funding Keep pressing FTA Don’t give up – This is worth doing!

63
Jerry Lutin Jerome.Lutin@Verizon.net
Thank You Jerry Lutin

Similar presentations