Download presentation
Presentation is loading. Please wait.

1
Plans to improve estimators to better utilize panel data John Coulston Southern Research Station Forest Inventory and Analysis

2
Background and Motivation Symposium session on combining panel data: Recommendation –…any serious attempt at defining an estimation system for analysis of changes and trends over time must explicitly account for time in the assumed underlying model…adopt and encourage an inferential model for FIA that places time on an equal footing with area… Putting the A back in FIA – Clutter 2006.

3
Examples and approach Forest area change in Georgia from 1998- 2007 Spatial realization of forest age structure in Alabama in 2007 Use an appropriate technique for the question posed

4
Why reinvent the wheel? Some analytical alternatives to Bechtold and Patterson 2005 for the annual forest inventory –Mixed estimator (Van Deusen 1999, 2002) Current estimates – flexible underlying trend –Mixed model (Smith & Conkling 2005) Current estimates and significance of annual change – linear trend –Random Forest ( Breiman 2001, Crookston & Finley 2008) Machine learning approach to classification and regression. Implemented in temporal map based estimation.
 Current estimates – flexible underlying trend –Mixed model (Smith & Conkling 2005) Current estimates and significance of annual change – linear trend –Random Forest ( Breiman 2001, Crookston & Finley 2008) Machine learning approach to classification and regression. Implemented in temporal map based estimation..")
5
Is there a trend in Georgia forest area from 1998-2007

6
Mixed Estimator

7
Mixed Model

8
Stratified Estimate

9
Is there a trend in Georgia forest area from 1998-2007

10
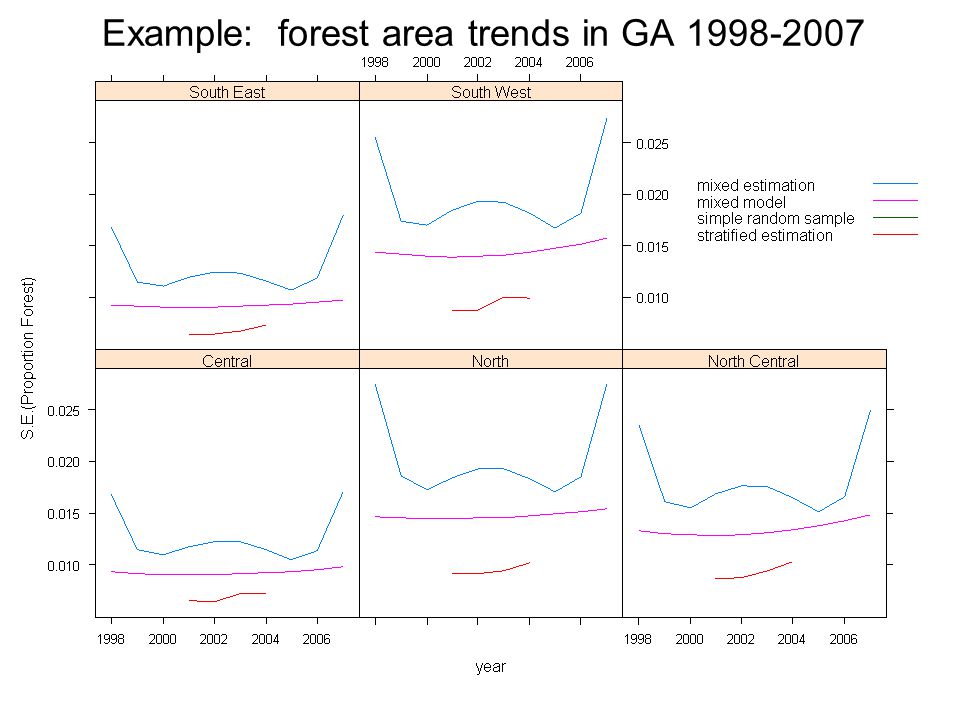
Example: forest area trends in GA 1998-2007

12
Typical sampling error approach Hypothesis: H0: Δpf=0 H1: Δpf0 Approach: Sampling errors overlap so no significant change. Issues: Type II errors; Failure to leverage repeated measures

13
Explicitly testing for change If trend is sufficiently linear then the mixed model can be used to test HO: b1 = 0 H1: b1 0 Recall the mixed model: b 1 is the slope (change in y over time).
.")
14
Example 2: Spatial realization of forest age structure in Alabama in 2007 Using a time-series on Landsat images identify the disturbance year and magnitude for each pixel. Calibrate the disturbance year and magnitude information to FIA age class information based on: C jz =f(X z,Y z,M z(j-d),(j-d) z,F jz ) Where c jz is the age class for location z at time j. X z =longitude of location z Y z =latitude of location z M z(j-d) =magnitude of last disturbance in year j-d at location z. (j-d) z =the number of years since the last disturbance at location z. F jz =land cover in year j at location z.
,(j-d) z,F jz ) Where c jz is the age class for location z at time j. X z =longitude of location z Y z =latitude of location z M z(j-d) =magnitude of last disturbance in year j-d at location z. (j-d) z =the number of years since the last disturbance at location z. F jz =land cover in year j at location z..")
15
Random Forest Algorithm Learning algorithm Each tree is constructed using the following algorithm: 1. Let the number of training cases be N, and the number of variables in the classifier be M. 2. We are told the number m of input variables to be used to determine the decision at a node of the tree; m should be much less than M. 3. Choose a training set for this tree by choosing N times with replacement from all N available training cases (i.e. take a bootstrap sample). Use the rest of the cases to estimate the error of the tree, by predicting their classes. 4. For each node of the tree, randomly choose m variables on which to base the decision at that node. Calculate the best split based on these m variables in the training set. 5. Each tree is fully grown and not pruned (as may be done in constructing a normal tree classifier).
. Use the rest of the cases to estimate the error of the tree, by predicting their classes. 4. For each node of the tree, randomly choose m variables on which to base the decision at that node. Calculate the best split based on these m variables in the training set. 5. Each tree is fully grown and not pruned (as may be done in constructing a normal tree classifier)..")
18
Accuracy of Age Class Map

19
Conclusions No one technique could answer the two question posed Use the appropriate methodology or combination of methodologies to address your question. From the examples, time should be explicitly accounted for when doing trend analysis or making current estimates. Leverage the longitudinal (repeated measure) data when possible. The temporally indifferent method currently used by FIA does generally provide estimates with smaller standard error. However, it is not a current estimate and the estimate should be tied to the approximate mid-point of the cycle – not the end year. All demonstrated techniques run using the R statistical package which can be directly linked to either internal oracle tables or FIADB.
 data when possible. The temporally indifferent method currently used by FIA does generally provide estimates with smaller standard error. However, it is not a current estimate and the estimate should be tied to the approximate mid-point of the cycle – not the end year. All demonstrated techniques run using the R statistical package which can be directly linked to either internal oracle tables or FIADB..")
Similar presentations


![Evaluation of Results (classifiers, and beyond) Biplav Srivastava Sources: [Witten&Frank00] Witten, I.H. and Frank, E. Data Mining - Practical Machine.](/17/5322195/big_thumb.jpg "Evaluation of Results (classifiers, and beyond) Biplav Srivastava Sources: [Witten&Frank00] Witten, I.H. and Frank, E. Data Mining - Practical Machine.>")