Download presentation
Presentation is loading. Please wait.

1
New Century, Old Disparities Gender Wage Gaps in Latin America Hugo Ñopo (based on work with Juan Pablo Atal, Alejandro Hoyos, and Natalia Winder)
")
2
The One Slide Presentation What is this paper about? Harmonized and comparable measures of gender and ethnic wage gaps for 18 countries in the region A refined answer to the old question: To what extend gender and ethnic differences in individuals characteristics can explain the differences in earnings? Methodological improvements: Matching and a decomposition that recognizes not only differences on average characteristics but also on their distribution; and most importantly, on their supports Findings? New Insights? Gender wage gaps between 8% and 28%, dropping around 4 points in 15 years (1992-2007). Higher gaps among older people, those with lower income, with secondary education, self-employed, informal and those in small firms Surprising role for occupational and sector segregation An across-the-board reduction over the last decade, but especially among those with kids at home, part- time workers and those previously found with higher gaps
. Higher gaps among older people, those with lower income, with secondary education, self-employed, informal and those in small firms Surprising role for occupational and sector segregation An across-the-board reduction over the last decade, but especially among those with kids at home, part- time workers and those previously found with higher gaps.")
3
Outline Setup of the Problem. Methodological considerations Blinder-Oaxaca decompositions Matching Combining the two tools Empirical Results. LAC (circa 2005; 1992-2007) The Data For Ethnic and Gender Gaps Averages Distributions The role of occupational and sector segregation For Gender Gaps Evolution Conclusions
 The Data For Ethnic and Gender Gaps Averages Distributions The role of occupational and sector segregation For Gender Gaps Evolution Conclusions.")
4
1. Setup of the Problem. Methodological considerations Blinder-Oaxaca decompositions Matching Combining the two tools

5
Gender Differences in: Wages Individual Characteristics Age Education Individual Characteristics Urban and Rural Area Presence of children in the HH Presence of other income earner in the HH Job Characteristics Occupation Sector Type of employment Part – time Formality Firm size

6
Blinder-Oaxaca Decompositions The wage gap is separated into two additive components One attributable to the existence of differences in the average characteristics of females and males The other attributable to the existence of differences in the rewards that females and males get for the same characteristics Discrimination Unobservable characteristics

7
Blinder-Oaxaca Decomposition. Linear Setup

8
Critiques Recent data violates key implications of the Mincerian model Hansen (1999) Heckman, Lochner and Todd (2001) B-O is informative only about the average decomposition, no clues about the distribution of the components Jenkins (1994) DiNardo, Fortin and Lemieux (1996) Donald, Green and Paarsch (2000) Bourguignon, Ferreira and Leite (2008) The comparison should be restricted only to comparable individuals. The failure to recognize this fact may bias the estimates in the gap decomposition Barsky, Bound, Charles and Lupton (2001) The relationship governing characteristics and wages is not necessarily linear
 The relationship governing characteristics and wages is not necessarily linear.")
9
Matching. Impact Evaluation Treatment effects Identification of counterfactual situations Extensively used in the Program Evaluation literature Rubin (1977) Heckman, Ichimura and Todd (1998) Heckman, LaLonde and Smith (1998) Angrist (1998) Dehejia and Wahba (1998)
 Heckman, Ichimura and Todd (1998) Heckman, LaLonde and Smith (1998) Angrist (1998) Dehejia and Wahba (1998).")
10
The Main Counterfactual Question What would the distribution of earnings for males be, in the case that their individual characteristics follow the distribution of the characteristics for females?

11
The Matching Algorithm For each possible value of the vector of characteristics x: Select all females with these characteristics n F (x) Select all males with these characteristics n M (x) If n F (x)=0 and n M (x)>0 unmatched males If n F (x)>0 and n M (x)=0 unmatched females If n F (x)>0 and n M (x)>0 reweight: Each female with 1 Each male with n F (x)/n M (x)
 Select all males with these characteristics n M (x) If n F (x)=0 and n M (x)>0 unmatched males If n F (x)>0 and n M (x)=0 unmatched females If n F (x)>0 and n M (x)>0 reweight: Each female with 1 Each male with n F (x)/n M (x)")
15
Maids CEOs

16
The Matching Algorithm Result: A sample of matched females and males with the same distribution of observable individual characteristics (but not necessarily the same distribution of earnings). A sample of unmatched females and another of unmatched males

17
This Matching Approach is… A non-parametric alternative to B-O decompositions that has advantages in terms of: Simplicity Avoiding the estimation of earnings equations Flexibility It contains all possible propensity scores Identification/Correct specification Recognizing that the supports of empirical distributions of characteristics do not completely overlap (the failure to recognize this leads to an overestimation of the unexplained component of the wage gap) Information Allowing us to compute directly the distribution of the unexplained effects, not just the average
 Information Allowing us to compute directly the distribution of the unexplained effects, not just the average")
18
The New Decomposition and Matching

19
2. Empirical Results. LAC (circa 2005) The Data Gender Gaps Averages Distributions The role of occupational and sector segregation
 The Data Gender Gaps Averages Distributions The role of occupational and sector segregation.")
20
The Data

21
The pooled data set Covering all Latin American countries (except rural Argentina and Uruguay) Use of expansion factors, so the size of the economies are properly represented (all but Mexico) Income measures are normalized to 2002 PPP USD, deflated by nominal GDP After that, average females (minorities) income is normalized to one
 Use of expansion factors, so the size of the economies are properly represented (all but Mexico) Income measures are normalized to 2002 PPP USD, deflated by nominal GDP After that, average females (minorities) income is normalized to one")
22
Relative Wages by Characteristics Source: Authors calculations using Household Surveys circa 2005.

23
Relative Wages by Characteristics Source: Authors calculations using Household Surveys circa 2005.

24
Relative Wages by Characteristics Source: Authors calculations using Household Surveys circa 2005.

25
Descriptive statistics Source: Authors calculations using Household Surveys circa 2005.

26
Descriptive statistics Source: Authors calculations using Household Surveys circa 2005.

27
Gender Wage Gap Decompositions Source: Authors calculations using Household Surveys circa 2005.

28
Gender Wage Gap Decompositions by Job Related Characteristics Source: Authors calculations using Household Surveys circa 2005.

29
Unexplained Gender Wage Gaps by country Source: Authors calculations using Household Surveys circa 2005. *Statistically different than zero at the 99% level Statistically different than zero at the 95% level

30
Gender Wage gap Decompositions by Country

31
Confidence Intervals for the Unexplained Gender Gap

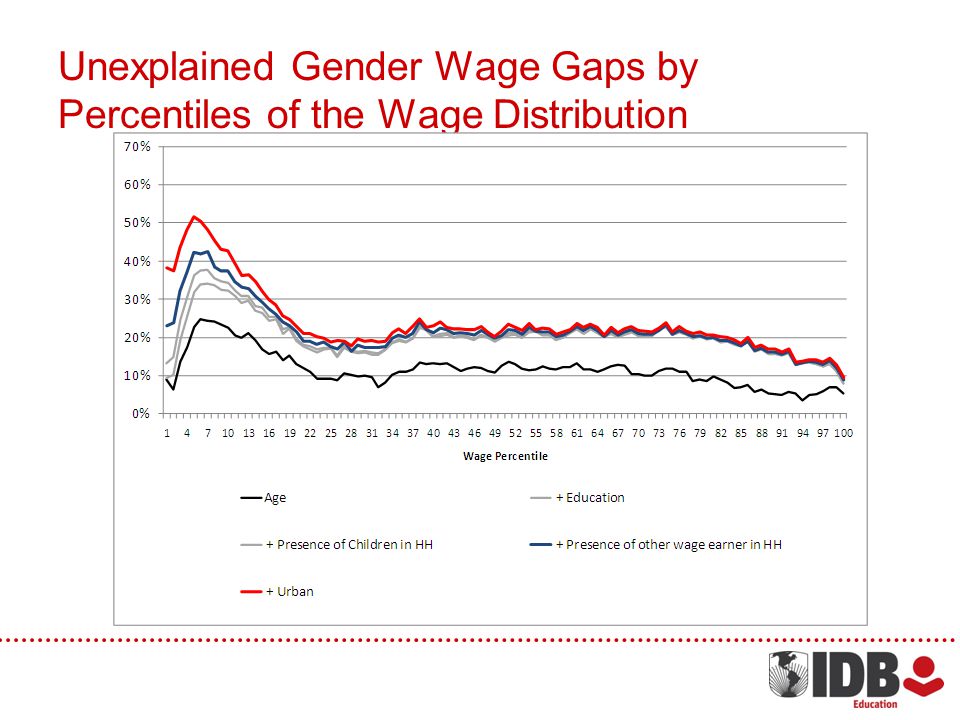
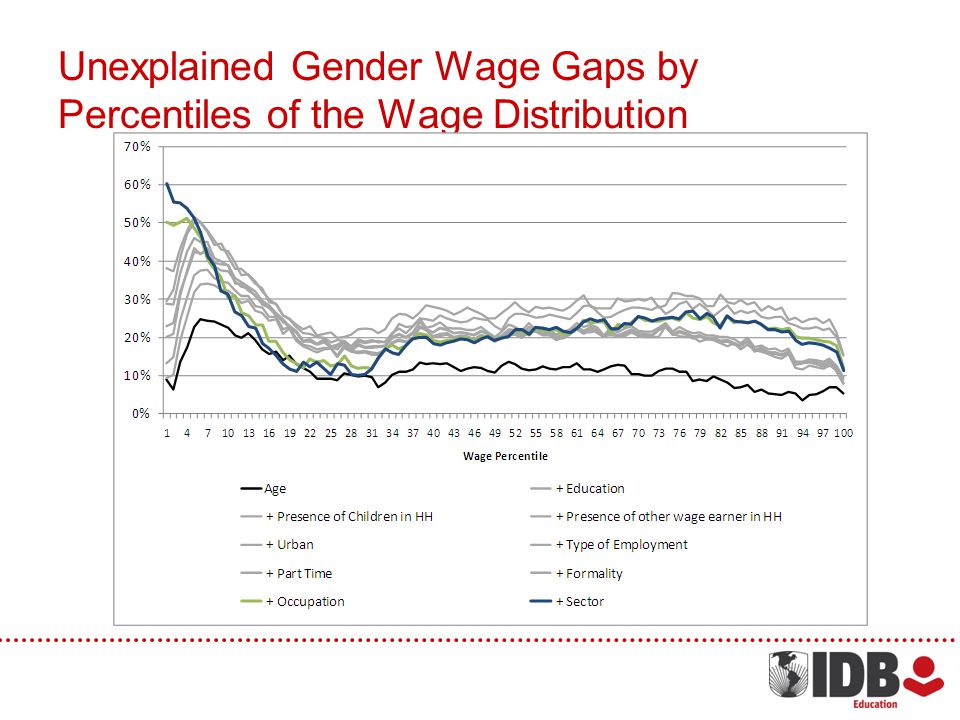
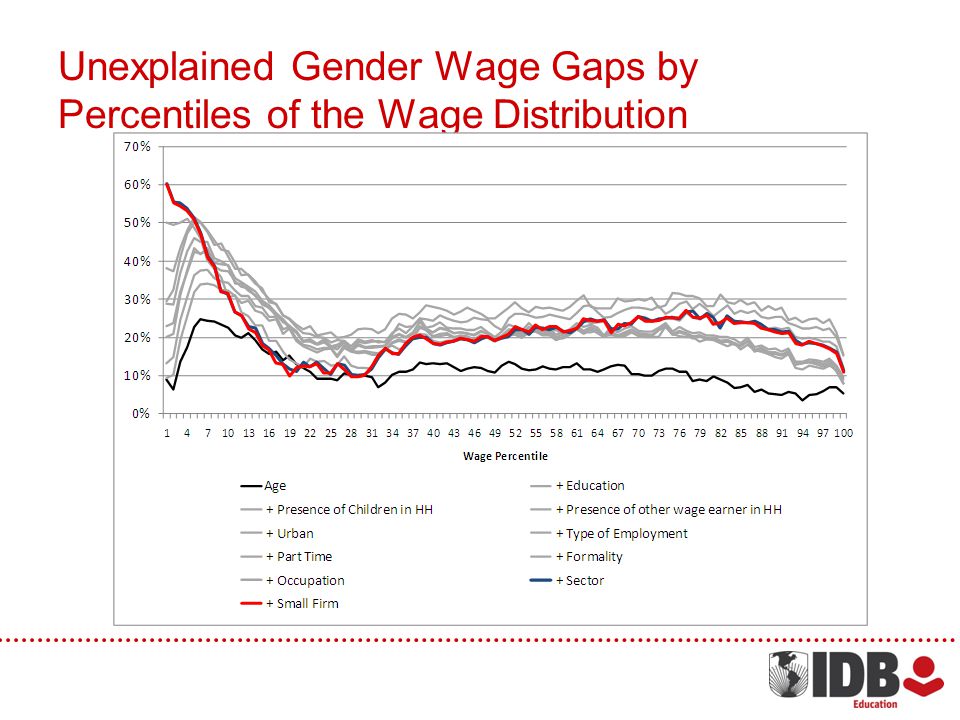
32
Unexplained Gender Wage Gaps by Percentiles of the Wage Distribution

33
Females have more schooling, but they do not earn more

34
Unexplained Gender Wage Gaps by Percentiles of the Wage Distribution

43
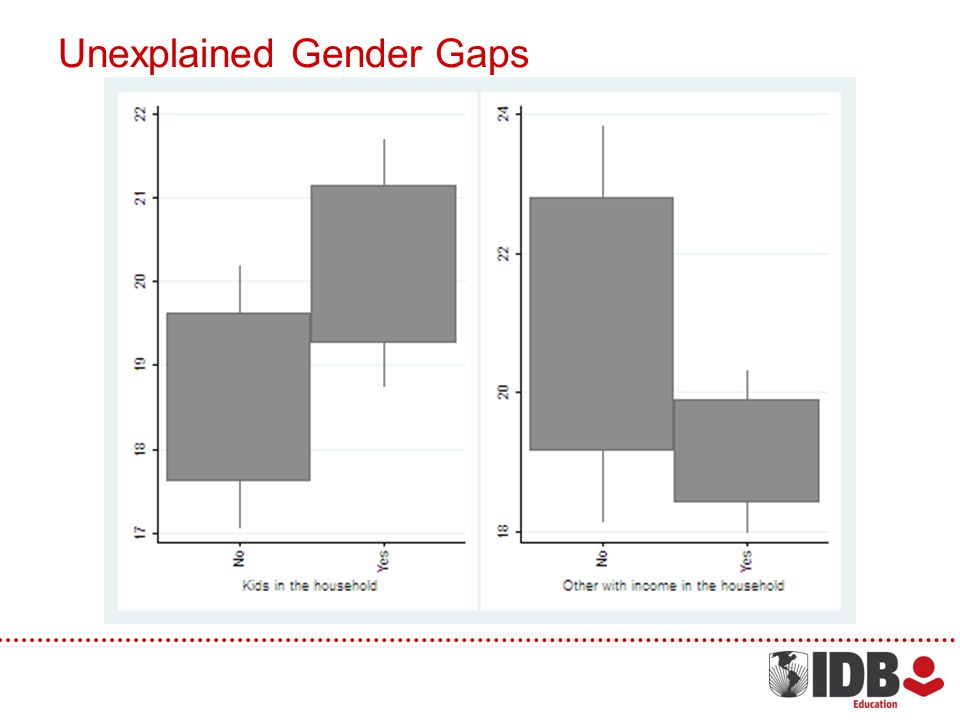
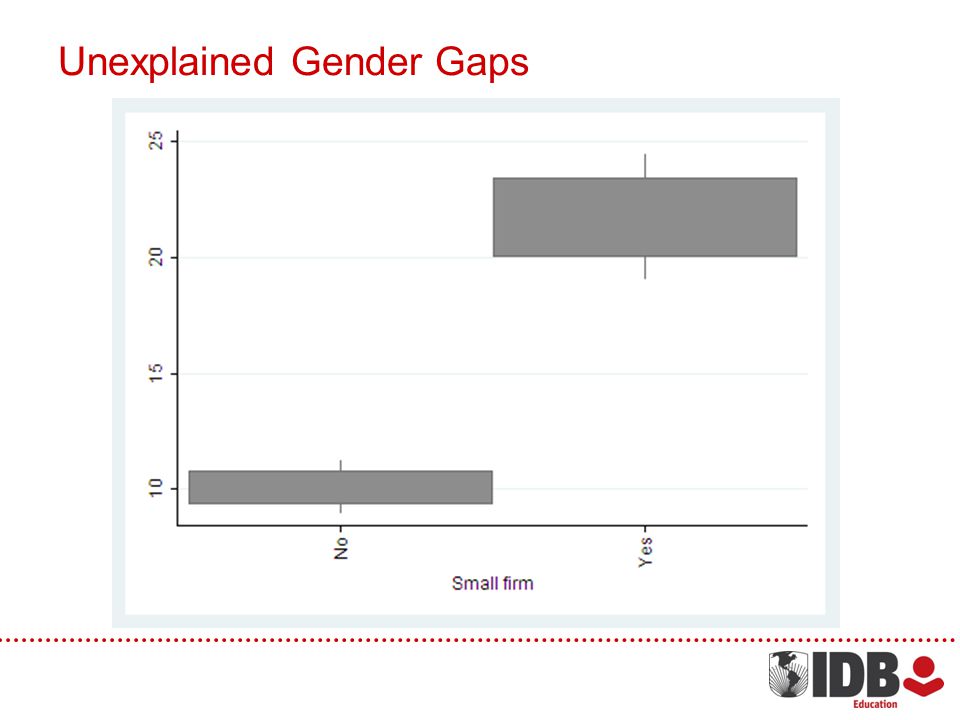
Unexplained Gender Gaps

49
The Role of Job Tenure

50
The Role of Job Tenure II

51
A look at the evolution of Gender Wage Gaps

52
Drop in Gender Earnings Gaps (15-year span)
")
53
The Gap has Dropped in Most Countries

54
And it Has Dropped Especially at Both Extremes of the Earnings Distribution

55
It Has Dropped more among Low-Educated People

56
It has dropped more in rural areas

57
It Has Dropped more among the Self-Employed

58
It Has Dropped more among those with Children at Home

59
It Has Dropped more among Part-Time Workers

60
It has dropped for older cohorts

61
(matching after matching)
")
62
3. Conclusions Methodological Advantages/Disadvantages Messages

63
Advantages/Disadvantages It is not necessary to estimate earnings equations (no functional form assumption) Better assessment. The traditional approach seems to deliver biased results when the differences in supports are not taken into account Once the matching has been done, it is straightforward to: Explore the distribution of the unexplained wage gap Explore not only wage gaps but also gaps for other labor market outcomes (participation, unemployment, unemployment spells, segregation) Curse of Dimensionality. The method does not allow us to use too many explanatory variables. It does not take into account selection into the labor markets
 Curse of Dimensionality. The method does not allow us to use too many explanatory variables. It does not take into account selection into the labor markets.")
64
Summary Gender wage gaps Between 8% and 28%. older people, those with lower income, with secondary education, self-employed, informal and those in small firms Some CEO effects (in some countries) Somewhat surprising segregation effects An overall reduction over the last 15 years, especially for those segments of the labor markets with the highest disparities. And the reductions are not explained by changes in the labor markets composition
 Somewhat surprising segregation effects An overall reduction over the last 15 years, especially for those segments of the labor markets with the highest disparities. And the reductions are not explained by changes in the labor markets composition.")
Similar presentations