Download presentation
Presentation is loading. Please wait.

1
Atomic Spectroscopy Energy Level Diagrams Sample Introduction
Sources for Atomic Absorption Hollow Cathode Lamps Sources for Atomic Emission Flames Plasmas Furnaces Wavelength Separators Comparison of Techniques FAAS vs. ETAAS vs. ICP-AES I would encourage you to read the following on reserve in Milne. Inductively Coupled Plasma and Its Applications 1-28, 71-92 An Introduction to Analytical Atomic Spectrometry 1-47,

5
Sample Introduction (common)
")
7
Sample Introduction Venturi Effect and Atomization
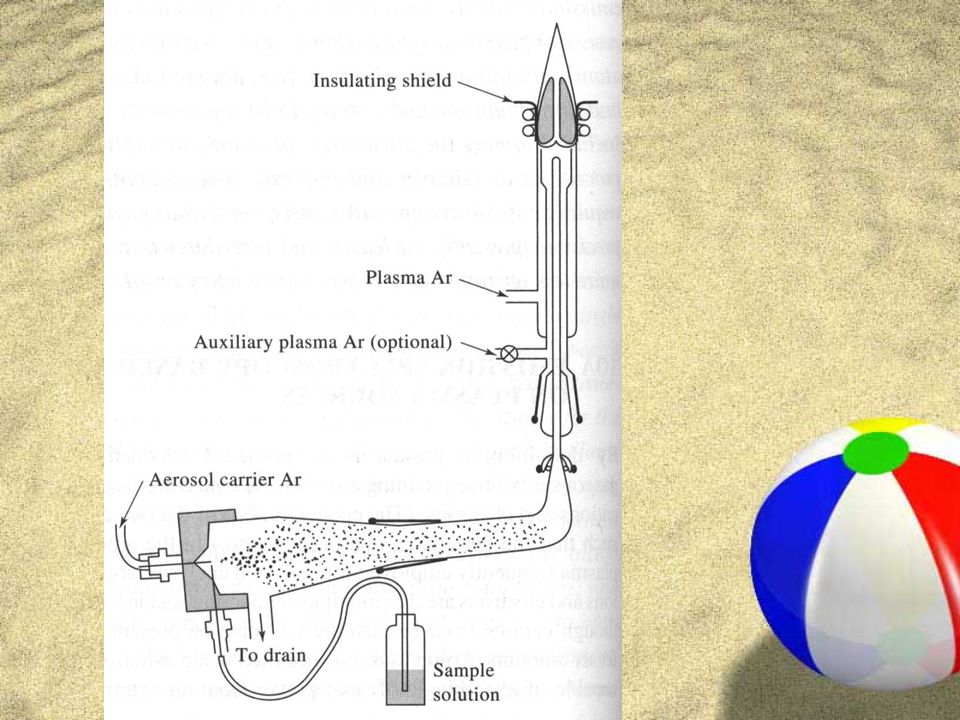
Pneumatic Nebulizers (for ICP techniques) Break the sample solution into small droplets. Solvent evaporates from many of the droplets. Most (>99%) are collected as waste The small fraction that reach the plasma have been de-solvated to a great extent.
 Break the sample solution into small droplets. Solvent evaporates from many of the droplets. Most (>99%) are collected as waste. The small fraction that reach the plasma have been de-solvated to a great extent.")
10
Flame AAS/AES Spray Chamber/Burner Configurations
Samples are nebulized (broken into small droplets) as they enter the spray chamber via a wire capillary Only about 5% reach the flame Larger droplets are collected Some of the solvent evaporates Flow spoilers Cheaper, somewhat more rugged Impact beads Generally greater sensitivity
 as they enter the spray chamber via a wire capillary. Only about 5% reach the flame. Larger droplets are collected. Some of the solvent evaporates. Flow spoilers. Cheaper, somewhat more rugged. Impact beads. Generally greater sensitivity.")
12
In FAAS, a key consideration is the height above the burner that the analyte absorption is measured at (burner positions are adjustable)! Temperature value (adjusted using different fuel/oxidant ratios) and consistency are important.
 and consistency are important..")
15
ElectroThermal AAS (ETAAS, GFAAS)
The sample is contained in a heated, graphite furnace. The furnace is heated by passing an electrical current through it (thus, it is electro thermal). To prevent oxidation of the furnace, it is sheathed in gas (Ar usually) There is no nebulziation, etc. The sample is introduced as a drop (usually uL) The furnace goes through several steps… Drying (usually just above 110 deg. C.) Ashing (up to 1000 deg. C) Atomization (Up to deg. C) Cleanout (quick ramp up to 3500 deg. C or so). Waste is blown out with a blast of Ar. The light from the source (HCL) passes through the furnace and absorption during the atomization step is recorded over several seconds. This makes ETAAS more sensitive than FAAS for most elements.
. To prevent oxidation of the furnace, it is sheathed in gas (Ar usually) There is no nebulziation, etc. The sample is introduced as a drop (usually uL) The furnace goes through several steps… Drying (usually just above 110 deg. C.) Ashing (up to 1000 deg. C) Atomization (Up to deg. C) Cleanout (quick ramp up to 3500 deg. C or so). Waste is blown out with a blast of Ar. The light from the source (HCL) passes through the furnace and absorption during the atomization step is recorded over several seconds. This makes ETAAS more sensitive than FAAS for most elements.")
17
Sources (for FAAS and ETAAS)
Hollow Cathode Lamps (HCL) are the main source. These are element specific, constructed of the same element you are analyzing. A current is passed through the lamp, exciting the element of interest. As it returns to the ground state, it emits light which is focused through the sample. Since emission/absorption is quantized, this is the same wavelength of light that the analytes will absorb! Multielement lamps are available. Limited lifespan, treat carefully, do not exceed specified maximum current!
 are the main source. These are element specific, constructed of the same element you are analyzing. A current is passed through the lamp, exciting the element of interest. As it returns to the ground state, it emits light which is focused through the sample. Since emission/absorption is quantized, this is the same wavelength of light that the analytes will absorb! Multielement lamps are available. Limited lifespan, treat carefully, do not exceed specified maximum current!")
19
FAAS and ETAAS Considerations…
Temperature level and consistency are key. Alignment of the source light is important. Since temperatures are relatively low, refractory species and excessive amounts of complexes can form in the flame Hinder ATOMIC absorption Analytes may also be lost by volatilization prior to the absorption of light. Matrix modifiers may overcome these two barriers. Reduce oxide and oxyhydroxide formation Reduce sample loss from volatilization Complex with interfering species (molecular) Ammonium chloride, palladium nitrate, magnesium nitrate, for example
 Ammonium chloride, palladium nitrate, magnesium nitrate, for example.")
20
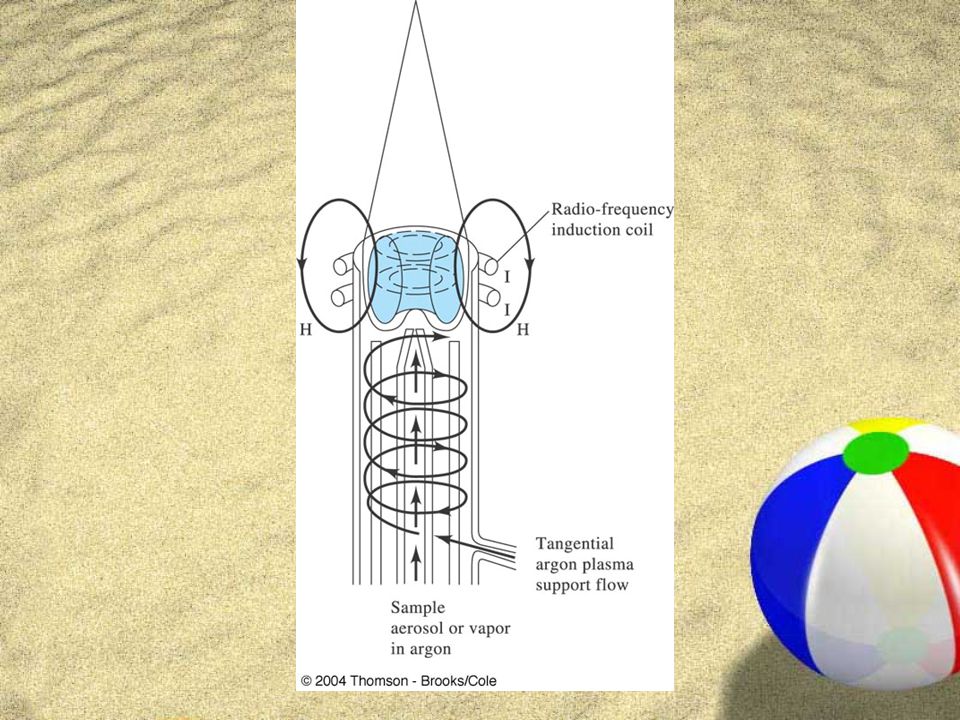
ICP-AES (ICP-OES) Inductively coupled plasmas are at least 2X as hot as flames or furnaces. The Ar plasma is the result of the flow of Ar ions in a very strong, localized radio field. K are common plasma temperatures. Hot enough to excite most elements so they emit light. Hot enough to prevent the formation of most interferences, break down oxides (REEs) and eliminate most molecular spectral interferences. The way to do atomic emission spectroscopy today.
 and eliminate most molecular spectral interferences. The way to do atomic emission spectroscopy today.")
26
Wavelength Separators for Atomic Spectroscopy
Must be able to separate light that might be only a fraction of nm from the next nearest wavelength of light Atomic spectra are complex! Usually Czerny-Turner configuration or a modification of it. Need to incorporate background correction Atomic spectra are complex with many possible spectral interferences Lamp intensities may fluctuate Flame composition may fluctuate Over time on the same sample From sample to sample

27
Double Beam AAS Instruments account for instability in the source
Double Beam AAS Instruments account for instability in the source. Other techniques are added to account for scattering if light in the sample and the absorption of light by non-atomic species in the sample. In the example shown here, P/Po is alternatively recorded by the instrument to cancel out short-term lamp fluctuations.

28
Deuterium Background Correction: A D2 lamp (continuum lamp) alternately passes light through the sample with the HCL. Analytes don’t absorb much D2 radiation since it is a continuum source. The light absorbed with the HCL light passes through the sample minus the light absorbed when the D2 radiation passes through is the signal that is measured.

29
Wavelength Separators for ICP-AES
Must have greater resolving power than those for AAS methods. Plasmas are hotter, therefore the spectra are more complex. ICP techniques usually cover a wider range of wavelengths 190 – 900 nm Different detectors for different wavelengths PMTs still #1 choice, but CCD arrays also common. The light emitted by an ICP is also more intense! Slits must have greater adjustability….. Sequential (scanning) ICP-AES instruments are now less common than simultaneous (like a diode array UV-VIS) instruments.
 ICP-AES instruments are now less common than simultaneous (like a diode array UV-VIS) instruments.")
32
A Modern “Sequential” ICP with a Monochromator

33
A Modern “Simultaneous” ICP Design (most instruments sold now are simultaneous)
")
34
An Earlier Polychromator Design used in ICP Instruments

Similar presentations


I>")


>")


 Nebulizers b. Electrothermal atomization.>")
>")

 Atomic X-ray Spectrometry (Ch 12) Atomic Mass.>")


