Download presentation
Presentation is loading. Please wait.

1
Disease and Gene Associations Elizabeth R. Hauser Duke University Center for Human Genetics North Carolina Genomics Symposium March 18, 2005

2
Breaking News- March 14, 2005 3 Research Teams independently identify a gene for macular degeneration

4
Significance of AMD result Affects 1 in 5 people over age 65 Complex disease –Clearly a genetic component –Important environmental risk (e.g. Smoking) Multiple groups identified the same polymorphism –accounts for 20-50% of the overall risk in these studies Each group used a slightly different approach Genetic analysis was an important step –Started with linkage and proceeded to association Human Genome Project provided key information
 Multiple groups identified the same polymorphism –accounts for 20-50% of the overall risk in these studies Each group used a slightly different approach Genetic analysis was an important step –Started with linkage and proceeded to association Human Genome Project provided key information.")
5
The CFH gene for Age-related Macular Degeneration is the most recent example of a gene for a common disease, whose identification was greatly enhanced by the Human Genome Project. These are exciting times in which to be doing research on genetic determinants of disease!

6
Outline Types of genetic disease Evidence for the involvement of genes Study designs and analysis methods Taking complexity into account Coronary artery disease example

7
Simple vs complex disease Disease definition=phenotype –Simple traits=> Easily defined –Complex traits=> Difficult to determine –How is the diagnosis made? Measurements Instruments May be expensive to collect –There may be ambiguity in the definition of disease Affected well defined, Unaffected ? Coronary artery disease requires specialized procedures –Coronary catheterization –Stress tests –Clinical event, such as heart attack or bypass operation

8
Monogenic Diseases Complex Diseases Environmental Diseases Huntington Disease Spinocerebellar Ataxia Spastic Paraplegia Tuberous Sclerosis Alzheimer disease Cardiovascular Disease Autism Parkinson Disease Influenza Hepatitis Measles Genes and Disease - Genes - Environment

9
Causative or Mendelian Gene Gene directly leads to disorder Recognizable inheritance patterns One gene per family Less common diseases –Cystic fibrosis, muscular dystrophies Complex or Susceptibility Gene Gene confers an increased risk, but does not directly cause disorder No clear inheritance pattern Involves many genes or genes and environment Common in population –cancer, heart disease, dementia

10
Defining what to study As in any biomedical study, need to precisely define the disease under study Define primary phenotype and secondary phenotypes Validity and Reliability Understanding risk factors –Genetic or Environmental? Ethnic differences Age/gender distribution Use epidemiologic information to refine the phenotype definition Consider comparability to other studies

11
Refining the phenotype-genes Idea: Make the effect of certain genes in the sample more easily detectable Genetic effects may be stronger for extremes of the risk factor distribution –restrict sample to people with onset at a very young or very old age Genetic effects may be stronger for unusual presentations –restrict sample to individuals with coronary artery disease (CAD) without lipid abnormalities –restrict sample to diabetics with nephropathy
 without lipid abnormalities –restrict sample to diabetics with nephropathy")
12
Refining the phenotype- environment Minimize effect of known environmental confounders –restrict sample to nonsmokers –restrict sample to unmedicated people, e.g. in hypertension studies Collect data in a genetically homogenous population such as a particular ethnic group or genetically isolated population –Reduce the number of genes contributing to the phenotype

13
But, How do You Know Your Trait is Genetic?

14
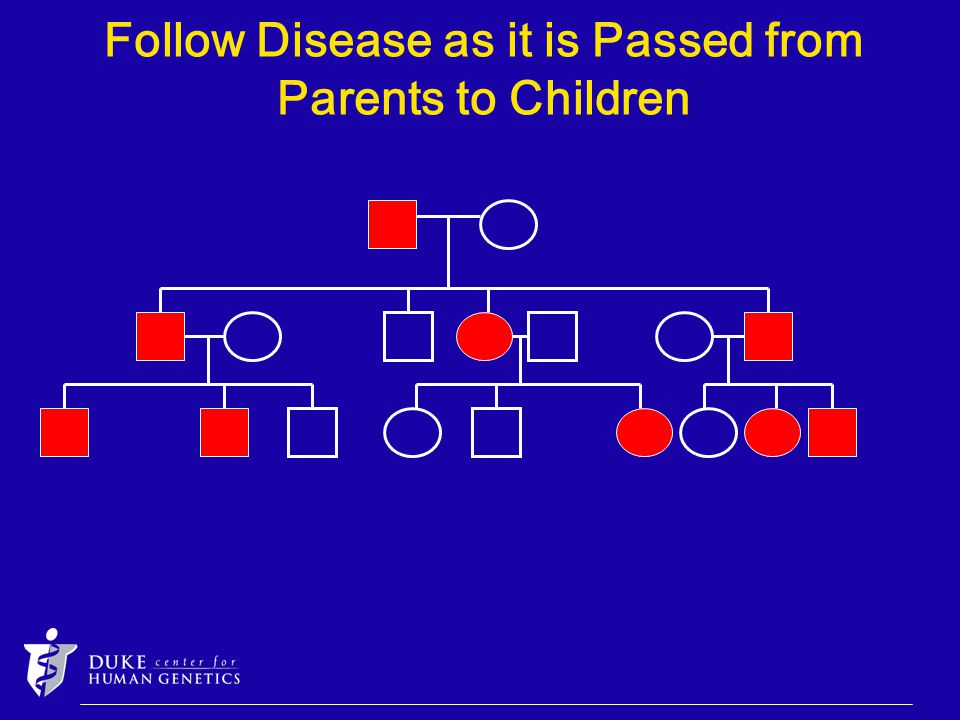
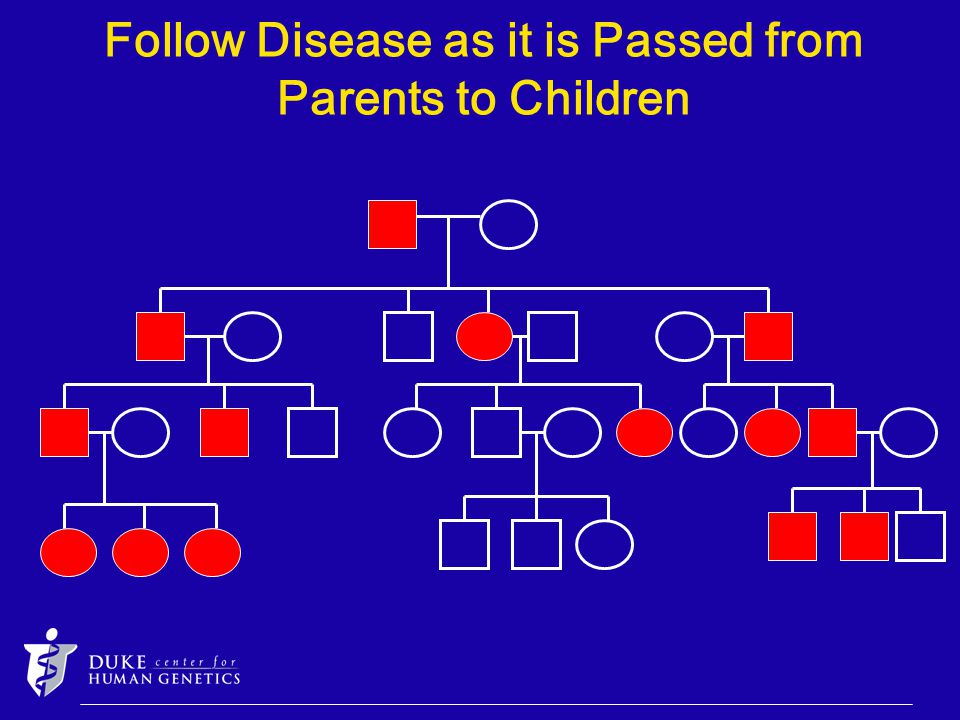
Familial aggregation Familial aggregation is the clustering of affected individuals within families. Documenting the familial aggregation is often the first step in characterizing the genetic basis for a trait. Major questions to ask yourself: Is there heterogeneity? Is it possible that there is a Mendelian subset of families? Oftentimes, Mendelian subsets of complex disease are characterized by early age of onset or increased severity. Familial aggregation is the clustering of affected individuals within families. Documenting the familial aggregation is often the first step in characterizing the genetic basis for a trait. Major questions to ask yourself: Is there heterogeneity? Is it possible that there is a Mendelian subset of families? Oftentimes, Mendelian subsets of complex disease are characterized by early age of onset or increased severity.

15
Follow Disease as it is Passed from Parents to Children

20
Twin Studies Purpose: Estimate the genetic component of a disease or associated phenotype Usually assume that twins share a common environment which lessens the impact of environmental influences (although this may not be true for studies of adult twins) Usually compare twins of same sex (especially useful if there are known differences in disease frequency in males and females) Twins are same age so age-dependency is not a problem Purpose: Estimate the genetic component of a disease or associated phenotype Usually assume that twins share a common environment which lessens the impact of environmental influences (although this may not be true for studies of adult twins) Usually compare twins of same sex (especially useful if there are known differences in disease frequency in males and females) Twins are same age so age-dependency is not a problem
 Usually compare twins of same sex (especially useful if there are known differences in disease frequency in males and females) Twins are same age so age-dependency is not a problem Purpose: Estimate the genetic component of a disease or associated phenotype Usually assume that twins share a common environment which lessens the impact of environmental influences (although this may not be true for studies of adult twins) Usually compare twins of same sex (especially useful if there are known differences in disease frequency in males and females) Twins are same age so age-dependency is not a problem")
21
MZDZ Type of Disease 90%90% Probably Environmental 100%25% Mendelian recessive, deviation from the expected frequencies may be due to incomplete penetrance 80%16% ? ? ? 72%35% 7%7% May be the same as population frequency Twin Studies One twin is affected, how often is the other? Review article: Martin et al. A twin-pronged attack on complex traits Nature Genetics 17: 387-392 (1997). Review article: Martin et al. A twin-pronged attack on complex traits Nature Genetics 17: 387-392 (1997).
. Review article: Martin et al. A twin-pronged attack on complex traits Nature Genetics 17: (1997)..")
22
Comparison of disease frequency in adoptees with their biological vs. their adopted parents (or siblings). Given the adoptee is affected, what percent of parents have the disease? BiologicAdoptiveType of disease Suggests strong genetic 85%5% component, frequency in adoptive parents mayreflect risk in the general population Suggests strong environmental 5%85% component, frequency in biologic parent may reflect risk in general population Comparison of disease frequency in adoptees with their biological vs. their adopted parents (or siblings). Given the adoptee is affected, what percent of parents have the disease? BiologicAdoptiveType of disease Suggests strong genetic 85%5% component, frequency in adoptive parents mayreflect risk in the general population Suggests strong environmental 5%85% component, frequency in biologic parent may reflect risk in general population Twin Studies: Adoption
. Given the adoptee is affected, what percent of parents have the disease. BiologicAdoptiveType of disease Suggests strong genetic 85%5% component, frequency in adoptive parents mayreflect risk in the general population Suggests strong environmental 5%85% component, frequency in biologic parent may reflect risk in general population Comparison of disease frequency in adoptees with their biological vs. their adopted parents (or siblings). Given the adoptee is affected, what percent of parents have the disease. BiologicAdoptiveType of disease Suggests strong genetic 85%5% component, frequency in adoptive parents mayreflect risk in the general population Suggests strong environmental 5%85% component, frequency in biologic parent may reflect risk in general population Twin Studies: Adoption.")
23
Segregation Analysis Test the disease distribution in families for concordance with specific genetic transmission models Very difficult studies to perform –Families need to be collected in a very precise way Works best for single gene disorders Not terribly successful for common diseases

24
A measure of how genetic a trait or disease is: What is the rate of affection for relative of proband with the disease vs. the frequency of the disease in the general population? Risch N. Am J Hum Genet (1990): 46 pp. 222 - 253. Recurrence Risk to Relatives: I I = recurrence rate in relative of proband rate in general population where I indicates the degree of relationship
: 46 pp Recurrence Risk to Relatives: I I = recurrence rate in relative of proband rate in general population where I indicates the degree of relationship.")
25
Values > 1.0 are generally taken to indicate evidence in favor of a genetic component. In general, the higher the value, the stronger the genetic component. Values can be used to estimate the number of genes under different genetic models. Note that the magnitude of the estimate is very dependent on the frequency in the population. For example, a common disorder may have frequency estimates of 3-6% depending on how a given study was performed but this results in small. Values > 1.0 are generally taken to indicate evidence in favor of a genetic component. In general, the higher the value, the stronger the genetic component. Values can be used to estimate the number of genes under different genetic models. Note that the magnitude of the estimate is very dependent on the frequency in the population. For example, a common disorder may have frequency estimates of 3-6% depending on how a given study was performed but this results in small. Recurrence Risk to Relatives: s

26
Disease: Alzheimer4-5 Neural tube defects25-50 Obesity1.8 Autism100-150 Cystic fibrosis1000 Disease: Alzheimer4-5 Neural tube defects25-50 Obesity1.8 Autism100-150 Cystic fibrosis1000 Recurrence Risk to Relatives: s s :

27
Best Proof of All? Connect genetic variation to the disease!

28
But, How Do We Find the Gene?

29
Locating a Variation 30,000 Genes on 46 chromosomes

30
Locating a Variation Region carrying the variation Gene 1 Gene 3 Gene 4 Gene 5 Gene 2 Gene 6

31
Locating a Variation Variation found in gene

33
The process of recombination in meiosis creates a relationship between two genes that is a function of the distance between them.

34
Genetic Markers In order to use recombination need to have genetic markers throughout the genome Know where the markers are in the genome –Human Genome Project tells us precisely where the markers are Unchanged from generation to generation Follow transmission from parents to offspring Be able to distinguish alleles –Polymorphic- having more than one state (alleles) –Can follow markers and alleles from one generation to the next
 –Can follow markers and alleles from one generation to the next")
35
Observe Disease and Markers of Genes Passed Together from Parents to Children Aaaa

36
Aa aa Aa Observe Disease and Markers of Genes Passed Together from Parents to Children

37
Aa aa AaaaAa aa Aaaa Aa aa Aa Observe Disease and Markers of Genes Passed Together from Parents to Children

38
aa Aa aaAaaaAa aa Aa aa Aa aa Observe Disease and Markers of Genes Passed Together from Parents to Children

39
Aaaa

40
Aa aa Observe Disease and Markers of Genes Passed Together from Parents to Children

41
Aa aa Observe Disease and Markers of Genes Passed Together from Parents to Children

42
aa Aa aa Aa Observe Disease and Markers of Genes Passed Together from Parents to Children

43
The phenomenon of the co- transmission of disease and marker alleles within a given family is called LINKAGE. No recombination is taking place between the disease and marker suggesting that they are close together on the same chromosome.

44
Suppose that we see linkage and we can follow transmission of marker alleles from parents to offspring. Suppose that in comparing many families, all diseased people in all families get the A allele. Now we have ASSOCIATION too.

45
Alleles A and B at two loci are associated if the event that a gamete carries A is not independent of the event that the gamete carries allele B. Alleles are not associated if they occur together in the same gamete randomly. Association is population-specific. ABAB ABAB ABAB abab abab abab ABAB Allelic Association ABAB AbAb AbAb abab aBaB abab ABAB

46
We can test for genetic association in families or in unrelated people. Many genetic association studies are performed as case control studies. Information is gained when we can combine evidence for genetic linkage with evidence for genetic association.

47
How do we apply these ideas?

48
Coronary Artery Disease Major cause of death and disability throughout the world 12 million Americans have coronary artery disease –7 million with myocardial infarctions –6.2 million with angina pectoris Well-defined risk factors: smoking, high cholesterol, physical inactivity, overweight, family history

49
What is the evidence that CAD is genetic? Family history is a strong risk factor.

50
Evidence for Genes in CAD Familial aggregation –The clustering of affected individuals in families Twin studies –If one twin is affected, the other twin is affected more often than by chance –A monozygous (identical) twin has higher risk than a dizygous twin (Marenberg et al. 1994) –Relative risk to co-twins is increased at young age –In old twins, rates are similar in MZ and DZ twins
 –Relative risk to co-twins is increased at young age –In old twins, rates are similar in MZ and DZ twins.")
51
Estimation of relative risk ( for CAD Shea at al (1984): relative risk to sibs 2-3.9 –Controlled for known risk factors –Risk to relatives higher in low risk factor group –Suggests risk due to family history may be independent of other known risk factors, especially at young ages Risanen (1989) risk increased in first degree relatives –Risk to brothers <55 was 6.7, sisters <55 2.8
: relative risk to sibs –Controlled for known risk factors –Risk to relatives higher in low risk factor group –Suggests risk due to family history may be independent of other known risk factors, especially at young ages Risanen (1989) risk increased in first degree relatives –Risk to brothers <55 was 6.7, sisters <55 2.8")
52
Characteristics of Familial CAD Many family members affected, especially female relatives Early onset <55 in men; <65 in women Multi-vessel disease Multiple risk factors Refractory to conventional therapy Family history of related conditions (i.e., stroke, diabetes, hypertension, cholesterol abnormalities)
")
53
Complex or Multifactorial Inheritance DISEASE Smoking Exercise Diet Age Family History

54
CAD is a multi-factorial condition

55
Genetics and Age of Onset

56
The GENECARD Study Goal: Identify genes predisposing to early onset CAD Use genome screen approach with a very large sample size (950 families) to map genes for early-onset CAD Ascertain siblings with CAD verified by medical record review Age of onset is the key feature –Males < 50 at diagnosis –Females < 55 at diagnosis
 to map genes for early-onset CAD Ascertain siblings with CAD verified by medical record review Age of onset is the key feature –Males < 50 at diagnosis –Females < 55 at diagnosis")
57
GENECARD Criteria Inclusion Criteria –Men who have had coronary atherosclerotic heart disease diagnosed at or before age 50, and women with a diagnosis at or before age 55, using any of the following criteria Angina or myocardial ischemia Cardiac catheterization indicating a blockage in at least one vessel of 50% or greater An acute myocardial infarction diagnosed by enzymes or electrocardiogram Unstable angina Coronary Artery Bypass Graft (CABG) Percutaneous Transluminal Coronary Angioplasty (PTCA)
 Percutaneous Transluminal Coronary Angioplasty (PTCA)")
58
GENECARD Exclusion Criteria –Substance abuse in the absence of diagnosed coronary stenosis –Congenital heart disease –History of chest irradiation –End stage renal disease –Myocarditis as a primary etiology of chest pain

59
GENECARD: Study Requirements Family history-at least 2 siblings with early CAD Blood sample Medical history with medical record confirmation Measurement of hips and waist Risk factor interview Measurement of blood pressure

60
Linkage Analysis Assume the affected people in the same family have the disease because of the same gene. Idea: If the gene causing the disease in this family is close to a genetic marker (linked), then we should see less recombination than we would expect under the hypothesis of no linkage. Genotype markers across the genome. Look for markers that are shared more often by family members with CAD.
, then we should see less recombination than we would expect under the hypothesis of no linkage. Genotype markers across the genome. Look for markers that are shared more often by family members with CAD..")
61
Several Intervals Are Linked to CAD Chromosome 1 ~ 22 Hauser ER. Et al., AJHG, 2004 Sep;75(3):436-47 6
:")
62
GENECARD: Chromosome 3

63
CAD can have different clinical characteristics in different people. What if we divide our families into subsets based on presence or absence of additional conditions: Acute Coronary Syndrome, Diabetes, Metabolic Syndrome.

64
GENECARD: Chromosome 1

65
Different facets of the disease may have different genetic contributions. It is often useful to consider disease subtypes or other clinical covariates to develop more genetically similar sets of families.

66
CATHGEN: CAD Association Study Identify cases and controls from the Duke Coronary Catheterization Lab –Cases have significant atherosclerosis –Controls have minimal atherosclerosis Genotype markers in regions of linkage Look for alleles that appear more often in cases and controls

67
Preliminary Candidate Gene Association Study in CATHGEN

68
Conclusions Gene identification studies of complex disease are fun, exciting and challenging. These studies require input from individuals with different expertise: Clinicians, Epidemiologists Molecular Biologists, Bioinformaticians, Statisticians, Geneticists. The Human Genome Project has accelerated our understanding of genetic architecture. Genes for complex disease will be discovered at a fast rate. Next steps are studies that identify the gene function as it relates to disease.

69
GENECARD Collaborators DUCCS Network William Kraus Christopher Granger Elaine Dowdy Susan Estabrooks Liling Huang Stephanie Decker Teresa Peace Jerome Anderson Sherry Jameson Alan Bartel Cathy Garvey Paul Campbell Janet Patterson Brian Crenshaw Teresa Schrader Charlie Dennis Kim DeRosa James Heinsimer Nancy Howald International Network David Crossman Sheila Francis Karen Eggleston Jonathan Haines Douglas Vaughn Brendan McAdam William Hillegas Paula Clevenger Chris Jones Kath Roche Vincent Mooser Vincent Jomini Nicolas Redondi Bernhard Winkelmann Glaxo-Smith-Kline Julia Perry Sanjay Sharma Scott Sundseth Lefkos Middleton Allen Roses Vincent Mooser Duke CHG Elizabeth Hauser Margaret Pericak- Vance Jeffery Vance Michael Hauser Silke Schmidt Margaret Jamison Sandra West Donny Asper Kruti Desai Jason Flor Jason Gibson Adam MacLaurin George Ward George Willis Carol Haynes Colette Blach Rodney Jones Lin Hu William Herzog Tania Geshoff Micheal Hindman Jennifer Kane Mike Rotman Virginia Remeny Kent Salisbury Dianne Oskins Charise Patten Alan Wiseman Mary Duquette Brent Muhlestein Chloe Maycock Sandra Reyna Richard Goulah Gina Kavanaugh Sebastian Palmeri Casey Casazza Fred McNeer Susan Marple Jeff Michel Steve Royal Brian Hilbourn

Similar presentations