Download presentation
Presentation is loading. Please wait.

1
Energy Efficiency Programs August 23, 2010 Presented by: John Rees, PE, CEM Eric Soderberg, PE, CEM Dr. Herb Eckerlin, PE Kevin Martin, MBA Presentation to 406 Class

2
Energy_Group@ncsu.edu Herbert M. Eckerlin, PhD, PE Professor, Director Phone: 919.515.5227 E-mail: eckerlin@eos.ncsu.edu Kevin Martin, MBA Strategic Energy Manager Phone: 919.515.0903 Cell: 919.996.9978 E-mail: kevin_martin@ncsu.edu John D. Rees, PE, CEM Energy Extension Specialist Phone: 919.515.9436 E-mail: john_rees@ncsu.edu Eric W. Soderberg, PE, CEM Energy Extension Specialist Phone: 919.795.1114 E-mail: eric_soderberg@ncsu.edu Stephen D. Terry, PhD, PE Extension Assistant Professor Phone: 919.515.1878 E-mail: sdterry@ncsu.edu Energy Program Technical Staff

3
MAE Energy Programs Assessment Process Energy Systems Analyzed Survey Procedures and Results Comments and Questions

4
Industrial Assessment Center (IAC) Energy Management Program (EMP)
 Energy Management Program (EMP)")
5
Funded Federally by US Department of Energy (DOE) Serving Manufacturers Energy bills typically from $100k to $3 million Will serve larger as well Service Territory North Carolina Southern Virginia Northern South Carolina
 Serving Manufacturers Energy bills typically from $100k to $3 million Will serve larger as well Service Territory North Carolina Southern Virginia Northern South Carolina")
6
Funded by NC State Appropriation Reports to NC Energy Office Businesses Served Manufacturers Commercial Governmental Institutional No size restrictions Service Territory State of North Carolina

7
Save Energy Reduce Waste Improve Productivity Train next generation of Energy Engineers Energy Program Objectives

9
Assessment Process

10
; Preliminary Information & Consultation Onsite Preliminary Energy Diagnostic Survey (PEDS) Identification of areas for Potential Savings Targeted System Survey Survey of Existing Equipment Measurement & Data Gathering Interview O&M personnel Identification of opportunities Savings and Cost Analysis Report Client Review of Report
 Identification of areas for Potential Savings Targeted System Survey Survey of Existing Equipment Measurement & Data Gathering Interview O&M personnel Identification of opportunities Savings and Cost Analysis Report Client Review of Report")
11
Assessment Process ; Data Analysis & Reporting ROI, simple payback, life cycle costing Cost to benefit analysis, NPV, IRR Full report delivered Implementation Follow-up & Additional Assistance Follow-up calls and assistance Continued assistance as needed

12
The purpose of a Preliminary Energy Diagnostics Survey (PEDS) is to evaluate plant operations from an energy perspective, to identify and prioritize energy saving opportunities, and to recommend targeted energy surveys for equipment that offer the greatest potential for energy savings. Purpose of a Preliminary Energy Diagnostics Survey

13
Boilers Lighting Compressed Air HVAC Systems Chillers and Cooling Towers Motors & Pumps Preventative Maintenance Steam Systems & Steam Traps Process energy systems Systems targeted during a Preliminary Energy Diagnostics Survey

14
Typical Information gathered in a Preliminary Energy Study Air Compressors and Air Dryers There are 3 air compressors. There is one common air dryer. Compressors: Manufacturer:Ingersoll-Rand Model:SSRXFE200-25 Serial: FF1274U97151 Type:Rotary screw Horsepower:200 hp Rating:1,100 cfm Operation:116 – 125 psig

15
Chillers There is one water cooled chiller: Manufacturer:Carrier Model:30HXC106R--661KA Serial:2307Q07525 Service:Cooling water for molds Operation:Setpoint is 48° F

16
Electrical Use and Cost for an Industrial Facility – Data collected for a Preliminary Energy Study

17
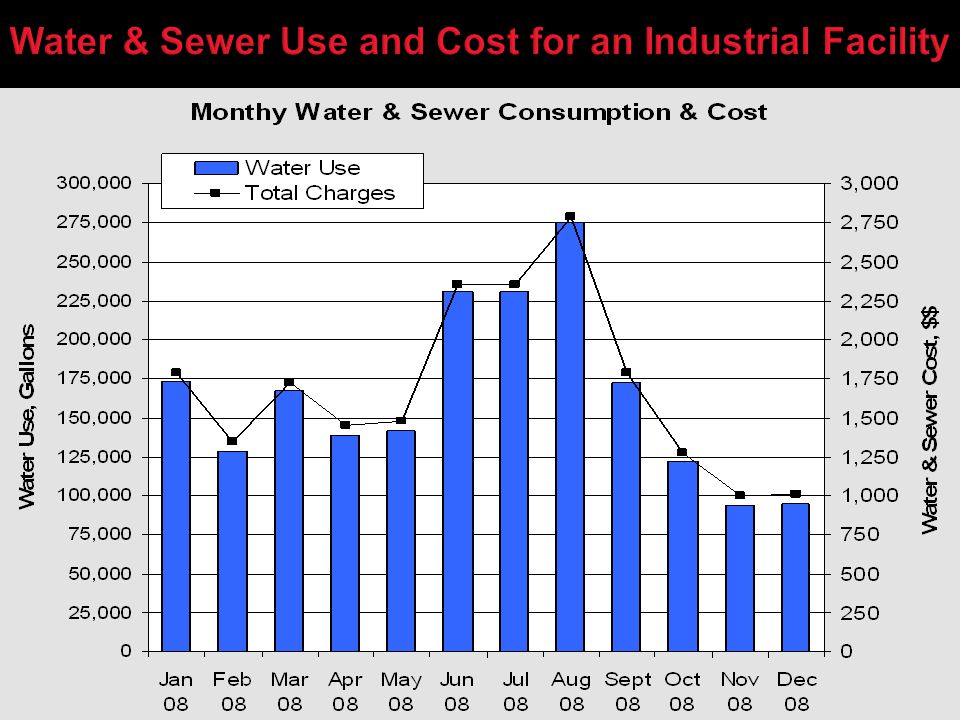
Water & Sewer Use and Cost for an Industrial Facility Data collected for a Preliminary Energy Study

19
Summary of Recommendations: The NCSU Energy Management Program (EMP) recommends the following: Compressed Air Study Convert T12 task lighting to T8. Explore the possibility of replacing the 8 ft. T12 fixtures with single fixtures containing two 4 ft. T8 lamps. Consider a Chiller and Cooling Tower Study. Consider a Motor Study

20
Lighting Surveys

23
Information Collected during a Lighting Survey Fixture quantities by type Fixture Wattage Lighting level in Footcandles Maintenance issues Electrical Rates

24
Table 1. Savings and Payback for Recommendations 1 & 2 Table 2. Savings and Payback with Utility Incentives Savings and Cost Summary from a Lighting Report

25
Compressed Air Surveys

26
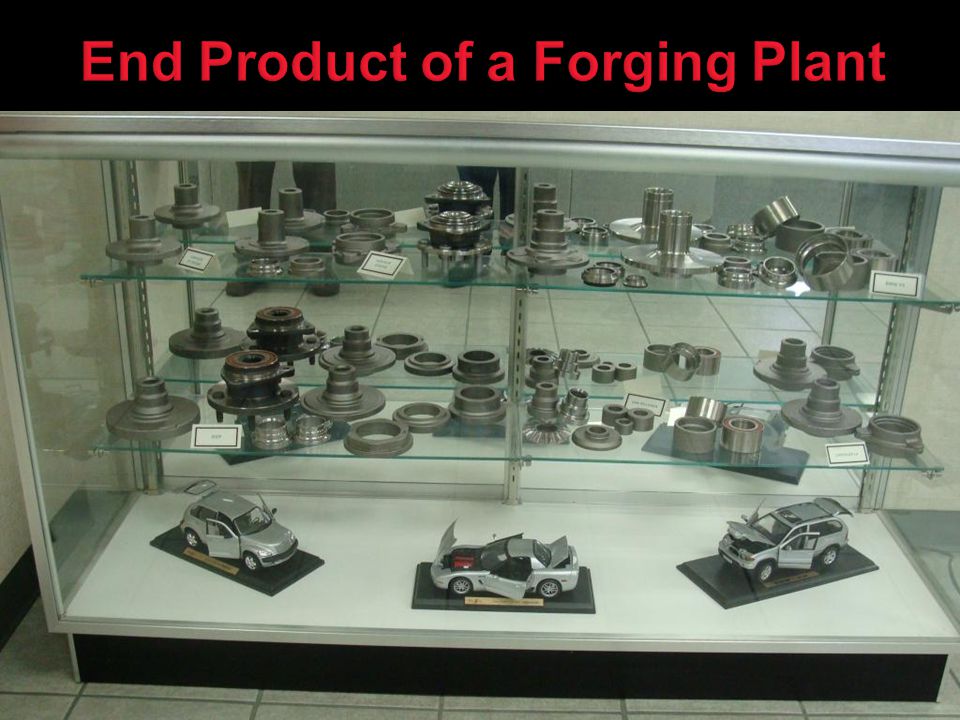
Industrial Air Compressors

29
Typical Savings from a Compressed Air Survey

30
Load Monitoring and Recommendations from a Compressed Air Study

31
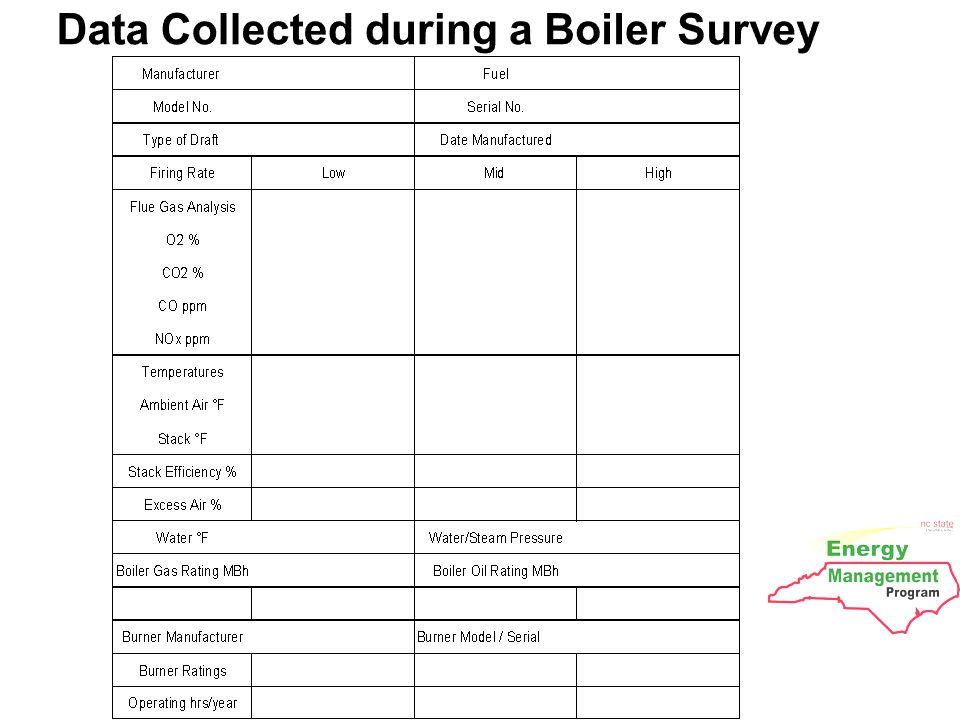
Boiler Surveys Flue Gas Analysis O 2, CO, CO 2 Stack Efficiency Operating/Maintenance Issues Dirty Heat Exchange surfaces Scanner failure Temperature control

32
Hot Water Boilers in a School

33
Industrial Low Pressure Steam Boilers

38
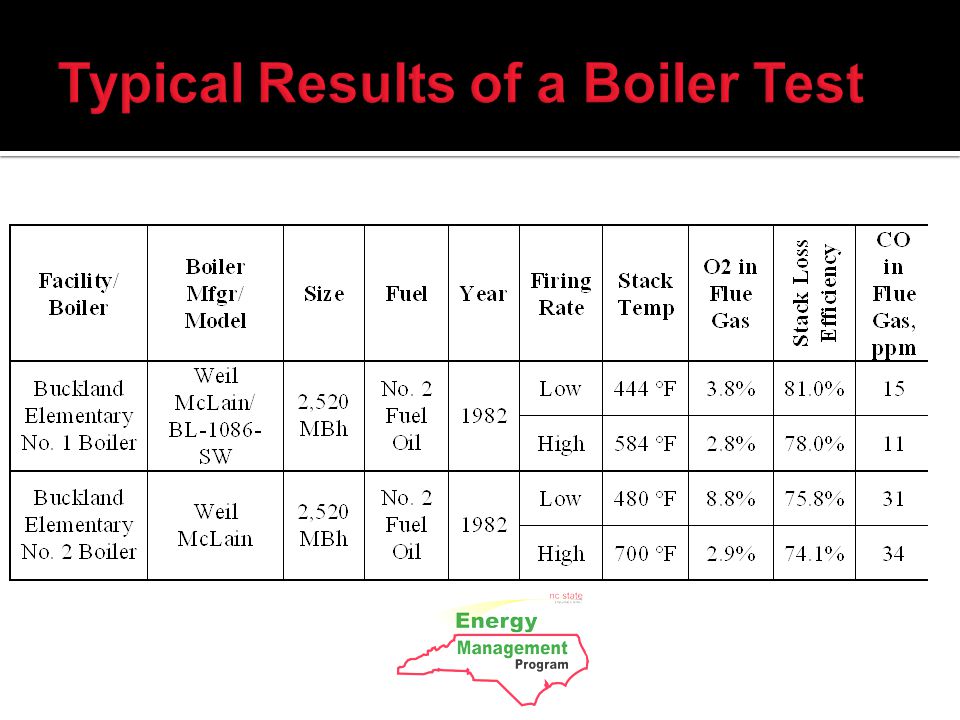
At your next boiler tuneup, discuss the relatively high excess air level on Boiler No. 2 at low fire to determine if the air/fuel ratio can be leaner at low fire. Boiler No. 1 currently operates more efficiently at low fire than Boiler No. 2 (this may be corrected after burner tune-ups have been performed). Consequently, Boiler No. 1 should be operated when low fire operation is required. Tune boilers to operate most efficiently at the firing level where they operate most frequently. Install stack thermometers in the stack to monitor flue gas temeperature. Use portable flue gas analyzer to measure O2 in flue gas every 6 months (at typical operating loads). Install gas meters on the individual boilers and track individual boiler fuel usage on a monthly basis. Consider reducing steam pressure. Lower pressure in 5 psi increments and allow boiler to operate at the reduced level for several days to determine if the system operates acceptably. Consider installing economizers to heat boiler feedwater.
. Consequently, Boiler No. 1 should be operated when low fire operation is required. Tune boilers to operate most efficiently at the firing level where they operate most frequently. Install stack thermometers in the stack to monitor flue gas temeperature. Use portable flue gas analyzer to measure O2 in flue gas every 6 months (at typical operating loads). Install gas meters on the individual boilers and track individual boiler fuel usage on a monthly basis. Consider reducing steam pressure. Lower pressure in 5 psi increments and allow boiler to operate at the reduced level for several days to determine if the system operates acceptably. Consider installing economizers to heat boiler feedwater..")
39
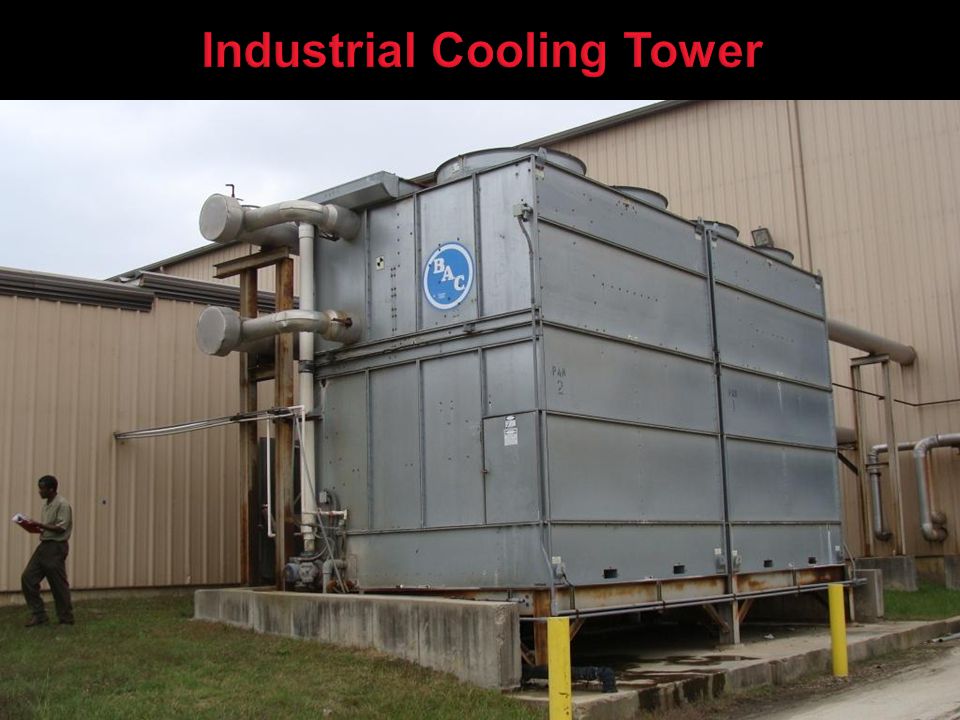
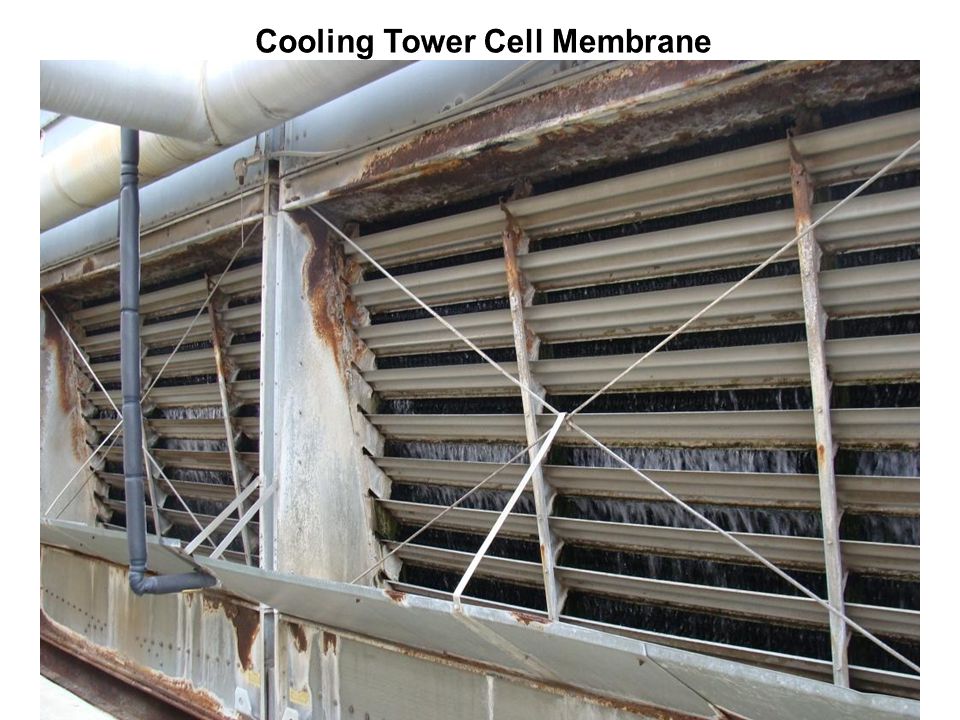
HVAC, Chiller, and Cooling Tower Surveys Systems Encountered: Small Commercial Large Commercial Small Industrial Large Industrial

47
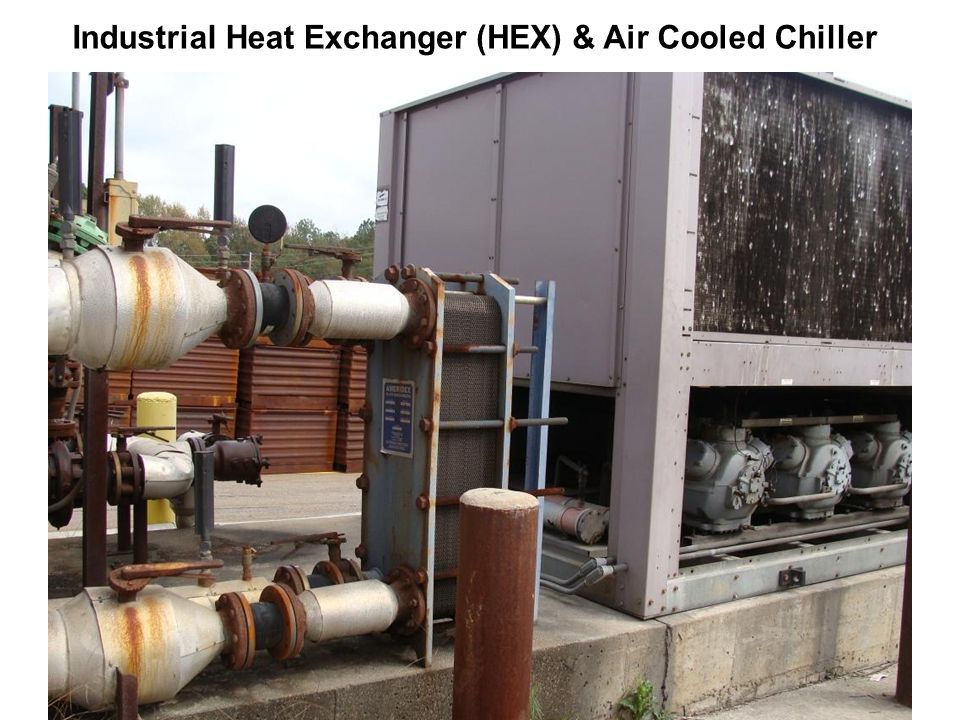
Previously shown Air Cooled Chiller viewed from Above

49
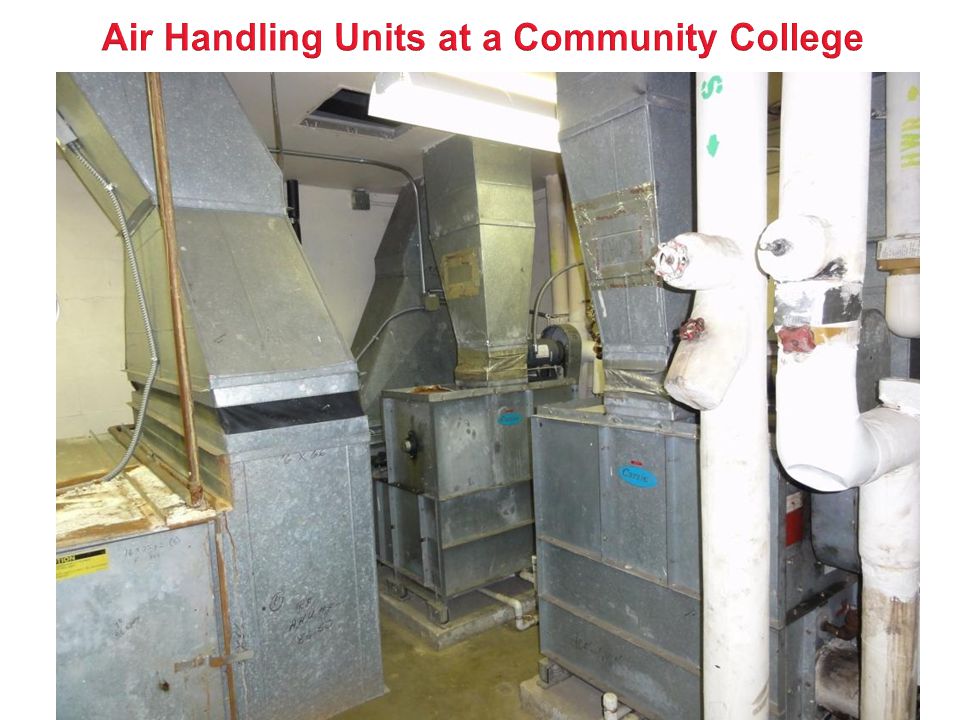
Industrial Air Handling System

59
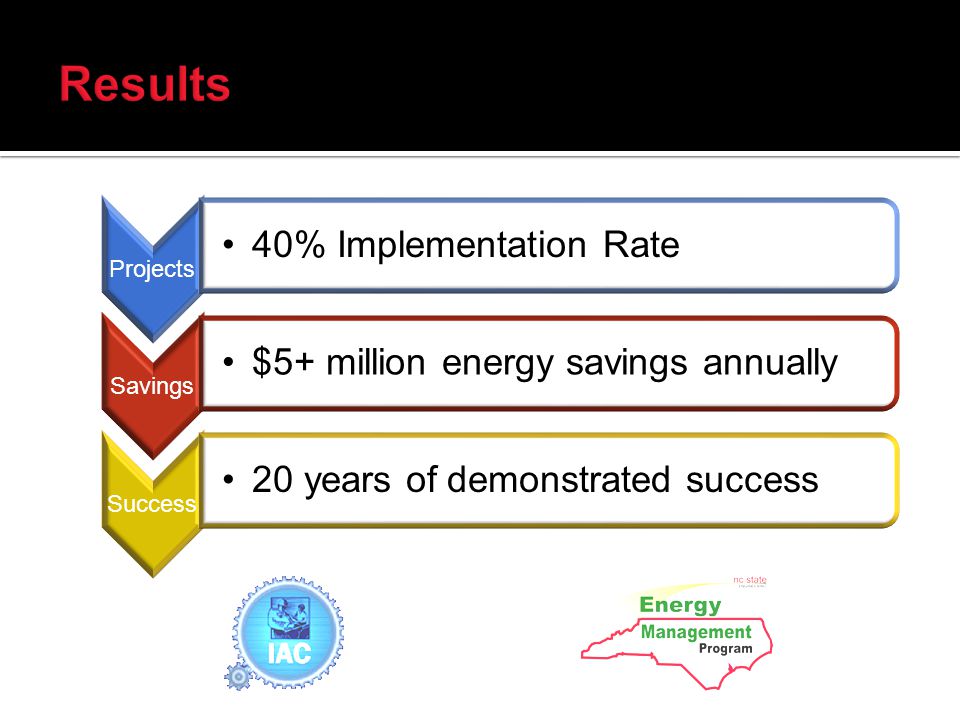
2005 IAC Assessment $250,000 annual savings $560,000 implementation cost, 2.3 year payback Recession activity Company grew market share due to greater efficiency Company expanded into new world markets as others retracted Some recommendations applied corporately Additional $920,000 worldwide savings Local plant expanded New product line added New line and 50 new jobs without incentive

60
Campus Greenhouses Detailed lighting survey $112k implementation cost $38k leveraged incentives $17k annual energy savings 4.4 year simple payback Maintenance savings further shorten payback Boiler tuning Boiler was short cycling Helping NC Bottom Line Currently working with: School districts Community Colleges Military facilities Cities Counties Towns

61
Saving Energy Comprehensive and targeted surveys Demand Side Management (DSM) Energy bill analysis Reducing Waste and Pollution Landfill and water issues Carbon footprint calculation
 Energy bill analysis Reducing Waste and Pollution Landfill and water issues Carbon footprint calculation")
62
Additional Technical Assistance Strategic Energy Planning Assistance with proposals Measurement & Verification Improving Productivity Process and systems review Additional resources (IES)
")
Similar presentations


 January 20, 2012 Presenter: BPU President Robert Hanna.>")


