Download presentation
Presentation is loading. Please wait.

3
We can construct a linear demand function by using the common-sense notion that if the price p of a good rises, the demand for that good in the market will drop, and thus the quantity q of the good that is purchased will also drop.

4
To put it another way, as the price of a good rises, the quantity that is demanded of that good will fall. Conversely, if the price of a good falls, the demand for that good will rise.

5
We can capture this idea of demand falling as price rises in a graph.

6
We can capture this idea of demand falling as price rises in a graph. We put the price on the horizontal axis and the quantity demanded on the vertical axis:

7
The graph of the demand function will always have a negative slope, since demand falls as prices rise:

8
The graph of the demand function will always have a negative slope, since demand falls as prices rise:

9
The graph of the demand function will always have a negative slope, since demand falls as prices rise:

10
The slope of the demand equation is the change in q over the change in p.

11
The slope of the demand equation is the change in q over the change in p.

12
The slope of the demand equation is the change in q over the change in p.

13
Often you will be asked to find a demand equation given the demand at two different price levels.

14
Often you will be asked to find a demand equation given the demand at two different price levels. For example, suppose a store is able to sell 40 mugs in a week if the price is $3.50 per mug, but is only able to sell 30 per week if the price is $4 per mug.

15
Often you will be asked to find a demand equation given the demand at two different price levels. For example, suppose a store is able to sell 40 mugs in a week if the price is $3.50 per mug, but is only able to sell 30 per week if the price is $4 per mug. This gives us two price/quantity ordered pairs, in the form (p, q ). The pairs are (3.50, 40) and (4, 30)
. The pairs are (3.50, 40) and (4, 30).")
16
We need to find the demand equation, which always has the form q=mp+b. We must find both m and b using our two points.

17
We need to find the demand equation, which always has the form q=mp+b. We must find both m and b using our two points. We find m as follows:

18
We need to find the demand equation, which always has the form q=mp+b. We must find both m and b using our two points. We find m as follows:

19
We need to find the demand equation, which always has the form q=mp+b. We must find both m and b using our two points. We find m as follows:

20
We need to find the demand equation, which always has the form q=mp+b. We must find both m and b using our two points. We find m as follows:

21
We need to find the demand equation, which always has the form q=mp+b. We must find both m and b using our two points. We find m as follows:

22
Now that we have m, we can find b using either of the price/quantity points we were given. So far we have.

23
Now that we have m, we can find b using either of the price/quantity points we were given. So far we have. Using (4, 30), we can substitute 4 for p and 30 for q, and then solve for b.
, we can substitute 4 for p and 30 for q, and then solve for b..")
24
Now that we have m, we can find b using either of the price/quantity points we were given. So far we have. Using (4, 30), we can substitute 4 for p and 30 for q, and then solve for b.
, we can substitute 4 for p and 30 for q, and then solve for b..")
25
Now that we have m, we can find b using either of the price/quantity points we were given. So far we have. Using (4, 30), we can substitute 4 for p and 30 for q, and then solve for b.
, we can substitute 4 for p and 30 for q, and then solve for b..")
26
Now that we have m, we can find b using either of the price/quantity points we were given. So far we have. Using (4, 30), we can substitute 4 for p and 30 for q, and then solve for b.
, we can substitute 4 for p and 30 for q, and then solve for b..")
27
Now that we have m, we can find b using either of the price/quantity points we were given. So far we have. Using (4, 30), we can substitute 4 for p and 30 for q, and then solve for b. Thus, our demand function is
, we can substitute 4 for p and 30 for q, and then solve for b. Thus, our demand function is.")
28
We can interpret the value of b =110 to mean that if the price drops to zero, the quantity of mugs demanded will be 110.

29
We can write the slope m =-20 as

30
We can interpret the value of b =110 to mean that if the price drops to zero, the quantity of mugs demanded will be 110. We can write the slope m =-20 as Recall that in this case, the slope is

31
We can interpret the value of b =110 to mean that if the price drops to zero, the quantity of mugs demanded will be 110. We can write the slope m =-20 as Recall that in this case, the slope is Thus, the slope can be interpreted to mean that if the price p increases by $1, then the quantity q of mugs demanded will decrease by 20.

33
We now view prices and quantities sold from the point of view of the supplier.

34
From the suppliers point of view, higher prices means more money from sales. If the price of an item rises, the supplier is willing to supply more of that item.

35
We now view prices and quantities sold from the point of view of the supplier. From the suppliers point of view, higher prices means more money from sales. If the price of an item rises, the supplier is willing to supply more of that item. Thus, on a supply curve, we expect that higher prices will lead to a higher quantity of items supplied, and so the supply function has a positive slope.

36
Notice that both the supply and the demand functions have the same form,

37
The easiest way to tell a supply function from a demand function is to check the sign of the slope. A supply function always has a positive slope, and a demand function always has a negative slope.

38
Notice that both the supply and the demand functions have the same form, The easiest way to tell a supply function from a demand function is to check the sign of the slope. A supply function always has a positive slope, and a demand function always has a negative slope. We can find a supply function in the same way we found a demand function – we will usually be given two price/quantity pairs, and we use them to find both m and b.

40
There is a seeming disconnect between buyers and sellers of any particular item.

41
The buyers will buy more of an item if the price is lower, but the sellers may not be willing to supply very many of the item if they cant make money on the sales.

42
There is a seeming disconnect between buyers and sellers of any particular item. The buyers will buy more of an item if the price is lower, but the sellers may not be willing to supply very many of the item if they cant make money on the sales. If the price is higher, the sellers will be willing to supply more of the item since they can make more money, but if they raise the price, the buyers wont want to buy as many of the item.

43
Fortunately, there is a particular price/quantity combination that will (theoretically) make both buyers and sellers happy.
 make both buyers and sellers happy.")
44
By happy, we mean that all of an item that is supplied by the suppliers will be purchased by buyers, so that there will be none left over (surplus), and no buyer will be unable to purchase the item because a supplier didnt supply enough of it (shortage).
, and no buyer will be unable to purchase the item because a supplier didnt supply enough of it (shortage).")
45
This price/quantity combination is called the equilibrium point. The p – coordinate of the this point is the equilibrium price and the q – coordinate is the equilibrium quantity.

46
Graphically, the equilibrium point is the point where a supply function for a particular item intersects the corresponding demand function for the item.

47
This price/quantity combination is called the equilibrium point. The p – coordinate of the this point is the equilibrium price and the q – coordinate is the equilibrium quantity. Graphically, the equilibrium point is the point where a supply function for a particular item intersects the corresponding demand function for the item. You can find the equilibrium point by setting the supply function equal to the demand function, and solving for p.

48
Graphically, the point of equilibrium looks like this:

54
As an example, suppose a college newspaper has a demand function of

55
Suppose the same newspaper has a supply function of

56
As an example, suppose a college newspaper has a demand function of Suppose the same newspaper has a supply function of Note that the price p is measured in dollars.

57
The q-intercept of 8000 on the demand function means that if the newspaper is given away free of charge (if p = 0), then 8000 papers would be demanded.
, then 8000 papers would be demanded.")
58
The q-intercept of 800 on the supply function means that if the newspaper is given away free of charge, then the university (the supplier) is willing to supply 800 papers.
 is willing to supply 800 papers.")
59
To find the equilibrium price, we set the supply function equal to the demand function and solve for p.

63
Thus, the equilibrium price for the newspaper is $0.40 (or 40 cents).
.")
64
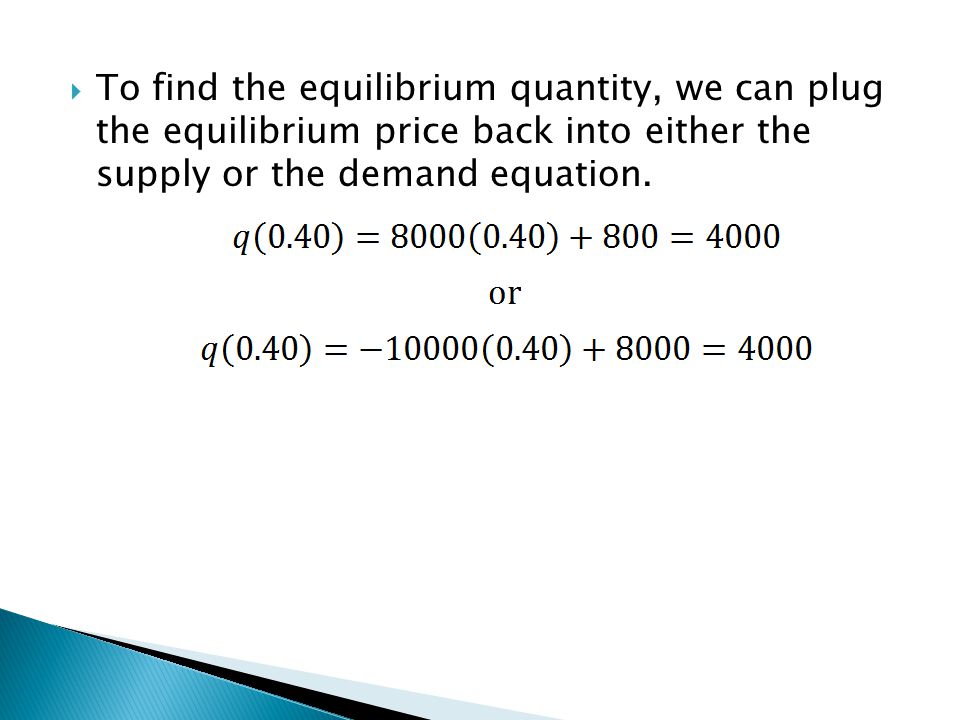
To find the equilibrium quantity, we can plug the equilibrium price back into either the supply or the demand equation.

67
Either way, we get the equilibrium quantity of 4,000 newspapers.

68
This means that if the college charges $0.40 per newspaper and supplies 4,000 newspapers, there will be neither a surplus nor a shortage of newspapers.

69
Notice that if they supply 4,000 newspapers and charge more than $0.40, there will be some newspapers left unsold since not as many people will want to pay a higher price.

70
This means that if the college charges $0.40 per newspaper and supplies 4,000 newspapers, there will be neither a surplus nor a shortage of newspapers. Notice that if they supply 4,000 newspapers and charge more than $0.40, there will be some newspapers left unsold since not as many people will want to pay a higher price. This would result in a surplus of newspapers since supply is greater than demand.

71
Conversely, if the college supplied 4,000 newspapers and charged less than $0.40, there would be some people who want to buy a newspaper but would not be able to, since more people would want to buy them at the lower price than would be supplied by the college.

72
This would result in a shortage of newspapers since demand is greater than supply.

73
For more information on supply and demand, see the PDF file linked on p. 61 of the e- book. It contains some example problems with detailed solutions.

Similar presentations