Download presentation
Presentation is loading. Please wait.

1
Structure and Impact of Rising Food Prices in India Empirical Review and Qualitative Assessment Abusaleh Shariff National Council of Applied Economic Research, New Delhi Presented in an international workshop on Indian Agriculture: Improving Competition Markets and the Efficiency of Supply Chains jointly organized by Australian Centre for International Agriculture Research, and NCAER, New Delhi, 16 February, 2011 Presentation is based on a draft paper – Food Security in the Context of Food Price Rise in India: An empirical review, by Abusaleh Shariff and Ganga Shreedhar, January 2011

2
Global Food Price Increase 2008-9 | Domestic Food Inflation 2009-10 Structure of Food stress and implication for markets & Food Security? Product specific price movements in recent months /years Income and price dynamics of food consumption (demand) Food Consumption behavior & differentials Understanding Coping mechanisms Safety Net Policies and Efficiency 2Shariff's PPT Motivation for this Study
 Food Consumption behavior & differentials Understanding Coping mechanisms Safety Net Policies and Efficiency 2Shariff s PPT Motivation for this Study.")
3
Quantitative and Qualitative Methods (1) Monthly Price movements May 2006- June 2009 25 food and fuel items | 78 towns/cities (2) Nationally representative sample survey of households, human development survey, NCAER-2004-5|N=40,000 rural- urban Price, income & substitution effects - rice, wheat and milk (3) Qualitative rapid surveys and focus group interviews Coping mechanisms - UP, MP, Karnataka and Delhi-NCT. (4) Review safety net/social protection policies – PMT Score method - improve targeting efficiency
 Review safety net/social protection policies – PMT Score method - improve targeting efficiency.")
4
Food Price Surge: 2007-08 Focus on the poor and vulnerable Rural and Urban differentials Diversity in Coping behavior Efficacy of programs mitigating food crisis Improving food security of the poor

5
International Cereal Price Links International Rice and Wheat Price surge - from mid-2007 to mid-2009 Prices in India did not rise Rather Indian price rise dramatically only from mid- 2009 and continued into 2010, when actually international food prices crashed!

6
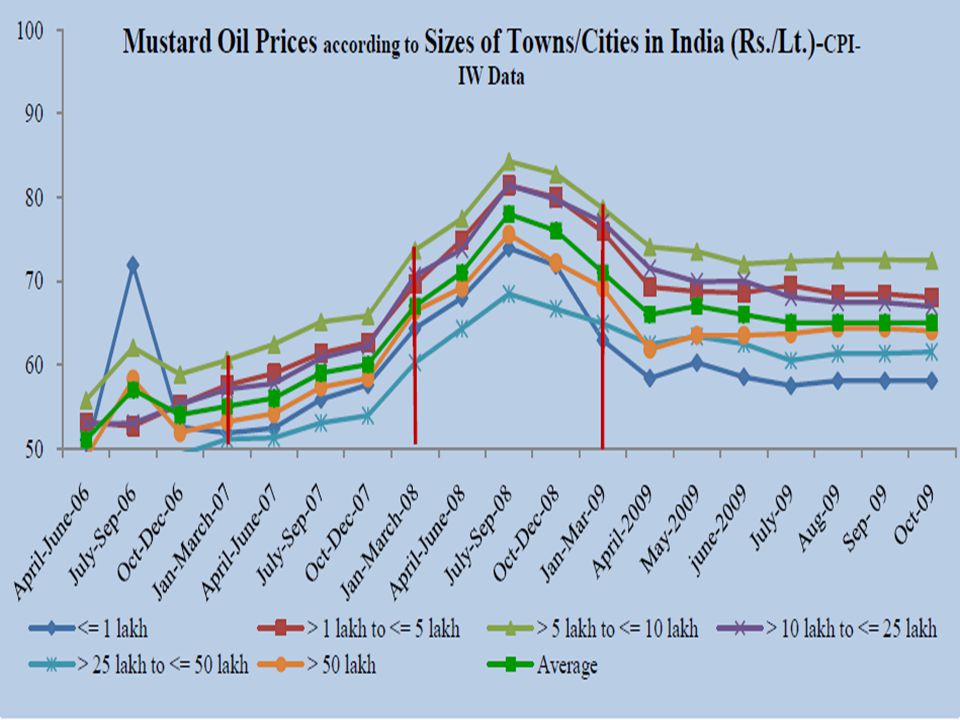
Market Size and Price Movements Specific Food Items 78 Towns / Cities Size Class< 1 lakh 1-5 lakh 5-10 lakh 10-25 lakh 25-50 lakh 50 + lakhs Note: Town/city class size cutoffs are chosen so as to ensure that a reasonable percentage of total population is covered in each of the category. 25 Food Items Monthly Price Movements Wheat, Rice (common variety), Wheat Flour Atta (processed) Milk, Pulses, Vegetables – Onion etc, Cooking Oil Fish, Meats, Chicken, Eggs Kerosene
, Wheat Flour Atta (processed) Milk, Pulses, Vegetables – Onion etc, Cooking Oil Fish, Meats, Chicken, Eggs Kerosene.")
8
Commentary

12
Monthly Cereal consumption Shares and Quantities Cereal/ Sector India RuralUrbanAll Share of selected cereal consumption (%ge) Rice56.152.355.3 Wheat36.541.837.9 Other Cereal10.95.79.3 Monthly Household Consumption (Kgs./Reporting HHs) Rice37.824.533.9 Wheat30.622.828.1 Other Cereal17.48.815 Mean for all HHs All Cereals 63.545.758.3 Source: Calculated by the author using HD- Survey (2004-05). Commentary

13
Monthly Per Capita Consumption by Income Quintile Kgs/Liters Quintile Select Items Rice Rural Rice Urban Wheat Rural Wheat Urban Milk RuralMilk Urban Vegetables Rural Vegetables urban Lowest7.14.76.45.32.93.23.73.5 Q27.34.96.25.13.34.03.83.7 Q37.35.06.14.9 4.15.14.24.4 Q47.05.06.35.0 5.46.24.24.8 Highest6.55.36.45.0 6.98.14.55.4 Total7.15.06.35.04.45.24.04.2 Commentary

14
Household Quantity Consumed a day before interview, selected States

15
Rice consumption is relatively more sensitive to price rise Possibly due to substitution to cheaper cereals which is mostly wheat Home Grown Rice help sustain consumption upto 30% Home Grown Wheat help sustain consumption upto 13% Home produced Milk help sustain consumption upto 50% Multivariate Analysis Suggests Results

16
Source: Calculated by authors using IHD-Survey (2004-05). Sources of Household Grain Consumption Comments

17
Sources of Household Rice and Wheat

18
Short Term Coping Mechanisms Reported by Households (%) State Reduced food intake Breakdown of social network Increased debt Child withdrawn from School Child Sent for meager wage Sold livestock Sold utility assets Migrated out All Rural 8366452311251318 UP 7048493520411945 MP 9580681135138 Karnataka 8068926123361 All Urban 93762925115146 UP 915031 2042113 MP 100834519122107 Karnataka 938313216870 Delhi 9186392893196 Comments
 State Reduced food intake Breakdown of social network Increased debt Child withdrawn from School Child Sent for meager wage Sold livestock Sold utility assets Migrated out All Rural UP MP Karnataka All Urban UP MP Karnataka Delhi Comments")
19
Typology of Low Food Stress Sustain quantity at the cost of quality PDS present and generally accessible Marginal dependence on general market Income and consumption smoothening possible No takers for NREGA, even women Can deal with idiosyncratic shocks except health crisis

20
Moderate Food Stress RURAL Face food shortages, inadequate home production, Irregular and limited PDS but high dependence, Depends on market to bridge consumption needs Low income and consumption smoothening Migration both seasonal and long term Conditional (higher wage) demand for NREGA Difficulty in dealing with idiosyncratic shocks and health crisis URBAN Face food shortages, no home production Irregular and limited PDS but high dependence Depends on market to bridge consumption needs Low income and consumption smoothening Some are recent-migrants Difficulty in dealing with idiosyncratic shocks and health crisis
 demand for NREGA Difficulty in dealing with idiosyncratic shocks and health crisis URBAN Face food shortages, no home production Irregular and limited PDS but high dependence Depends on market to bridge consumption needs Low income and consumption smoothening Some are recent-migrants Difficulty in dealing with idiosyncratic shocks and health crisis")
21
High Food Stress RURAL Young earners migrate leaving old and vulnerable in village Low productivity agriculture and lack of irrigation Poorly developed non-farm employment Lack of awareness about NREGA Nonexistent wage-empl. opportunity in and around village URBAN Unstable families in urban fringe, uprooted from rural parts Manual labor, beedi rolling, cycle rickshaw etc Poor employment and low wages, and lower occupational diversity No home produced food, No or low PDS access Total dependence on general market Low capacity for income and consumption smoothening Cannot deal with idiosyncratic shocks, High incidence of sickness

22
SAFETY NETS Public Distribution System Exclusion and Inclusion Errors

23
Recent period has seen increased public spending on safety nets & food subsidy for food security….. Central Government Safety Net Outlays Source: (Ministry of Finance, Various years) (Central Statistical Organization, Ministry of Statistics and Program Implementation, 2010) Central Government Food Subsidy Bill Comments
 (Central Statistical Organization, Ministry of Statistics and Program Implementation, 2010) Central Government Food Subsidy Bill Comments.")
24
MG-NREGS allocation is about 0.7% of GDP Nearly as much as the food subsidy bill MG-NREGS, Rural Wage Employment 2008One time schemed in response to the spate of famers suicides perceived to be driven largely by the inability to repay debts. Total expenditure 2008/09 was Rs 150 billion (about $US 3.3 billion) Agri. Debt Waiver and Relief
 Agri. Debt Waiver and Relief.")
25
PDS Card Ownership by Income Quintile

26
Exclusion and Inclusion Errors in PDS BPLAPLNo Card Rural India42.143.214.8 Urban India22.256.621.2 Poverty Estimates by Standard Measure Rural India Poor (25.9) 52.232.715.1 Non-Poor (74.1) 39.146.214.7 Urban India Poor (22.8) 36.346.117.6 Non-Poor (77.2) 19.059.022.0 Deprived Estimated using PMT Score Method Rural India Deprived (35.3)55.428.616.0 Better Off (64.7)34.751.214.1 Urban India Deprived (39.1)33.744.322.0 Better Off (60.9)17.062.220.8
 Non-Poor (74.1) Urban India Poor (22.8) Non-Poor (77.2) Deprived Estimated using PMT Score Method Rural India Deprived (35.3) Better Off (64.7) Urban India Deprived (39.1) Better Off (60.9)")
27
The Overlap- Poor Versus Deprived Deprived (PMT)Better Off (PMT) Rural India 35.364.7 Poor (std. method) 25.9 41.8 17.2 Non-Poor (std. method) 74.1 58.2 82.8 Urban India 39.160.9 Poor (std. method) 22.8 46.2 7.7 Non-Poor (std. method) 77.2 53.8 92.3
 Non-Poor (std. method) Urban India Poor (std. method) Non-Poor (std. method)")
28
Add on Threat Leading to Malnutrition: Incidence of Diarrhea among the Under-5 year Old Children Income class India RuralUrbanTotal All10.26.99.4 Quintiles Lowest10.38.19.8 212.16.610.9 311.06.39.8 48.36.47.8 Highest5.95.65.8

29
Thank you

30
Wheat - Prices lower in smaller towns price rises at town size increase Wheat Flour – price highest in smaller towns lower in large cities Even a small processing value added and marketing increases the price considerably and add on transportation make prohibitive in rural areas Centralized processing of Cereals must be discouraged back

31
High consumption in Rural - 64 kgs Urban - 46 kgs Share of Rice is higher more so in Rural area Wheat relatively an Urban Cereal Cereal Consumption back

32
Marginal differences between income class - both Rice and Wheat | Rural and Urban Extremely large differences between income class - Milk and Vegetables and other value added Not surprising ! Per Capita Cereal Consumption by Income Class back

33
Multivariate Impact Variable WheatRiceMilk Dependent Variable Log of PCM Wheat con. (Kg.)Log of PCM Rice con. (Kg.)Log of PCM Milk con. (litre) Independent VariableCoef.P>tCoef.P>tCoef.P>t _cons 2.780.0002.810.0001.740.000 Price Effect Log of Wheat Prices (Rs/Kg.)Log of Rice Prices (Rs/Kg.)Log of Milk Prices (Rs/litre) -0.390.000-0.540.000-0.160.000 Source of Cereal PDS Wheat 0.020.012 na Home Grown Wheat 0.130.000 na Home Grown Other than Wheat -0.140.000 na PDS Rice na 0.060.000 na Home Grown Rice na 0.300.000 na Home Grown Other than Rice na -0.300.000 na Milk Production at Home na 0.480.000 Home Grown Cereals na 0.030.038 Number of obs. 32139 38805 31028 Prob > F 0.000 R-squared 0.70 0.72 0.39 Adj R-squared 0.69 0.72 0.39 Root MSE 0.54 0.60 0.74
Log of PCM Rice con. (Kg.)Log of PCM Milk con. (litre) Independent VariableCoef.P>tCoef.P>tCoef.P>t _cons Price Effect Log of Wheat Prices (Rs/Kg.)Log of Rice Prices (Rs/Kg.)Log of Milk Prices (Rs/litre) Source of Cereal PDS Wheat na Home Grown Wheat na Home Grown Other than Wheat na PDS Rice na na Home Grown Rice na na Home Grown Other than Rice na na Milk Production at Home na Home Grown Cereals na Number of obs Prob > F R-squared Adj R-squared Root MSE")
34
Urban Cereals 85 - 90% Market dependence Rural Cereals 50% Market, 35% Self, 10-15& PDS Marginal Difference by income class Middle income HHs use more PDS! Market Dominates back

35
80 - 90% reduce consumption 70-80% face breakdown of social networks: Inflation impact households uniformly; and make them cautious High Indebtedness 50% in rural areas About a quarter HHs withdraw children from school And another 10% resort to child labor Sale of livestock, and household assets also reported Rural households migrate out in search of income (18%) Multiple Coping Mechanisms back
 Multiple Coping Mechanisms back")
36
Food subsidy bill represents the basic direct cost incurred by the center from procurement, stocking and supplying to various food based safety nets such as PDS Food Subsidy Outlays: 0.6% of the GDP in 2006/07 0.8% of the GDP in 2008/09 and 2009/10 Rs. 400 billion - partly cost of rising MSPs and procurement and no corresponding increases in the issue price of grain for safety nets like PDS Food Subsidy Outlays back

Similar presentations


, 04/22/2010 release. Estimates of detailed employment and wage data for the states.>")


 patients Policy.>")

