Download presentation
Presentation is loading. Please wait.

1
Research on Nutritional Contributors to Obesity Neal D. Barnard, M.D. Physicians Committee for Responsible Medicine 5100 Wisconsin Avenue NW, Suite 400 Washington, DC 20016

2
Obesity in the U.S. and Japan BMI 30 Yoshiike N. Obes Rev 2002;3:183-90. Flegal KM. Int J Obesity 1998;22:39-47. United States Japan % 1960 1971- 1976- 1988- 1999- 1974 1980 1994 2000

3
Obesity in the U.S. and Japan BMI 30 Yoshiike N. Obes Rev 2002;3:183-90. Flegal KM. Int J Obesity 1998;22:39-47. United States Japan % 1960 1971- 1976- 1988- 1999- 1974 1980 1994 2000

4
Overweight in U.S. and Japan Yoshiike N. Obes Rev 2002;3:183-90. Flegal KM. Int J Obesity 1998;22:39-47. BMI 25–29.9 kg/m 2 U.S. Japan % % % %

5
Overweight and Obesity in Japan Yoshiike N. Obes Rev 2002;3:183-90. Yoshiike N. Asia Pac J Clin Nutr 2002;11(Suppl 8):S727-31. BMI 25-29.9 BMI 30 % % % % % % Prevalence in Men
:S BMI BMI 30 % % % % % % Prevalence in Men.")
6
Falling Carbohydrate Intake in Japan Murata M. Am J Clin Nutr 2000;72(suppl):1379S-83S. 1955 1965 1975 1985 1994

7
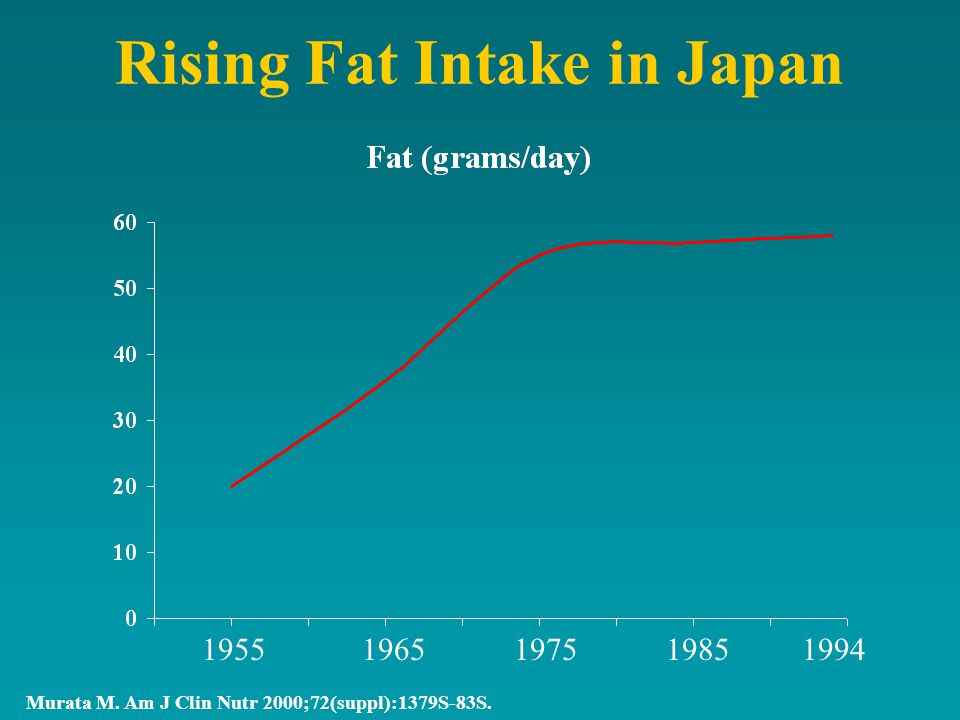
Rising Fat Intake in Japan Murata M. Am J Clin Nutr 2000;72(suppl):1379S-83S. 1955 1965 1975 1985 1994
8
Dietary Patterns and Obesity Asia Grain-Centered Diet Obesity Is Rare U.S., Prior to 1980 Meat-Centered Diet Obesity Is Common U.S. After 1980 Meat-Centered Diet + Extra Calories Obesity Is an Epidemic

9
Differential Roles for Carbohydrate Asia Carbohydrate-rich foods are staples: Rice Starchy vegetables Noodles U.S. Carbohydrate-rich foods are vehicles for dietary fat: Toast and butter Potatoes and gravy Spaghetti and meat Pizza and cheese

10
A Randomized, Controlled Study of the Effect of a Low-Fat, Vegan Diet on Body Weight and Metabolism in Postmenopausal Women Neal D. Barnard, M.D., Anthony R. Scialli, M.D., Gabrielle Turner-McGrievy, M.S., R.D., Amy J. Lanou, Ph.D., Jolie Glass, M.S. Funded by the Cancer Project of the Physicians Committee for Responsible Medicine

11
Methods 59 overweight (BMI 26-44 kg/m 2 ) postmenopausal women59 overweight (BMI 26-44 kg/m 2 ) postmenopausal women Randomly assigned to a low-fat vegan or control dietRandomly assigned to a low-fat vegan or control diet Exercise levels held constantExercise levels held constant Data collected at baseline and 14 weeksData collected at baseline and 14 weeks
 postmenopausal women59 overweight (BMI kg/m 2 ) postmenopausal women Randomly assigned to a low-fat vegan or control dietRandomly assigned to a low-fat vegan or control diet Exercise levels held constantExercise levels held constant Data collected at baseline and 14 weeksData collected at baseline and 14 weeks")
12
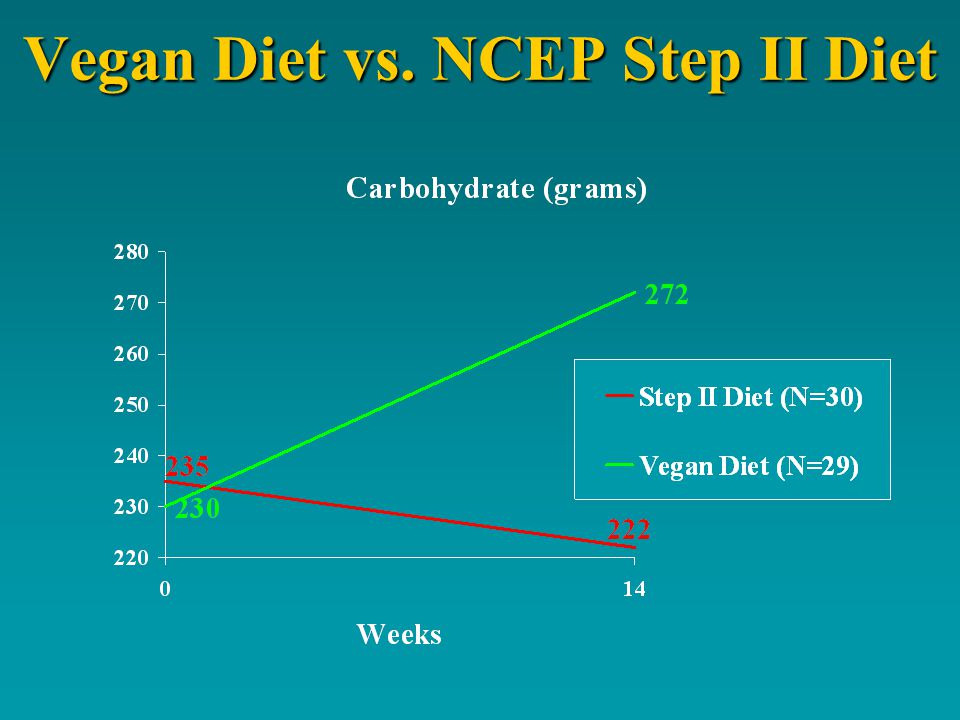
Diets Low-Fat, Vegan Diet Grains, vegetables, legumes, and fruitsGrains, vegetables, legumes, and fruits No limit on energy intake or portion sizesNo limit on energy intake or portion sizes Excluded animal products, oils, high-fat plant foodsExcluded animal products, oils, high-fat plant foods ~10% of energy from fat, 15% from protein, and 75% from carbohydrates~10% of energy from fat, 15% from protein, and 75% from carbohydrates Control Diet NCEP Step II guidelinesNCEP Step II guidelines No limit on energy intakeNo limit on energy intake Meat intake < 6 ounces/day and fat grams < 60 per dayMeat intake < 6 ounces/day and fat grams < 60 per day Total fat limited to 30% of energyTotal fat limited to 30% of energy ~15% of energy from protein and > 55% from carbohydrates~15% of energy from protein and > 55% from carbohydrates

13
Nutrient Intake * P = 0.05 ** P < 0.05 For comparison of low-fat vegan versus control diet changes (baseline to 14 weeks).
.")
14
Fiber Reduces Calorie Intake Every 14 grams of fiber in the daily diet reduces energy intake by approximately 10%.

15
Vegan Diet vs. NCEP Step II Diet

18
Changes in Body Composition and Metabolism ** P < 0.05 For comparison of low-fat vegan versus control diet changes (baseline to 14 weeks).
.")
19
Insulin Sensitivity We found an average 24% increase in insulin sensitivity in the vegan group, with no significant change in this variable in the Step II group. Lanou A, Scialli AR, Turner-McGrievy G, Glass J. Unpublished Data. 2003.

20
Fat Content (Percentage of Calories from Fat) Leanest beef29% Skinless chicken breast23% Sea trout32% White tuna16% Broccoli8% Beans 4% Rice1–5% Potato1%
 Leanest beef29% Skinless chicken breast23% Sea trout32% White tuna16% Broccoli8% Beans 4% Rice1–5% Potato1%")
25
Casomorphins Opiates that form as casein (milk protein) is digested.
 is digested.")
26
Casomorphins From ß-casein: ß-casomorphin-7Try-Pro-Phe-Pro-Gly-Pro-Ile ß-casomorphin 5 (bovine)Tyr-Pro-Phe-Pro-Gly ß-casomorphin 5 (human)Tyr-Pro-Phe-Val-Glu MorphiceptinTyr-Pro-Phe-Pro-NH 2 From a s1 -casein: a-Casein exorphinArg-Gly-Phe-Gin-Asn-Ala Shah NP. Br J Nutr 2000;84(suppl 1):S3-S10. Teschemacher H. J Dairy Res 1986;53:135-8.
:S3-S10. Teschemacher H. J Dairy Res 1986;53:")
27
Super-Sizing, 1977–98 (U.S.) Nielsen SJ. JAMA 2003;289:450-3. Soft Fruit Ham- Cheese- Drinks Drinks burgers burgers

28
U.S. Cheese Intake Has Doubled

32
Wendys Cheddar Lovers Bacon Cheeseburger promotion sold: 2.25 million pounds of cheese 380 tons of fat 1.2 tons of pure cholesterol USDA Report to Congress on the Dairy Promotion Programs, 2000 The U.S. Government at Work

33
Wendys Cheddar Lovers Bacon Cheeseburger Subways Chicken Cordon Bleu, Honey Pepper Melt Pizza Huts Ultimate Cheese Pizza Burger King, Taco Bell USDA Report to Congress on the Dairy Promotion Programs, 2000 The U.S. Government at Work

34
Dick Cooper, Vice President of Cheese Marketing, Dairy Management, Inc., at the Cheese Forum, December 5, 2000. USDA Report to Congress on the Dairy Promotion Programs, 2000

36
BMI of Meat-Eaters and Vegetarians Appleby PN. Int J Obes 1998;22:454-60. Oxford Vegetarian Study (age-adjusted means) Male Meat-Eaters23.2 kg/m 2 Male Non-Meat-Eaters22.1 kg/m 2 Female Meat-Eaters22.3 kg/m 2 Female Non-Meat-Eaters21.3 kg/m 2 All participants were non-smokers. N = 2,445 meat-eaters, 2,287 non-meat-eaters
 Male Meat-Eaters23.2 kg/m 2 Male Non-Meat-Eaters22.1 kg/m 2 Female Meat-Eaters22.3 kg/m 2 Female Non-Meat-Eaters21.3 kg/m 2 All participants were non-smokers. N = 2,445 meat-eaters, 2,287 non-meat-eaters.")
37
Loma Linda Study Haddad. Am J Clin Nutr 1999;70(suppl):586S-93S. Mean Age (years)33.536.0 Mean BMI (kg/m 2 )25.520.5 Non-Vegetarians (20) Vegans (25) Bread (servings)10.911.7 Vegetables (servings)1.43.3 Fruit (servings)2.65.6 Legumes (1/2 cup servings)0.31.2 Nuts and seeds (ounces)0.20.9 Meat (ounces)6.30 Milk (cups)0.90 Diet Characteristics
 Mean BMI (kg/m 2 ) Non-Vegetarians (20) Vegans (25) Bread (servings) Vegetables (servings) Fruit (servings) Legumes (1/2 cup servings) Nuts and seeds (ounces) Meat (ounces)6.30 Milk (cups)0.90 Diet Characteristics.")
38
Loma Linda Study Haddad. Am J Clin Nutr 1999;70(suppl):586S-93S. Bread Vegetables Fruit Legumes Nuts & Meat Milk (servings) (servings) (servings) (1/2 cup Seeds (ounces) (ounces) servings) (ounces) Non-Vegetarians (20) Mean Age 33.5 years Mean BMI 25.5 kg/m 2 Vegans (25) Mean Age 36.0 Mean BMI 20.5 kg/m 2 = =
 (servings) (servings) (1/2 cup Seeds (ounces) (ounces) servings) (ounces) Non-Vegetarians (20) Mean Age 33.5 years Mean BMI 25.5 kg/m 2 Vegans (25) Mean Age 36.0 Mean BMI 20.5 kg/m 2 = =.")
39
Dangers of Low-Carbohydrate, High- Protein Diets

40
Low-Carbohydrate, High-Protein (Atkins) Diet Induction Phase =20 grams carbohydrate Excluded: Fruit Starchy vegetables Legumes Grains Milk Alcohol Caffeine Permitted: Meats Eggs Cheese (3-4 oz.) Nonstarchy vegetables Salad vegetables (3 cups maximum for all vegetables)
 Diet Induction Phase =20 grams carbohydrate Excluded: Fruit Starchy vegetables Legumes Grains Milk Alcohol Caffeine Permitted: Meats Eggs Cheese (3-4 oz.) Nonstarchy vegetables Salad vegetables (3 cups maximum for all vegetables)")
41
Low-Carbohydrate, High-Protein (Atkins) Diet Transition Phases (Ongoing Weight Loss, Pre-Maintenance) Slowly increase carbohydrates until weight loss stalls. Maintenance Phase Maintain carbohydrate restriction for life.

42
Nutrient Analysis of Atkins Sample Menus Nutrient intakes are based on Dr. Atkins New Diet Revolution (M. Evans & Co., 1999), using Nutritionist V., Version 2.0, for Windows 98 (First DataBank, Inc., Hearst Corporation, San Bruno, CA). AtkinsAtkins Induction Maintenance Energy, kcal17592173 Protein, g (% energy)143 (33%)135 (25%) Carbohydrate, g (% energy)15 (3%)116 (22%) Fat, g (% energy)125 (64%)110 (45%) Saturated fat, g4238 Cholesterol, mg886834 Fiber, g218
, using Nutritionist V., Version 2.0, for Windows 98 (First DataBank, Inc., Hearst Corporation, San Bruno, CA). AtkinsAtkins Induction Maintenance Energy, kcal Protein, g (% energy)143 (33%)135 (25%) Carbohydrate, g (% energy)15 (3%)116 (22%) Fat, g (% energy)125 (64%)110 (45%) Saturated fat, g4238 Cholesterol, mg Fiber, g218.")
43
Initial Weight Loss on Low-Carbohydrate Diets Water loss: 1 pound of glycogen holds 3 pounds of water

44
Fiber (grams) Atkins Diet nutrient intakes are based on Dr. Atkins New Diet Revolution (M. Evans & Co., 1999), using Nutritionist V., Version 2.0, for Windows 98 (First DataBank, Inc., Hearst Corporation, San Bruno, CA). Low-Fat Pyramid Atkins Atkins Vegan Induction Maintenance
, using Nutritionist V., Version 2.0, for Windows 98 (First DataBank, Inc., Hearst Corporation, San Bruno, CA). Low-Fat Pyramid Atkins Atkins Vegan Induction Maintenance.")
45
Saturated Fat (grams) Cholesterol (milligrams) = Low-Fat Vegan= Pyramid= Atkins Maintenance 4 24 38 0 235 834
 Cholesterol (milligrams) = Low-Fat Vegan= Pyramid= Atkins Maintenance")
46
Protein (grams) Atkins Diet nutrient intakes are based on Dr. Atkins New Diet Revolution (M. Evans & Co., 1999), using Nutritionist V., Version 2.0, for Windows 98 (First DataBank, Inc., Hearst Corporation, San Bruno, CA). Low-Fat Pyramid Atkins Atkins Vegan Induction Maintenance
, using Nutritionist V., Version 2.0, for Windows 98 (First DataBank, Inc., Hearst Corporation, San Bruno, CA). Low-Fat Pyramid Atkins Atkins Vegan Induction Maintenance.")
47
Effects on Cholesterol LCHP (Atkins) Diets Plus Exercise *Randomized controlled trials and crossover trials Bravata DM. JAMA 2003;289:1837-50. Stanford University review, 2003 94 intervention trials 60 g CHO/d: No effects on TC, LDL, HDL > 60 g CHO/d: All studies: TC 8.1 ± 1.4 mg/dl, no other effects Controlled* studies: no effect on lipids Most studies were confounded by exercise. Most studies did not isolate effects of weight changes on lipids.

48
LCHP Diets and Serum Cholesterol Serum Cholesterol Saturated Fat Dietary Cholesterol Serum Cholesterol Weight Loss

49
As Weight Falls, So Does Cholesterol Conversion forumla: Cholesterol in mg/dl x 0.02586 = mmol/L Dattilo AM, Kris-Etherton PM. Am J Clin Nutr 1992;56:320-8. Meta-analysis, Pennsylvania State University 1 lb weight TC 1 mg/dl(US units) LDL 0.4 mg/dl 1 kg weightTC 0.05 mmol/L(SI units) LDL 0.02 mmol/L The higher the initial cholesterol level, the greater the cholesterol drop during weight loss.
 LDL 0.4 mg/dl 1 kg weightTC 0.05 mmol/L(SI units) LDL 0.02 mmol/L The higher the initial cholesterol level, the greater the cholesterol drop during weight loss..")
50
Protein and Loss of Kidney Function Harvard Nurses Health Study: Among women with mild renal insufficiency (GFR 55 to < 80 mL/min per 1.73 m 2 ) followed for 11 years: Every 10 g non-dairy animal protein 1.21 mL/min per 1.73 m 2 drop in GFR Atkins Maintenance Diet suggested menu: 135 g protein per day GFR = Glomerular filtration rate Knight EL Ann Intern Med 2003;138:460-7.
 followed for 11 years: Every 10 g non-dairy animal protein 1.21 mL/min per 1.73 m 2 drop in GFR Atkins Maintenance Diet suggested menu: 135 g protein per day GFR = Glomerular filtration rate Knight EL Ann Intern Med 2003;138:460-7.")
51
Prevalence of Decreased Kidney Function GFR = Glomerular filtration rate, mL/min per 1.73 m 2 Coresh J. Am J Kidney Dis 2003;41:1-12. Mild (GFR 60-89)Moderate (GFR 30-59) Total population31.2% (0.8)4.3% (0.2) 20-39 years13.7% (0.9)0.21% (0.07) 40-59 years42.4% (1.1)1.8% (0.3) 60-69 years53.8% (1.8)7.1% (0.9) 70+ years48.5% (1.1)24.6% (1.1)
Moderate (GFR 30-59) Total population31.2% (0.8)4.3% (0.2) years13.7% (0.9)0.21% (0.07) years42.4% (1.1)1.8% (0.3) years53.8% (1.8)7.1% (0.9) 70+ years48.5% (1.1)24.6% (1.1).")
52
Prevalence of Decreased Kidney Function GFR = Glomerular filtration rate, mL/min per 1.73 m 2 Coresh J. Am J Kidney Dis 2003;41:1-12. Mild (GFR 60-89)Moderate (GFR 30-59) Total population31.2% (0.8)4.3% (0.2) 20-39 years13.7% (0.9)0.21% (0.07) 40-59 years42.4% (1.1)1.8% (0.3) 60-69 years53.8% (1.8)7.1% (0.9) 70+ years48.5% (1.1)24.6% (1.1) With diabetes40.4% (1.9)14.2% (1.3)
Moderate (GFR 30-59) Total population31.2% (0.8)4.3% (0.2) years13.7% (0.9)0.21% (0.07) years42.4% (1.1)1.8% (0.3) years53.8% (1.8)7.1% (0.9) 70+ years48.5% (1.1)24.6% (1.1) With diabetes40.4% (1.9)14.2% (1.3).")
53
Prevalence of Decreased Kidney Function GFR = Glomerular filtration rate, mL/min per 1.73 m 2 Coresh J. Am J Kidney Dis 2003;41:1-12. Mild (GFR 60-89)Moderate (GFR 30-59) Total population31.2% (0.8)4.3% (0.2) 20-39 years13.7% (0.9)0.21% (0.07) 40-59 years42.4% (1.1)1.8% (0.3) 60-69 years53.8% (1.8)7.1% (0.9) 70+ years48.5% (1.1)24.6% (1.1) With diabetes40.4% (1.9)14.2% (1.3) Hypertension, no meds43.2% (1.5) 7.9% (0.7) Hypertension, on meds46.0% (1.9)17.5% (0.9)
Moderate (GFR 30-59) Total population31.2% (0.8)4.3% (0.2) years13.7% (0.9)0.21% (0.07) years42.4% (1.1)1.8% (0.3) years53.8% (1.8)7.1% (0.9) 70+ years48.5% (1.1)24.6% (1.1) With diabetes40.4% (1.9)14.2% (1.3) Hypertension, no meds43.2% (1.5) 7.9% (0.7) Hypertension, on meds46.0% (1.9)17.5% (0.9).")
54
Most studies of high-protein diets: Bravata DM. JAMA 2003;289:1837-50. Do not report effects on kidney function Do not track long-term effects

55
Calcium Losses Via Kidney (milligrams/day) Regular Diet Atkins Induction Atkins Maintenance Reddy ST. Am J Kidney Dis 2002;40:265-74.

56
Most studies of high-protein diets do not track: Bravata DM. JAMA 2003;289:1837-50. calcium losses bone density long-term fracture risk

57
Meat Eating and Colon Cancer 1. Giovannucci E. Cancer Research 1994;54:2390-7. 2. Willett WC. N Engl J Med 1990;323:1664-72. Risk of Colon Cancer from Eating Beef, Pork, or Lamb Rarely or Never 5/wk, Men 1 Daily, Women 2 1.0 3.6 2.5

58
Studies of high-protein diets have been too brief to assess colon cancer risk.

59
Fat and Alzheimers Disease Chicago Health and Aging Project 815 healthy individuals, = 65 years old 3.9 year follow-up Saturated fat:Highest quintile: Lowest quintile: 25.1 g/day 13.0 g/day Risk 2.2 (CI, 1.1-4.7) Rush-Presbyterian/St. Lukes Medical Center Morris MC. Arch Neurol 2003;60:194-200.

60
Fat and Alzheimers Disease Chicago Health and Aging Project 815 healthy individuals, = 65 years old 3.9 year follow-up Saturated fat:Highest quintile: Lowest quintile: 25.1 g/day 13.0 g/day Risk 2.2 (CI, 1.1-4.7) Trans fat:Highest quintile: Lowest quintile: 2.3-4.8 g/day 1.8 g/day Risk 1.8-2.9* n-6 fats:Highest quintile: Lowest quintile: 14.5 g/day 7.4 g/day Risk 0.3 (CI, 0.1-0.9) Rush-Presbyterian/St. Lukes Medical Center Morris MC. Arch Neurol 2003;60:194-200. *Significant for 2 nd and 3 rd quintiles only

61
Three Different Approaches Sugar Fruits Beans Grains Vegetables Dairy Eggs Meat Fats Sugar Fruits Beans Grains Vegetables Dairy Dairy Eggs Meat Fats Atkins Diet Vegan Diet Low-Calorie Diet

62
Weight Loss: 1 lb/week 1. Barnard ND, in press. 2. Wadden TA. Ann Int Med 1993;119:688-93. 3. Westman EC. Am J Med 2002;113:30-6. = Vegan diet, no exercise (14 weeks) 1 = 1200-calorie diet (21 weeks) 2 = Atkins Diet plus exercise, supplements (26 weeks) 3 Weeks Pounds Lost
 1 = 1200-calorie diet (21 weeks) 2 = Atkins Diet plus exercise, supplements (26 weeks) 3 Weeks Pounds Lost.")
63
Weight Loss per Week (pounds) 1. Westman EC. Am J Med 2002;113:30-6; 2. Wadden TA. Ann Int Med 1993;119:688- 93; 3. Barnard ND, in press. Vegan (14 weeks) 1 1200-calorie (21 weeks) 2 Atkins + exercise (26 weeks) 3
 calorie (21 weeks) 2 Atkins + exercise (26 weeks) 3.")
64
Long-Term Weight Loss 1. Westman EC. Am J Med 2002;113:30-6. 2. Ornish D. JAMA 1998;280:2001-7. = Vegetarian diet plus exercise 2 = Atkins Diet plus exercise, supplements 1

65
The Latest Industry Myth Dairy products promote weight loss. Evidence based solely on mouse studies or experiments using calorie-restricted diets. Randomized trials adding dairy products to normal diets either have no effect on weight or cause weight gain. Non-fat milk derives 55% of calories from sugar (lactose.) Typical cheeses derive approximately 70% of calories from fat, mostly saturated fat.
 Typical cheeses derive approximately 70% of calories from fat, mostly saturated fat..")
66
The New Four Food Groups Grains (rice, bread, pasta, corn, oatmeal, etc.) Legumes (beans, peas, lentils) Vegetables (carrots, broccoli, spinach, squash, etc.) Fruits (apples, bananas, pears, cherries, etc.)
 Legumes (beans, peas, lentils) Vegetables (carrots, broccoli, spinach, squash, etc.) Fruits (apples, bananas, pears, cherries, etc.)")
67
Physicians Committee for Responsible Medicine Neal D. Barnard, M.D. 5100 Wisconsin Avenue NW, Suite 400 Washington, DC 20016 202-686-2210 pcrm@pcrm.org

Similar presentations