Download presentation
Presentation is loading. Please wait.

1
Nelly Maell, Marton Bandoli

3
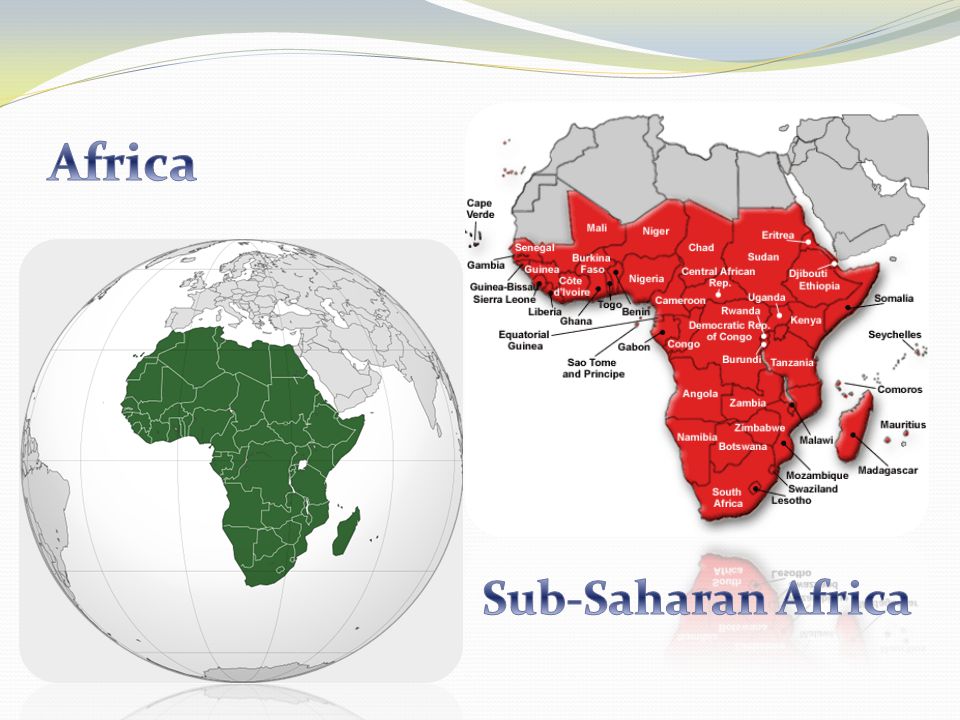
Introduction Development assistance and debt accumulation in Africa Data, trends and raw statistics Hypothesis, empirical analysis, major findings Conclusion

4
Aid and development aid business

5
First Aid is more effective when the recipient countrys policy and institutional environment satisfies some minimal criteria.Second Aid and debt relief have not been targeted particularly toward countries with adequate policies and institutions (Burnside and Dollar 2000)
")
6
Will the official program of debt reduction affect future donor behavior and they will loose their willingness to direct aid to its best uses or it will just invite the another round of business as usual?

7
$350 billion dollars Debt $350 billion dollars GDP for the region was negative over the last two decades (- 2% in the 1980s, - 1% in the 1990s) GDP per capita was lower in 2000 than in 1960 40% of the 600 million people less than $1 40% of the 600 million people lived less than $1 a day in 2000 (World Bank 2000) $60 billion $230 billion Growing stock of debt – from $60 billion in 1980 to $230 billion in 2000 $6 billion $11 Growing debt service – from $6 billion a year in 1980s to $11 billion in 1990s
 GDP per capita was lower in 2000 than in % of the 600 million people less than $1 40% of the 600 million people lived less than $1 a day in 2000 (World Bank 2000) $60 billion $230 billion Growing stock of debt – from $60 billion in 1980 to $230 billion in 2000 $6 billion $11 Growing debt service – from $6 billion a year in 1980s to $11 billion in 1990s")
8
1 problem The total disbursements in the form of new loans and grants have always exceeded countries actual debt service. 2 problem The proportion of total debt owed to the IMF, World Bank and other multilaterals has been constantly growing as bilateral donors switched from loans to grants and increasingly forgave outright portions of debt owed them.

9
debt trap. The rising debt levels and the increase in the share of the multilaterals meant that by the mid 1990s the donors and creditors – not the indebted countries – were caught in a debt trap. (Claessens and others 1997) reductionof future lending. Arrears to the multilaterals would have meant the reduction of future lending. Arrears would make visible the failure of the past aid transfers. less to policy and poverty. As a result aid flows started to respond more to debt stocks, less to policy and poverty.
 reductionof future lending. Arrears to the multilaterals would have meant the reduction of future lending. Arrears would make visible the failure of the past aid transfers. less to policy and poverty. As a result aid flows started to respond more to debt stocks, less to policy and poverty..")
10
Over 1977-1998 37 Sub-Saharan countries with all necessary data From 37 countries – 29 are HIPC and the 8 Non-HIPC All data is from World Banks GDF statistics HIPC – high indebted poor countries HIPC – high indebted poor countries

11
Net transfers - - amount of net movement of real resources to the country from official sources on account of debt or grants. Net transfers - - amount of net movement of real resources to the country from official sources on account of debt or grants. NT = G + NB – (P+R) = G + NB – TDS NT = net transfers G = grants NB = new debt disbursements P = principal repayment on existing debt R = interest payment on existing debt TDS = total debt service paid
 = G + NB – TDS NT = net transfers G = grants NB = new debt disbursements P = principal repayment on existing debt R = interest payment on existing debt TDS = total debt service paid.")
12
3 subgroups of indebtedness: Low debt country Low debt country Countrys debt to GDP ratio is less than 62,8% High debt country, low multilateral regime High debt country, low multilateral regime Countrys total debt to GDP ratio is more than 62,8% The share of multilateral debt in total debt is less than 41,2% High debt, high multilateral regime High debt, high multilateral regime Countrys total debt to GDP ratio is more than 63,8% Share of the multilateral debt in total debt is more than 41.2%

17
High lending in the past high debt stock nowdays Independent of the quality of domestic policy, poverty level, institutional capacity to productively absorb flows barrier to selectivity in lending

18
Country Policy and Institutional Assessment (CPIA)
")
19
Burnside and Dollar (2000): based on publicly available datas The index weights three variables: budget surplus as a share of GDP, rate of inflation, degree of openess of the economy CPIA < 3 bad policy countries CPIA =>3 good policy countries 46% bad policy countries, 54% good policy countries
: based on publicly available datas The index weights three variables: budget surplus as a share of GDP, rate of inflation, degree of openess of the economy CPIA < 3 bad policy countries CPIA =>3 good policy countries 46% bad policy countries, 54% good policy countries")
21
1. Degree of indebtedness 1. Degree of indebtedness Characteristics: colonial ties, strategic interest of donors, openess of the economy, policy stance 2. Degree of poverty 2. Degree of poverty High multilateral debt countries are much poorer than low debt countries; $320 per capita vs. $980 per capita 3. Size of economy 3. Size of economy

22
NTij NTij: Net transfer for country in year is scaled to GDP PVTDSGDP PVTDSGDP: Present Value measure of all future scheduled debt service payments relative to GDP GDPCAP: GDPCAP: GDP per capita LNPOP: LNPOP: Population size CPIA: CPIA: Country Policy Institutional Assessment

23
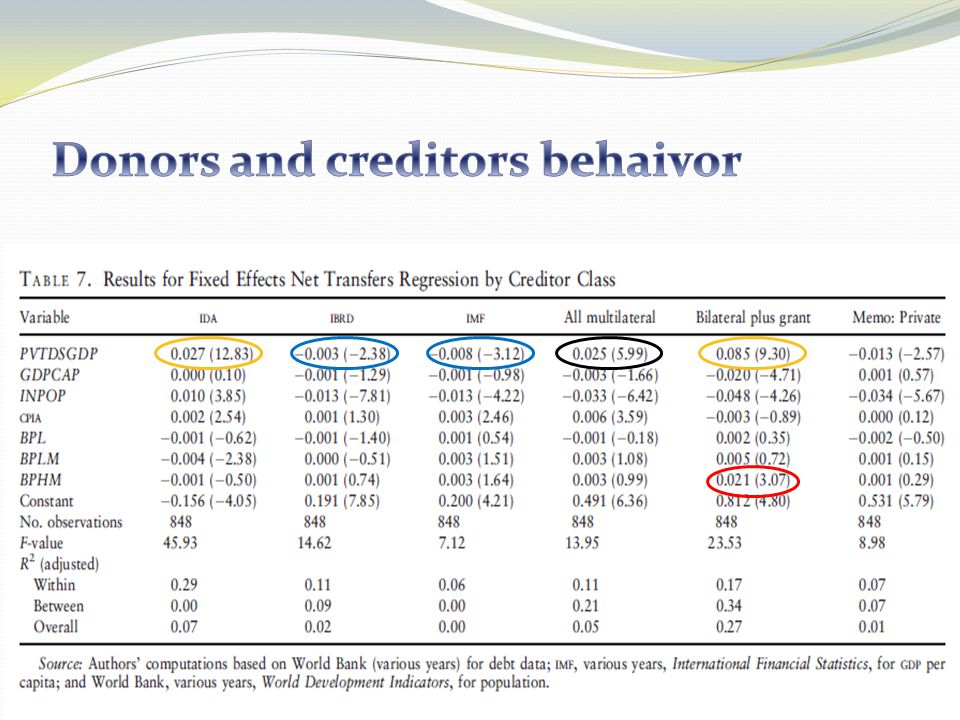
Net transfers are positively related to debt stocks Hight debt stocks more net transfers higher debt stocks Large multilateral debts, donor have allowed poor policy to continue in these countries and actually provided more resources to accomodate larger macro-imbalances

26
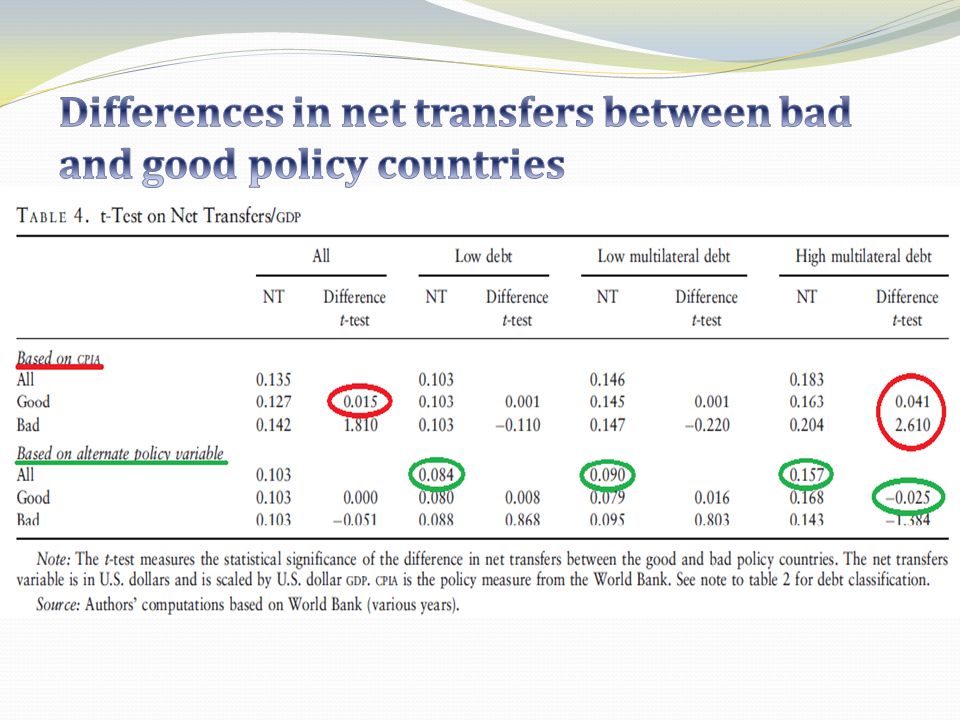
Net transfers were positive over two decades in Sub- Saharan countries More indebted countries received more net transfers. Donors are selective for country policies in low debt countries but not so in high multilateral debt countries. Findings suggest that donors should be selective for country policies –invest less to countries with poor policy.

27
Additional resources to good policy countries will help to enhance their growth and lead to poverty reduction. Donors can make the necessary break with past practice – increase their contribution to the huge development challenges in Africa. Better donor behavior – more effective development assistance in the long rung, convince the public in donor countries to maintain and raise development assistance budgets.

Similar presentations


![Addressing Key Structural Vulnerabilities for [Africas] LDCs UN-OHRLLS Brainstorming Meeting on Substantive Preparation for UNLDC-IV New York, NY 14-16.](/2/722341/big_thumb.jpg "Addressing Key Structural Vulnerabilities for [Africas] LDCs UN-OHRLLS Brainstorming Meeting on Substantive Preparation for UNLDC-IV New York, NY 14-16.>")


