Download presentation
Presentation is loading. Please wait.

1
Food & Agricultural Trade Liberalisation: Can a balance be found? Allan N Rae Director Centre for Applied Economics and Policy Studies Supported by PGSF and C Alma Baker Trust

2
Negotiations Timetable URAA required new negotiations to begin by end of 1999 - these commenced early 2000. In Doha (end-2001) these incorporated into a wider negotiations agenda: The Doha Development Agenda Timetabled for completion 1 January 2005. Modalities to be established by 31 March 2003 Chair of Agric. Committee submitted draft of above in Feb. Widespread criticism Updated draft in mid-March, but little changed. Deadline now extended to September Round to be completed by 1 Jan., 2005
 these incorporated into a wider negotiations agenda: The Doha Development Agenda Timetabled for completion 1 January Modalities to be established by 31 March 2003 Chair of Agric. Committee submitted draft of above in Feb. Widespread criticism Updated draft in mid-March, but little changed. Deadline now extended to September Round to be completed by 1 Jan.,")
3
Doha Ministerial Statement For agriculture, to pursue substantial improvements in market access; reductions of, with a view to phasing out, all forms of export subsidies; and substantial reductions in trade-distorting domestic support

4
Market Access

5
Background: Agricultural tariffs Despite URAA cuts, all bound tariffs for agricultural & food items average 62%. Highest are those on tobacco products, dairy, and meats Considerable water in tariffs, especially developing countries NTBs: Dirty tariffication in URAA exaggerated base levels of protection Large dispersion across countries & commodities Ad valorem & specific tariffs

7
Background: Quotas URAA required NTBs to be replaced by equivalent tariffs. But in order to provide minimum market access where little or none had existed, TRQs were invented Out-quota tariffs often so high that these act like quotas In some cases, quotas are under-filled, even when in-quota tariffs are very low

8
P Q Pw(1+To) Pw(1+T1) q1 q2 Pw=import price To = within-quota tariff T1 = out-of-quota tariff D = import demand curve q1 = the quota quantity q2 = total imported quantity Higher tariff paid on q2-q1 What is the quota rent? D0 D1 D2 q0

9
Export Competition

10
Background: Export Subsidies URAAs twin reduction commitment Most effective component of URAA? Of total expenditure 1995-98, EU accounted for 89% (USA, 1.5%) EU subsidised nearly all its exports of coarse grains, dairy products and beef
 EU subsidised nearly all its exports of coarse grains, dairy products and beef.")
11
Other export competition issues – in contrast to export subsidies, these have a Nth American focus Export credits: US programmes a focus. –But US subsidy value only 7% of the commodity value. –Likely induce only small distortions Exporting STEs: Canadian Wheat Board –Are export subsidies provided? Food Aid: US programmes again a focus –Donations have tended to increase in times of surplus: surplus disposal? –In grant form only?

12
Domestic Support

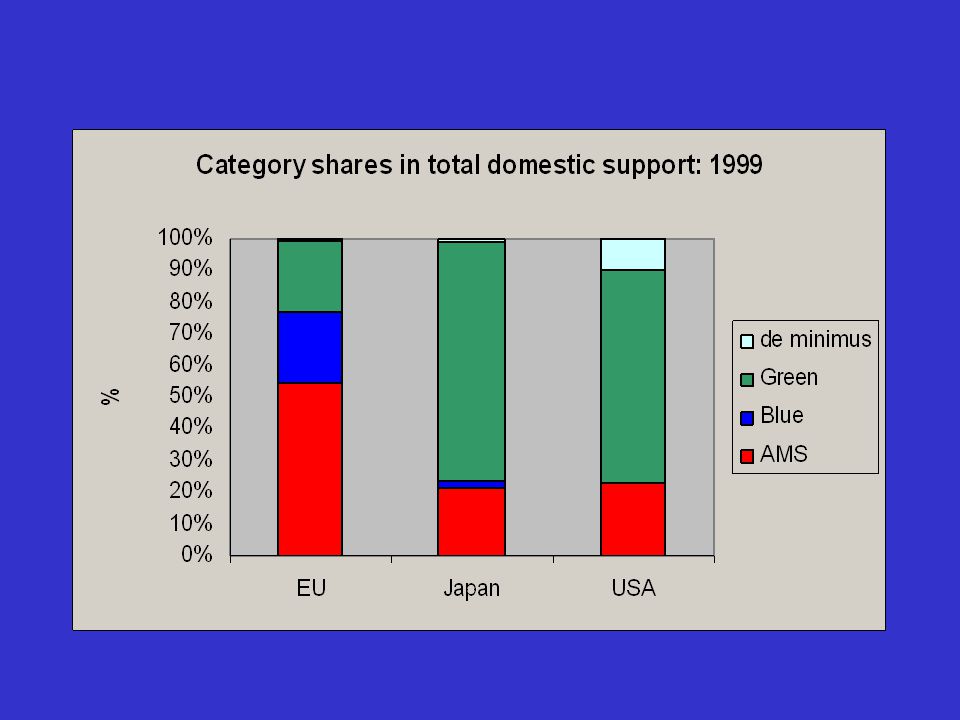
13
Background: Domestic Support Boxes and categories of instruments What is decoupled? The AMS Trend from distorting to less-distorting instruments – US U-turn?

16
Domestic support: examples of exempted policies Research Training and extension Inspection/quarantine Market information/promotion Stockholding Decoupled income support Natural disaster relief Structural adjustment assistance Payments under environmental programmes

19
Non-trade concerns EU, Japan, Norway etc argue for multifunctionality Argue that agricultural has multiple objectives: eg –Rural development and rural viability –Environmental protection –Food security –Retain farming practices for tourism Seen as public goods – a market system will not produce them at optimal levels Therefore public support is justified They are often joint products with food

20
Can farm payments be fully decoupled from production & trade? Even decoupled payments may impact production: –May reduce income variance, and farmers tend to be risk-averse –Increase wealth and move farmers to a less risk- aversion state –May relax debt constraints –May increase on-farm investment –..and base periods may be updated

21
Is there any empirical evidence? Limited evidence suggests degree of coupling not strong –Nth American studies have looked at US and Canadian programmes, and reached above conclusion. –A World Bank econometric study found elasticity of net import demand wrt non-exempt support = -0.10, and that for exempt support was <0 but not significant –The GTAP model provides rather similar elasticities How much negotiating effort to devote to reducing such spending, or limiting the green box?

22
Summary of Selected Proposals: Tariffs Cairns Group –Swiss formula (a=25) from bound rates, over 5 years –Special treatment for developing countries USA –Swiss formula (a=25) from applied rates, over 5 years –Tariffs simplified to either ad valorem or specific EU –flexibility of the URAA formula, over 6 years –Special treatment for developing countries
 from bound rates, over 5 years –Special treatment for developing countries USA –Swiss formula (a=25) from applied rates, over 5 years –Tariffs simplified to either ad valorem or specific EU –flexibility of the URAA formula, over 6 years –Special treatment for developing countries")
23
The Swiss Formula Proposed by Cairns Group and USA Swiss formula: t 1 = a.t 0 /(a + t 0 ) Maximum tariff becomes 25% Implies very large tariff reductions in many cases
 Maximum tariff becomes 25% Implies very large tariff reductions in many cases")
24
TRQs US –Cut in-quota tariff to zero, and expand quota by 4% per year, over 5 years –Quota expansion on MFN basis Cairns Group –Cut in-quota tariff to zero, and expand quota by 20% of domestic consumption, over 5 years –Quota expansion on MFN basis –As for US, special consideration for developing countries EU –No specific targets, but wants administration enhanced

25
Export Subsidies EU –Cut spending by average of 45% –On condition all forms of export subdisation treated on equal footing –Greater reduction for commodities important to developing countries US –Elimination over 5 years Cairns Group –Eliminate all forms of export subsidisation –At least 50% cuts in export subsidies in first year

26
Domestic Support: Amber/Blue Boxes EU –Reduce amber box by 55% using the URAA method –Retain current definitions of domestic support –Eliminate de minimus exemption for developed countries Cairns Group –Eliminate on product-specific basis over 5/9 years –50% downpayment in first year –Reduce de minimus exemption for developed countries –Applies to blue box US –Reduce total AMS to 5% of 96-98 value of agr. Production, over 5 years –Applies to blue box

27
The Harbinson Draft Attempt to seek compromise among the proposals, released February 2003. Too ambitious for some, not ambitious enough for others! EU, Japan & others: unbalanced between trade & non-trade concerns Revised in March What were some of the major features?

28
Harbinson: Market Access Tariffs – reduce by 40%, 50% or 60%, depending on height of base tariff for developed countries For developing countries, reductions are 25%, 30%, 35% and 40% Additional flexibilities exist Flat 10% cut for developing countries strategic products Cut made to bound rates Special safeguard to be eliminated for developed countries

30
Harbinson: Export Subsidies Developed countries: for at least half of base outlay, eliminate over 5 years. Rest eliminated over 9 years. (10/12 years for developing countries)
.")
31
Harbinson: Domestic Support Amber: –Reduce by 60% over 5 years –Reduced by 40% over 10 years for developing –de minimus to be halved over 5 years (maintain for developing regions) Blue: reduce by 50% over 5 years Green: maintain, with possible amendments to provisions for exemption –
 Blue: reduce by 50% over 5 years Green: maintain, with possible amendments to provisions for exemption –")
32
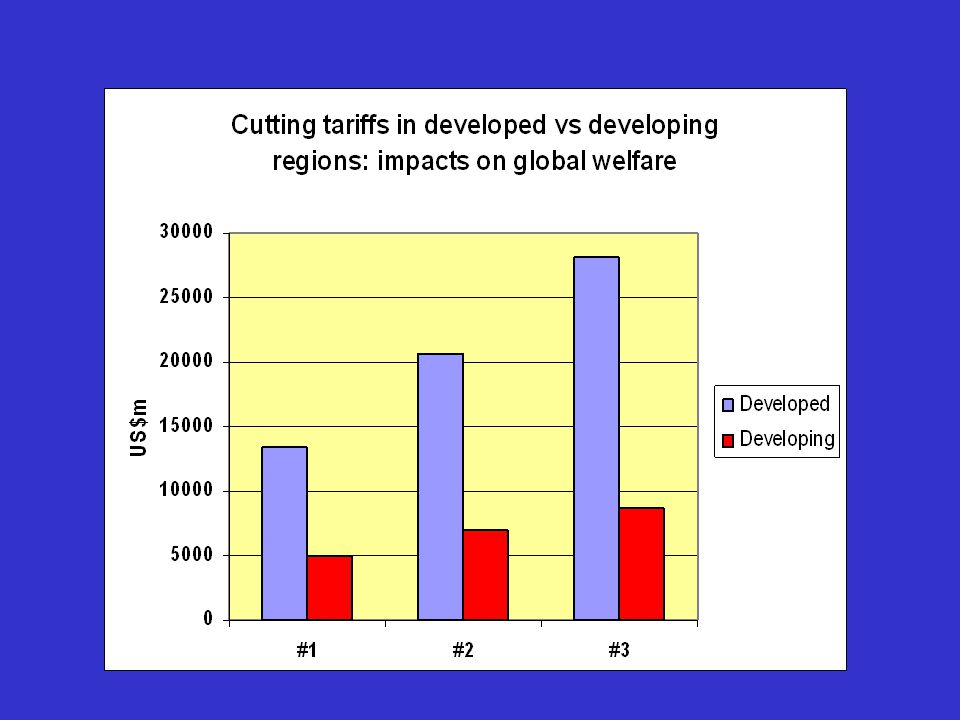
Some Modeling Results @ CAPS Global Trade Analysis Project applied general equilbrium model 1997 database has 66 regions & 57 sectors Aggregated up to 11 regions & 15 sectors –These include 8 farm and 4 food processing sectors Tariffs from AMAD database Export subsidy data from WTO notifications Domestic support from OECD/PSE data

33
Scenarios Reflect some major elements of various proposals #1 (based on EU proposal) –Tariff cuts: 36% ~ 24% –Export subsidy cuts: 45% –Amber box cuts: 55% ~ zero #2 (based on Harbinson draft) –Tariff cuts: as in Harbinson –Export subsidy cuts: 100% ~ 50% –Amber box cuts: 60% ~20% #3 (based on US & Cairns proposals) –Tariff cuts: Swiss (a=25) for developed –Cairns proposal for developing countries –Export subsidy cuts: 100% –Amber box cuts: 100% ~ 50%
 –Tariff cuts: 36% ~ 24% –Export subsidy cuts: 45% –Amber box cuts: 55% ~ zero #2 (based on Harbinson draft) –Tariff cuts: as in Harbinson –Export subsidy cuts: 100% ~ 50% –Amber box cuts: 60% ~20% #3 (based on US & Cairns proposals) –Tariff cuts: Swiss (a=25) for developed –Cairns proposal for developing countries –Export subsidy cuts: 100% –Amber box cuts: 100% ~ 50%")
38
WHAT IS A SOUND BALANCE? TRADE CONCERNS: Changes to tariffs & export subsidies NON-TRADE CONCERNS: Changes to domestic subsidies

46
Summary Tariff cuts in developed and developing regions account for nearly all global welfare gains – impact of former>>latter Tariff cuts the most important contributor to NZs welfare gain, especially by developed regions – both have more impact that cuts to export subsidies. Appropriate to give market access the highest priority, especially developed country reforms Harbinson does this thru larger cuts to higher tariffs

47
Cuts to the amber box made very little impact on global welfare, and negligible contribution to NZ welfare gains. But they did contribute to higher international grains prices Tightening domestic support constraints may make tariff cuts difficult Loosening those constraints could buy increased access to developed region markets & lead to significant gains: reinstrumentation Smaller cuts in the AMS & blue box could appease EU, and also moderate ToT impacts on food net importers Once progress made on trade policies, turn attention to the (less distorting) domestic support policies
 domestic support policies.")
Similar presentations


 1 The Expected Market Impact of.>")


 –Established in 1947 as a forum to reduce trade barriers WTO replaced GATT in 1995 as legal.>")
>")


![1 [Giovanni Anania, IAAE Congress, Durban, August 2003] The Fischler reform of the CAP and the WTO negotiations Giovanni Anania Department of Economics.](/15/4826176/big_thumb.jpg "1 [Giovanni Anania, IAAE Congress, Durban, August 2003] The Fischler reform of the CAP and the WTO negotiations Giovanni Anania Department of Economics.>")


