Download presentation
Presentation is loading. Please wait.

1
June 13, 2012

2
Example: A study was conducted to see if a new therapeutic procedure is more effective than the standard treatment in improving the digital dexterity of certain handicapped persons. Twenty-four pairs of twins were used in the study, one of the twins was randomly assigned to receive the new treatment, while the other received the standard therapy. At the end of the experimental period each individual was given a digital dexterity test with scores as follows. 2

3
Since The variable concerning digital dexterity test scores is continuous The sample size is greater than 10 digital dexterity test score is normally distributed There are two groups and they are dependent Paired sample t-test 3

4
NewStandardDifference 4954-5 564214 70637 83776 83 0 685117 84822 63549 67625 79718 88826 4850-2 524111 73676 5257-5 73703 78726 64622 71647 4244-2 51447 564214 40355 81738 Total129 Mean65,4660,085,38 SD14,3814,465,65 H 0 : d = 0 H a : d > 0 t (23,0.05) =1.7139 We conclude that the new treatment is effective. Since, reject H 0. 4

5
5 SPSS Output

6
6

7
Example: To test whether the weight-reducing diet is effective, 9 persons were selected. These persons stayed on a diet for two months and their weights were measured before and after diet. The following are the weights in kg: Subject Weights BeforeAfter 18582 29192 36862 47673 58281 68783 710585 89388 99890 Since The variable concerning weight is continous. The sample size is less than 10 There are two groups and they are dependent Wilcoxon signed ranks test 7

8
Subject WeightsDifference D i Sorted D i Rank Signed Rank BeforeAfter 1858231.5-1.5 2919211.5 36862633.5 47673333.5 582811455 687834566 71058520677 893885888 9989082099 8

9
T = 1.5 reject H 0, p<0.05 T = 1.5 < T (n=9,a =0.05) = 6 T = 1.5 < T (n=9,a =0.01) = 2 reject H 0, p<0.01 We conclude 99% confident that diet is effective. 9

10
10

11
11 Example: 35 patients were evaluated for arrhythmia with two different medical devices. Is there any statistically significant difference between the diagnose of two devices? Device I Device II Total Arrhythmia (+)Arrhythmia (-) Arrhythmia (+)10313 Arrhythmia (-)13922 Total231235
Arrhythmia (-) Arrhythmia (+)10313 Arrhythmia (-)13922 Total")
12
12 H 0 : P 1 =P 2 H a : P 1 P 2 Critical z value is ±1.96 Reject H 0

13
13 McNemar test approach: 2 (1,0.05) =3.841<5.1 p<0.05; reject H 0.
 =3.841<5.1 p<0.05; reject H 0.")
14
14 SPSS Output

15
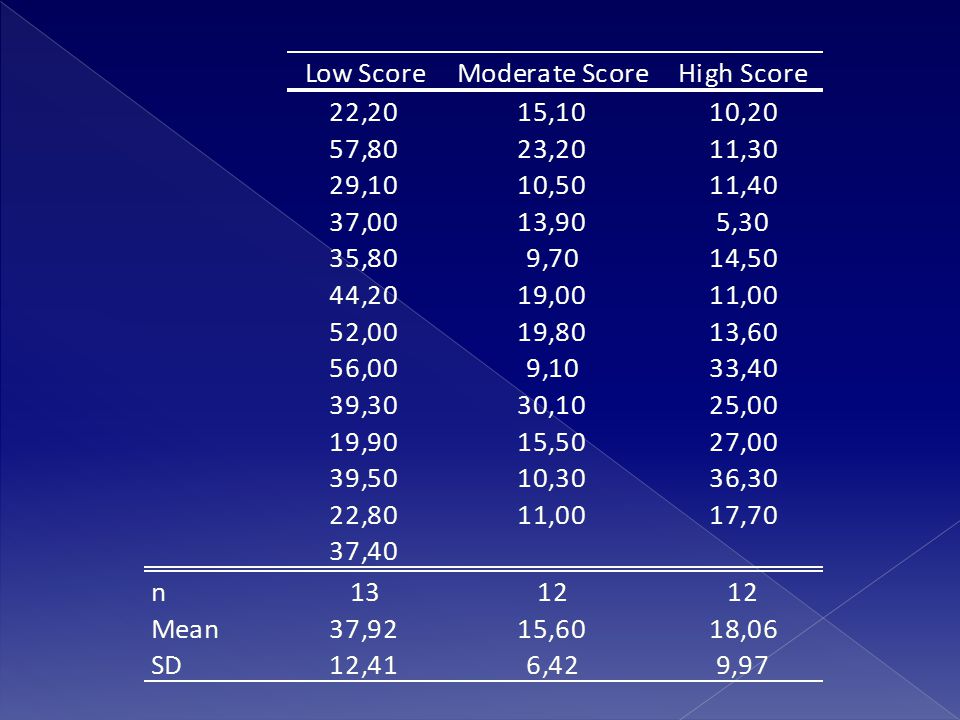
Example: NK cell activity was measured for three groups of subjects: those who had low, medium, and high scores on Social Readjustment Rating Scale. The original observations, sample sizes, means and standard deviations are given in table. Is the mean NK cell activity different in three groups?

17
The variable concerning NK cell activity measures is continuous. There are three groups. Variances are equal in three groups. NK cell activity values in each group are normally distributed. The sample size of each group is greater than 10 One-Way ANOVA

18
12 13 N = GROUP HighModerateLow Mean 1 SD NKA 60 50 40 30 20 10 0

19
H 0 : 1 = 2 = 3 H a : Not all the i are equal. SSA=SST-SSW=7182.31-3394.01=3788.30

20
MSW=SSW/34=3394.01/27=99.82 MSA=SSA/(3-1)=3788.30/2=1894.15 F=MSA/MSW=1894.15/99.82=18.98 We conclude that not all population means are equal.
= /2= F=MSA/MSW= /99.82=18.98 We conclude that not all population means are equal.")
21
Since n 1 n 2, reject H 0 if 2.46<8.28, accept H 0. H 0 : 2 = 3 19.87>8.12, reject H 0. H 0 : 1 = 3 22.32>8.12, reject H 0. H 0 : 1 = 2 Statistical Decision LSDHypothesis

23
Example: Hamilton depression scores was measured for three groups of subjects and shown in table. Is the Hamilton depression scores different in three groups? SubjectGroup1Group2Group3 112015 2111915 312019 413174 59141 612119 722021 811518

24
Since The variable concerning Hamilton depression score is continuous The sample size is less than 10 There are three groups and they are independent Kruskal Wallis Test H 0 : The population distributions are all identical. H a : At least one of the populations tends to exhibit larger values than at least one of the other populations.

25
Group1Group2Group3 ScoreRankScoreRankScoreRank 13.52021.51514 11919 1514 12100119 1311171647 98141213.5 1 2123.519 262021.52123.5 13.515141817 RiRi 54.5128.5117

26
KW=7.93 > χ 2 (2,a=0.05) = 5.99Reject H 0 We conclude that at least one of the populations tends to exhibit larger values than at least one of the other populations.
 = 5.99Reject H 0 We conclude that at least one of the populations tends to exhibit larger values than at least one of the other populations.")
27
Multiple Comparisons Table GroupsStatistical Decision 1-29.255.87p<0.05 1-37.825.87p<0.05 2-31.435.87p>0.05

29
Example: A researcher wants to know whether the mothers age is affecting the probability of having congenital abnormality of neonatals or not. The collected data is given in the table: Congenital abnormality Total PresentAbsent Age groups2532225 26-3583442 >35181634 Total2972101

30
H 0 : There is no relation between the age of mother and presence of congenital abnormality. Under the assumption that null hypothesis is true: (Expected count) Congenital abnormality PresentAbsent Age groups253 (7.2)22 (17.8) 26-358 (12.1)34 (29.9) >3518 (9.8)16 (24.2)
 Congenital abnormality PresentAbsent Age groups253 (7.2)22 (17.8) (12.1)34 (29.9) >3518 (9.8)16 (24.2).")
31
Reject H 0

32
Congenital abnormalityχ2χ2 PresentAbsent Age groups 253 (7.2)22 (17.8) 3.44 26-358 (12.1)34 (29.9) 1,95 >3518 (9.8)16 (24.2) 9,64 Omit the >35 age group
22 (17.8) (12.1)34 (29.9) 1,95 >3518 (9.8)16 (24.2) 9,64 Omit the >35 age group")
33
Congenital abnormality PresentAbsent Age groups 25 322 26-35834 H 0 is accepted

34
In older age groups, risk of having a baby with congenital abnormality is higher than the other age groups.

36
Example: A special diet program was given to 20 clinically obese people. Subjects BMI were measured before the diet and they have been followed for two months. BMI measures before the diet and after the end of each month following the diet are given in the table. Is the diet program effective?

37
The variable concerning BMI is continuous The sample size is greater than 10 BMI values are normally distributed There are three groups and they are dependent Repeated measures ANOVA

38
Sources of variationSSdfMSFSig. Times16.79 2 8.3995.920.000 Subjects567.721929.89 Error3.33380.09 Diet program is effective on obese subjects BMI.

40
Example: To compare the effects on the clotting time of plasma of four different methods of treatment of the plasma. Samples of plasma from 8 subjects were assigned to the four treatments. Treatments SubjectIIIIIIIV 18.49.49.812.1 212.815.212.914.4 39.69.111.29.8 4 8.89.912.0 58.48.28.5 68.69.99.810.9 78.99.09.210.4 87.98.18.210

41
Since The variable concerning clotting time is continuous The sample size is less than 10 There are four groups and they are dependent Friedman Test

42
Treatments IIIIIIIV timeranktimeranktimeranktimerank 8.419.429.8312.14 12.8115.2412.9214.43 9.629.1111.249.83 28.819.9312.04 8.428.218.53.58.53.5 8.619.939.8210.94 8.919.029.2310.44 7.918.128.23104 Sum R i 111623.529.5

43
2 (3,0.05) = 7.815 < F r =14.96, p<0.05 Reject H 0. We conclude that at least one of the treatments were different from the other treatments.

45
Example: Four radiologists have evalueted 12 patient whether they have lesion or not; H 0 : There is no difference between the decision of radiologists Since The variable is categorical (0 and 1) There are four groups and they are dependent Cochran Q Test
 There are four groups and they are dependent Cochran Q Test")
46
Subject Radiologist IRadiologist IIRadiologist IIIRadiologist IV RiRi 1 1001 2 2 1001 2 3 1110 3 4 0001 1 5 1111 4 6 1011 3 7 1011 3 8 1001 2 9 1101 3 10 1010 2 11 0011 2 12 0001 1 CjCj 9361018

47
Q Calculated = 9.474 > 2 (3,0.05) =7.815 p<0.05 Reject H 0
 =7.815 p<0.05 Reject H 0")
48
Type of variables Number of groups Independent /Dependent Parametric test assumptionsName of tests Continuous1 –SatisfiedOne sample t test Continuous1 –Not satisfiedSign test Categorical1 –Sample size is largeOne sample proportion test Categorical1 –Sample size is smallOne sample chi square test Continuous2IndependentSatisfiedIndependent samples t test Continuous2IndependentNot satisfiedMann Whitney U Test Categorical2IndependentSample size is largeDifference between two population proportions Categorical2IndependentExpected count > 52*2 chi square test Categorical2Independent Expected count < 5 at least in one cellFisher's exact test Continuous2DependentSatisfiedPaired samples t test Continuous2DependentNot satisfiedWilcoxon signed rank test Categorical2DependentSample size is large Difference between two dependent population proportions Categorical2DependentSample size is smallMcNemar Test ContinuouskIndependentSatisfiedOne way ANOVA ContinuouskIndependentNot satisfiedKrıskal Wallis Test CategoricalkIndependentExpected count > 5r*c Chi square test ContinuouskDependentSatisfiedRepeated measures ANOVA ContinuouskDependentNot satisfiedFriedman test CategoricalkDependent –Cochran Q test

Similar presentations


 Motion Controller Design for A Class of Second-order Systems Center for Self-Organizing Intelligent.>")
