Download presentation
Presentation is loading. Please wait.

1
Downtown / SoBro

2
Market Analysis Forecast potential: All uses in SoBro & broader Downtown Area Downtown: the economic core of the apple & face of Nashville Strategic Planning Translate the market findings into development, marketing, management, and financing strategies for implementation Purpose of this Information MDHA: Programs, redevelopment policies & incentives Specific attention to Rolling Mill Hill Inform the SoBro Master Plan (CCA) Downtown development planning & ED Downtown marketing Data/information to help guide private development
 Downtown development planning & ED Downtown marketing Data/information to help guide private development")
5
Location Center of 13-county MSA; market of 1.7 million 1-days drive of 50% US population Good air connections, but lacks strong international access Local Transportation Access Limited, but gradually expanding public transit system Convergence of 6 interstates: Nexus & Noose East-west connectivity issues Parking Accelerating need for parking management & access Physical Conditions Topography & flooding Important architectural heritage but missing teeth Sporadic but limited identity marketing urban design

6
Industrial: 9.0 million sq. ft. Office: 7.9 million sq. ft. Housing: 5,900 units Retail: 1.5 million sq. ft. Convention:1.2 million sq. ft. Hotels:2,500 rooms Government & Community:150+ Parking lots754 Vacant lots1,560 Audience Support: Museums 4 (+2 planned) Performing arts venues6 Multi-use & sports venues5 Commercial entertainment46 (650,000 sq. ft.) Historic/Visitor attractions11 Parks & trails4
 Performing arts venues6 Multi-use & sports venues5 Commercial entertainment46 (650,000 sq. ft.) Historic/Visitor attractions11 Parks & trails4.")
7
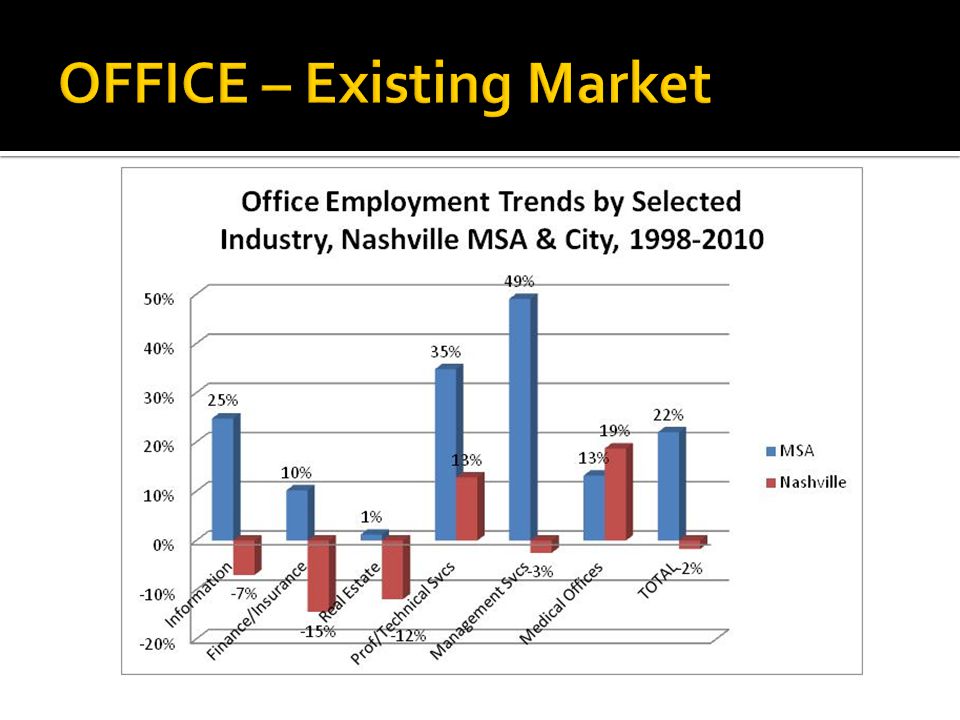
Diversified regional economic base Concentrations in health care, accommodation services, and retail trade 6.7% employment growth since 1998 100,000 jobs added 1998-2007 60,000 jobs lost 2007-2010 Declining industries Manufacturing: -36% (-30,000 jobs) Construction -10% (-3,600 jobs) Growing industries Health care +35% (+27,300 jobs) Accommodation +31% (+16,000 jobs) Management +49% (+8,600 jobs)
 Construction -10% (-3,600 jobs) Growing industries Health care +35% (+27,300 jobs) Accommodation +31% (+16,000 jobs) Management +49% (+8,600 jobs)")
9
Downtown Mix State Government Banks & financial institutions Law firms Corporate Technology Media

13
Absorption Trends 640,000 sf / year (96-11) 840,000 sf / year (07-11)
 840,000 sf / year (07-11)")
14
Office Employment Projections (MSA): 2012-2021 Growth: 27,100 (19.5%) Prof/Technical Services +12,700 jobs (33.2%) Management Services +5,900 jobs (22.1%)
: Growth: 27,100 (19.5%) Prof/Technical Services +12,700 jobs (33.2%) Management Services +5,900 jobs (22.1%)")
15
Competitive Framework Cool Springs-Brentwood Franklin Park Airport Buchanan Point Midtown West End Summit 1515 Demonbreun One City / Charlotte Medical Corridor

16
Potential: 564,000 – 745,000 sq. ft. by 2022 Equal to 1 Batman Bldg or 2 SunTrust Plazas Escalating trend of Re-urbanization Demand Drivers: Professional, scientific & IT/technical services Management services Media & entertainment Others: Health care, FIRE Growing Base: Small IT, entertainment & service firms

17
Gulch Interstate access Proximity to health centers Downtown State Government draw-down Pro-active recruitment So Bro Information & Media Services 38,400 – 50,800 square feet Professional & Technical Services 34,200 – 70,600 Management Services 26,100 – 28,600 Medical Offices 23,700 – 25,800 Finance & Insurance 20,300 – 20,600 Real Estate 6,100 - 27,700 Table 13.NEW OFFICE TENANT MIX BY INDUSTRY AND LOCATION, DOWNTOWN AREA, 2012-2022 TenantGulchCoreSoBro Information/Media20%15%24% Finance & Insurance16%20%9% Real Estate4% Prof & Tech Svcs24%40% Management17%4%10% Medical Offices19%18%13% Source:Randall Gross / Development Economics.

18
Create space to accommodate smaller, emerging footloose firms Create supportive environment for office tenants Provide sufficient parking & transit Ameliorate State Government drawn down (20%) Reduce space /change use in functionally- obsolescent buildings Pro-active marketing & recruitment can result in drop ins
 Reduce space /change use in functionally- obsolescent buildings Pro-active marketing & recruitment can result in drop ins")
20
Diverse central city neighborhoods Rutledge Hill The Gulch Rolling Mill Hill SoBro Germantown Salemtown Hope Gardens Capitol Hill (Sulphur Dell, N Capitol, Market District) Downtown
 Downtown")
23
CBD Rental Market High occupancy 92% (2009) – 98% (2012) CBD highest in region Rents $1.95 psf average Absorption 140 – 160 units / month 30 units / mo / project CBD For-Sale Market (2011-12) Ave SF: 1,260 Ave Sale Price: $196,070 Ave Sale/SF: $156 # Sales: 630/year # Condos on market: <10
 – 98% (2012) CBD highest in region Rents $1.95 psf average Absorption 140 – 160 units / month 30 units / mo / project CBD For-Sale Market ( ) Ave SF: 1,260 Ave Sale Price: $196,070 Ave Sale/SF: $156 # Sales: 630/year # Condos on market: <10")
24
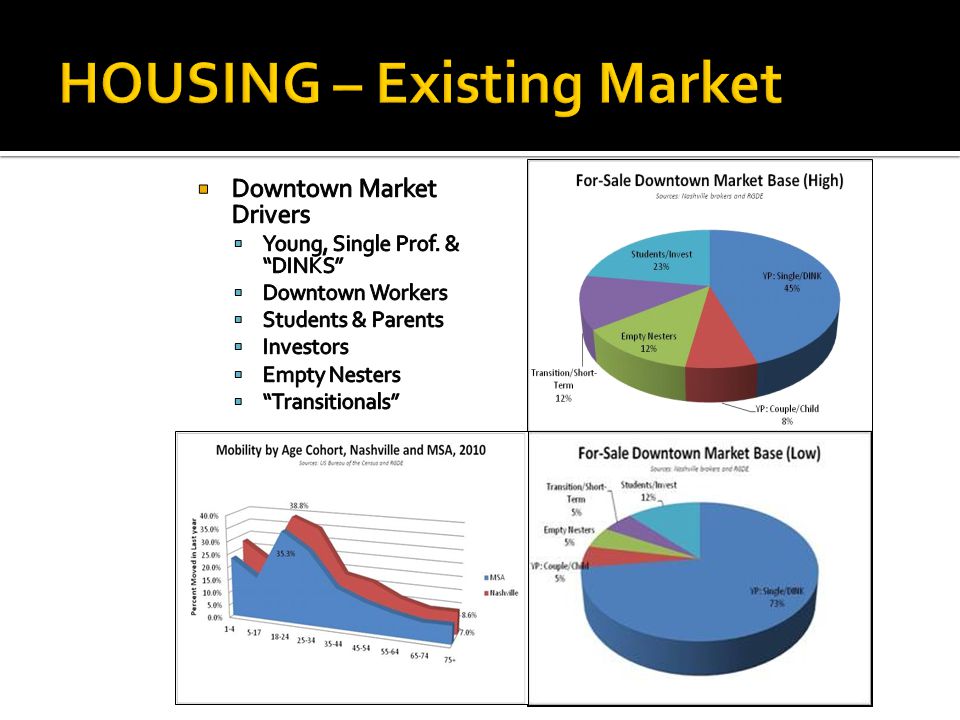
Demographics 94% have attended college 1/3 have advanced degrees Diverse incomes 40% work in Government, 12% in non-profits 16% work in law firms 77% are home owners; Only 21% are renters

26
8% already live downtown Another 30% would consider living downtown Highest propensity: Antioch Hermitage West Meade Old Hickory Bellevue Crieve Hall/Glencliff S Nashville/Woodbine Reason to live downtown: Closer to work: 43% Closer to city life:34% N/A or Already in CBD:17% Other reasons: 5% Closer to friends/people:< 1%

28
Preferences Historic or consistent with neighborhood character Home ownership Single-family: 54% Detached: 31% Attached: 23% Affordable $2,200 / month average 1/3 < $1,000 / month

30
Competitive Framework

31
Potential: 3,530 housing units in Loop by 2017 2,200 move-ups / move-downs 1,330 growth-generated (600 relocations) Product: Detached Single-Family Homes 650 DU Attached Single-Family/Brownstones 505 Lofts/Units in Mixed-Use Buildings 500 Condominiums 400 Multi-family Apartments 1,480
 Product: Detached Single-Family Homes 650 DU Attached Single-Family/Brownstones 505 Lofts/Units in Mixed-Use Buildings 500 Condominiums 400 Multi-family Apartments 1,480")
32
Northside Neighborhoods (Germantown, Capitol Hill, Buena Vista, Salemtown) Single-family attached & detached Mid-rise lofts, mixed-use SoBro/Rolling Mill Hill High-rise apartments and condominiums Loft/Mixed-use, Mixed-income buildings Single-family attached (e.g., brownstones) Gulch/Downtown High-rise apartments and condominiums Conversions of office space Mixed-use
 Single-family attached & detached Mid-rise lofts, mixed-use SoBro/Rolling Mill Hill High-rise apartments and condominiums Loft/Mixed-use, Mixed-income buildings Single-family attached (e.g., brownstones) Gulch/Downtown High-rise apartments and condominiums Conversions of office space Mixed-use")
36
CBD Area Rents Downtown Core$17.19 per square foot SoBro$14.29 Germantown$15.42 East $12.50 Gulch$26.00 Sales (per business interviews) Average $207psf Growth+1.7%/annum Increasing63% Declining17%
 Average $207psf Growth+1.7%/annum Increasing63% Declining17%")
37
Key Issues Parking accessibility & pricing Dominance of dining & entertainment Dependency on events & tourism CMA Fest is Christmas Heavy dependence on Bridgestone Arena Limited (but growing) regional market appeal Lack of shopping district Parking / traffic Lack of anchors
 regional market appeal Lack of shopping district Parking / traffic Lack of anchors")
38
Trade Area: $4.2 Billion forecasted growth in income by 2017 $2.5 Billion growth in expenditure potentials Visitors: $117.5 million growth Downtown Workers: $53.7 million growth Students: $1.0 million growth

41
Key anchor uses Cinemas Musical theatre entertainment Local Brands Jack Daniels, Goo Goo Clusters Artisan industrial * Toy, hobby & game store Department / GM store (General store concept) Sporting goods store Apparel & accessory stores So Bro Mixed-use, anchored shopping district (3-5 blocks) Lafayette Street
 Sporting goods store Apparel & accessory stores So Bro Mixed-use, anchored shopping district (3-5 blocks) Lafayette Street")
44
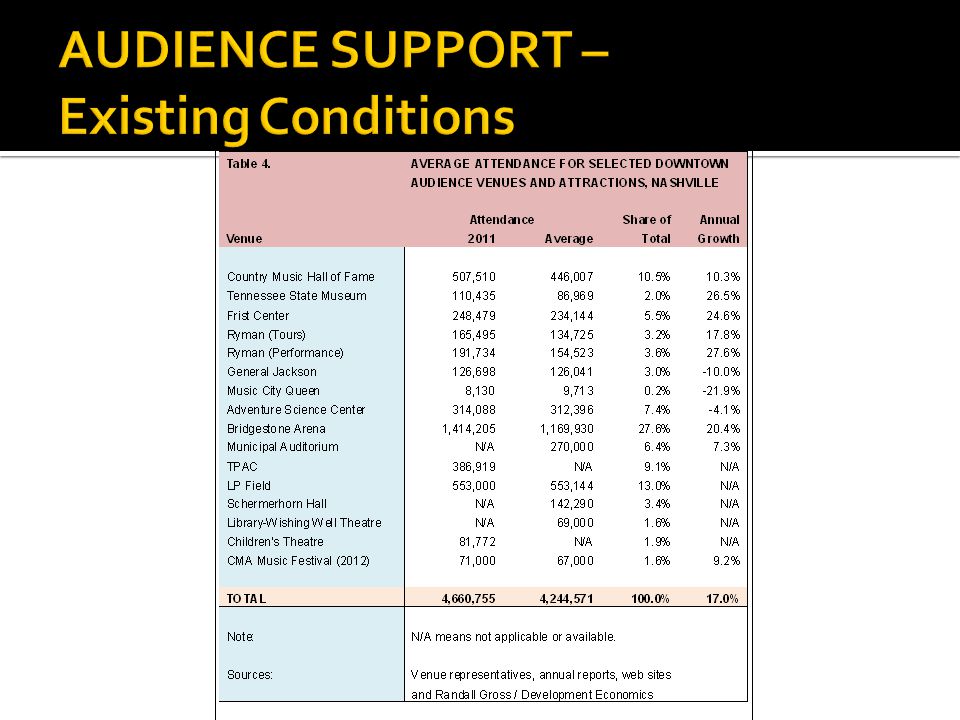
Leisure Travel Sightseeing is 45% of all visits to Nashville 1,130,000 estimated out- of-town visitors to CBD attractions (2011) 84% of overnight visitors stay in hotels Business Travel Estimated 390,000 convention attendance in 2012, increasing to 516,000 by 2016 (MCC).
 84% of overnight visitors stay in hotels Business Travel Estimated 390,000 convention attendance in 2012, increasing to 516,000 by 2016 (MCC).")
45
CBD Area – 4,000+ rooms Omni Nashville – 800 rooms Hyatt Place-255 Gulch – <450 Eakin Partners (270+/-) Vision Hospitality (150+/-) Hilton Harden Inn-200 Giarrantana-315 / Marriott Trail West (Westin)-475 Others: White Lodging (4*) Pinnacle Hotels 5 th Ave/KVB 415 4 th Avenue Matthews/Northpoint (5 th /KVB) Platinum Hosp (406 6 th ) Arizona investors 432 6 th Competition Homewood Suites-192 Residence Inn/Spring Hill Suites Intercontinental
 Vision Hospitality (150+/-) Hilton Harden Inn-200 Giarrantana-315 / Marriott Trail West (Westin)-475 Others: White Lodging (4*) Pinnacle Hotels 5 th Ave/KVB th Avenue Matthews/Northpoint (5 th /KVB) Platinum Hosp (406 6 th ) Arizona investors th Competition Homewood Suites-192 Residence Inn/Spring Hill Suites Intercontinental")
46
4,100 rooms near MCC with 1,740 existing & 2,400 planned known hotel rooms Yields ratio of 0.011 rooms/SF convention space. Roughly equal to comparables average of 0.012 rooms/SF

47
Demand for +361,500 room-nights by 2017 Potential for +2,590 rooms in SoBro area 2,460 known rooms planned in SoBro area Classification Mismatch: Only 2 planned hotels are full-service properties with 300+ rooms, as needed by convention planners

49
Industrial is largest land use in CBD study area ICBD is 2 nd largest regional industrial sub-market ICBD vacancy is only 5.9%, lowest of all sub-markets Industrial absorption rebounded in 2011 CBD is competitive for machine shops, repair services, wholesale supply, recycling, transportation services, showroom space, & specialty niche manufacturing spaces Despite decline in manufacturing overall, growth in niche industries, i.e., food & beverage

50
SoBro Artisanal Manufacturing Uses Whiskey distilleries Micro-breweries Specialty bakeries Confectionary manufacturers (chocolate and non-chocolate) Artisanal / regional food manufacturers Craft furniture and furnishings designers, producers & wholesalers Small specialty lighting and electrical equipment manufacturers Craft paper, bookbinding and specialty printing companies Visual artists and sculptors Craft toy and game producers Clothing, footwear, jewelry and accessory designers and producers Specialty regional meat producers/butchers (e.g., smoked hams) Record & DVD pressing companies Film production companies
 Artisanal / regional food manufacturers Craft furniture and furnishings designers, producers & wholesalers Small specialty lighting and electrical equipment manufacturers Craft paper, bookbinding and specialty printing companies Visual artists and sculptors Craft toy and game producers Clothing, footwear, jewelry and accessory designers and producers Specialty regional meat producers/butchers (e.g., smoked hams) Record & DVD pressing companies Film production companies")
53
Key anchors Family Entertainment Venues Thematic Musical Theatre Specialty Museums Baseball stadium Cinemas (commercial or community) Commercial stage & musical production theatres Specialty museums (e.g., international or ethnic culture) Baseball, soccer, basketball venues Family entertainment venues (i.e., Dave & Busters), bowling center, etc Amphitheatre (although situated on east bank) Architectural tours, public historic houses (e.g., Polk Place), etc. Live music venues (beyond country honky-tonks and symphony) Programmed public art Ethnic cultural venues (such as performing arts venues or galleries) Centralized public space/park International language services & tours
 Programmed public art Ethnic cultural venues (such as performing arts venues or galleries) Centralized public space/park International language services & tours.")
55
Create distinct districts for identity marketing & neighborhoods that appeal to potential residents Rolling Mill Hill: Industrial theme Mixed-housing, art lofts/studios, retail node Lafayette District: 4 th / 5 th Avenue & Lafayette Shopping Districts 8 th Avenue funky antiques & home furnishings 4 th Avenue Brownstone Row Neighborhood Rutledge Hill Neighborhood: Historic District - Fill gaps 5 th Avenue Show District Dining & entertainment – musical/theatre Link to Ave of Arts, CMHOF, Opry, MCC, District, and Schermerhorn Arts/Cultural anchor at 5 th & Lafayette

56
SoBro Mixed-Use Neighborhood & Shopping District Brownstones Lofts / Mixed-use 2-5 blocks retail Anchor stores Local Brands Nashville Artisan industrial activities Newbury Street, Boston Forest Avenue, Staten Island Palo Alto, CA

57
International reputation draw as Music City Strong talent base in writing, composing, arranging, and performing music Strong technical base in production Growing talent base as well in dance and choreography, acting, fashion design, crafts Strong corporate base in music management, marketing, and production Synergies with growing theatre and film production community, including interest in promoting Nashville as a home base for musical theatre productions Synergies with Downtown live music scene, Ryman, Bridgestone, other performance venues Growing, built-in convention and tourism audience Growing dining scene, hotels, and support services Local support for performance venues Lower cost of production compared w/major cities Inherent interest among country music fans in family-oriented entertainment

58
Workforce Training & Entrepreneurship Campus: Artisanal Business & Green Technology Center Change Interface of MCC and Homeless shelters Create attractive campus environment while enhancing opportunities for redevelopment and revitalization in the Lafayette Corridor. Incorporate job and entrepreneurship training (culinary arts, recycling businesses) with existing housing, counseling, and medical facilities Build partnerships between business, government & providers Holistic approach to homelessness; De-emphasize warehousing of homeless Nashville as cutting edge example
 with existing housing, counseling, and medical facilities Build partnerships between business, government & providers Holistic approach to homelessness; De-emphasize warehousing of homeless Nashville as cutting edge example.")
59
Mixed-use Capitol Hill neighborhood along Bicentennial Mall Anchored by proposed State Library / Archives, music museum Activate Park / Farmers Market as destination with restaurants, market retail uses Mixed-use & structured parking (State/Metro/Private)
")
60
Decking of Interstate Linking CBD/ West End markets Provides underground parking opportunity Strengthens core Creates walk-able link between Midtown and CBD The Cap in Columbus (I-670)
")
61
Downtown/Midtown Parking Authority Cultural Nodes & Specialty Museums Nashville as cultural capital Performance /Retail venue at TSU Demonbreun (or Lafayette) Park Central Park for SoBro Thermal Site (SoBro Plan Concept) Improved pedestrian & transportation linkages SoBro-Gulch (SoBro Plan Concepts) CBD – Midtown (decking) Transit stops at appropriate locations
 Park Central Park for SoBro Thermal Site (SoBro Plan Concept) Improved pedestrian & transportation linkages SoBro-Gulch (SoBro Plan Concepts) CBD – Midtown (decking) Transit stops at appropriate locations")
62
Build on historic context The small pieces are important The best cities feel organic Ensure mixed-use & walk-ability Reduce need / cost of parking & transportation Appeal to growing number of market niches Appeal to diverse markets Nashvilles growth is driven by diverse markets No one size fits all for businesses or residents Diversity of districts, nodes, corridors, neighborhoods, products, and pricing

63
Recognize Importance of Pro-active Leveraging In order for Nashville to capture its market potential, there is a need for more pro-active efforts Master planning (versus a focus on sites) Zoning is a reactive tool. A need for pro-active measures beyond zoning. Pro-active policies, negotiation & engagement with the private sector Pro-active Urban Design and Infrastructure investments to enhance identity Partnerships to enable financing (e.g., parking) Design and infrastructure elements as linkages between individual sites Branding & identity marketing
 Design and infrastructure elements as linkages between individual sites Branding & identity marketing.")
Similar presentations


 Shall Rise Again – Just you Wait! 48 th ASU/Chase Economic Forecast>")


