Download presentation
Presentation is loading. Please wait.

1
GRADUATION PROJECT-1 SEMINAR- 2: Phases and Project 1 Guide Academic Year: 1433-1434 / 2012-2013 Semester I

2
1. Introduction for the categories and Applications types 2. Project 1 Guide 3. User requirements and System Specifications AGENDA 2

3
Applications designed for mobile devices. Rich client applications designed to run primarily on a client PC. Rich Internet applications designed to be deployed from the Internet, which support rich UI and media scenarios. Service applications designed to support communication between loosely coupled components. Web applications designed to run primarily on the server in fully connected scenarios. Introduction for the categories and Applications types 3

4
1. Explains tasks you need to work on so that you successfully complete your project 2. Lists the phases need to be completed by the end of this semester 3. Explains the sections to be included in the project documentations Project 1 Guide 4

5
User requirements and System Specifications 5

6
PROJECT-TEAM ASSIGNEMENT PROCEDURE 6 User Requirements and System Specifications Analysis Conceptual Model + Use Cases Analysis Conceptual Model + Use Cases Design Diagrams: Sequence diagrams and Class design diagrams Conclusion

7
Object-Oriented Software Engineering Visual OO Analysis and Design Practical Software Development http://www.site.uottawa.ca/school/research/lloseng/supportMaterial

8
OO Analysis and Design OO Analysis expresses Requirements and Specs expressed as Population of interacting objects of a system as opposed to The traditional data or functional views.

9
A View of the Two paradigms © Lethbridge/Laganière 2005Chapter 2: Review of Object Orientation9 See in Umple

10
OO vs Structured Analysis Structured Analysis (still in use today) Divide and Conquer - At the function level Object-Oriented Analysis (still growing) Partition - At the level of concepts (objects)
 Divide and Conquer - At the function level Object-Oriented Analysis (still growing) Partition - At the level of concepts (objects)")
11
Analysis vs Design Analysis stage: - focus on high-level specification that - Describes what the system is supposed to do. Design specification: - focus on how the system should be constructed to satisfy these requirements.

12
Types of Software Real time software E.g. control and monitoring systems Must react immediately Safety often a concern Data processing software Used to run businesses Accuracy and security of data are key Some software has both aspects

13
Requirements Document A system is a set of components that interact to solve a problem. System structure describes the systems objects and their interrelationships. System behavior describes how the system changes as its objects interact with one another. Every system has both structure and behaviordesigners must specify both.

14
Activities Common to Software Projects © Lethbridge/Laganière 2005Chapter 1: Software and Software Engineering14 Programming Quality assurance Reviews and inspections Testing Deployment Managing the process Modeling Creating representations of the domain or the software Use case modeling Structural modeling Dynamic and behavioral modeling

15
Activities Common to Software Projects Design Deciding how the requirements should be implemented, using the available technology Includes: Systems engineering: Deciding what should be in hardware and what in software Software architecture: Dividing the system into subsystems and deciding how the subsystems will interact Detailed design of the internals of a subsystem User interface design Design of databases

16
Modeling © Lethbridge/Laganière 2005Chapter 8: Modelling Interactions and Behaviour 16 1. Use Case -What are the domain processes ? Use Case Diagram, high-level/expande d, essential/real 2. Conceptual Model -What are the domain concepts, terms ? Class Diagram (conceptual), classes, associations, attributes 3. Sequence Diagram -What are the system events and operations ? Interaction Diagram -Sequence Diagram 4. Communication Diagrams -What do the system operations do ?
, classes, associations, attributes 3. Sequence Diagram -What are the system events and operations . Interaction Diagram -Sequence Diagram 4. Communication Diagrams -What do the system operations do .")
17
Use Cases Use case diagrams are the starting point for UML-based software development

18
Conceptual models Must identify: Concepts, objects in our system, Associations between concepts: is part of, contains, manages, is-a, … Attributes of concepts Should not contain design information; e.g. methods. Better to over specify then under specify Concepts v/s attributes: when in doubt make it a concept Specification/Description concept: when keeping records

20
Interaction diagrams Model the dynamic aspects of a software system Visualize how the system runs. Built from a use case and a class diagram. Show how a set of objects accomplish the required interactions with an actor.

21
Elements found in interaction diagrams © Lethbridge/Laganière 2005Chapter 8: Modelling Interactions and Behaviour 21 Instances of classes Shown as boxes with the class and object identifier underlined Actors Use the stick-person symbol as in use case diagrams Messages Shown as arrows from actor to object, or from object to object

22
Interactions and messages Show how a set of actors and objects communicate with each other to perform: The steps of a use case, or The steps of some other piece of functionality. The set of steps, taken together, is called an interaction. Can show several different types of communication. E.g. method calls, messages send over the network These are all referred to as messages.

23
Creating interaction diagrams © Lethbridge/Laganière 2005Chapter 8: Modelling Interactions and Behaviour 23 Needs a conceptual Model and a use case model before starting to create an interaction diagram. There are two kinds of interaction diagrams: Sequence diagrams Communication diagrams

24
Sequence diagrams © Lethbridge/Laganière 2005Chapter 8: Modelling Interactions and Behaviour 24 Shows the sequence of messages exchanged by the set of objects performing a certain task The objects are arranged horizontally across the diagram. An actor that initiates the interaction is often shown on the left. The vertical dimension represents time. A vertical line, called a lifeline, is attached to each object or actor. The lifeline becomes a broad box, called an activation box during the live activation period. A message is represented as an arrow between activation boxes of the sender and receiver. A message is labelled and can have an argument list and a return value.

25
Sequence diagrams 25

26
Communication diagrams © Lethbridge/Laganière 2005Chapter 8: Modelling Interactions and Behaviour 26 Communication diagrams emphasise how the objects collaborate in order to realize an interaction A communication diagram is a graph with the objects as the vertices. Communication links are added between objects Messages are attached to these links. Shown as arrows labelled with the message name Time ordering is indicated by prefixing the message with some numbering scheme.

27
Communication diagrams and patterns A communication diagram can be used to represent aspects of a design pattern Chapter 8: Modelling Interactions and Behaviour27

28
Sequence OR Communication diagram © Lethbridge/Laganière 2005Chapter 8: Modelling Interactions and Behaviour 28 Sequence diagrams Make explicit the time ordering of the interaction. Use cases make time ordering explicit too So sequence diagrams are a natural choice when you build an interaction model from a use case. Make it easy to add details to messages. Communication diagrams have less space for this

29
© Lethbridge/Laganière 2005Chapter 8: Modelling Interactions and Behaviour 29 Communication diagrams (Collaboration Diagrams) Can be seen as a projection of the class diagram Might be preferred when you are deriving an interaction diagram from a class diagram. Are also useful for validating class diagrams.

30
DFDs OR Activity Diagrams Squares representing external entities, which are sources or destinations of data. Rounded rectangles representing processes, which take data as input, do something to it, and output it. Arrows representing the data flows, which can either be electronic data or physical items. Open-ended rectangles representing data stores, including electronic stores such as databases or XML files and physical stores such as or filing cabinets or stacks of paper.

31
The DFD is an excellent communication tool for analysts to model processes and functional requirements Alone, however, it has limited usability. It is simple and easy to understand by users

32
Activity Diagrams © Lethbridge/Laganière 2005Chapter 8: Modelling Interactions and Behaviour 32 An activity diagram is like a transitions are caused by internal events, such as the completion of a computation. Can be used to understand the flow of work that an object or component performs. Can also be used to visualize the interrelation and interaction between different use cases. Is most often associated with several classes. One of the strengths of activity diagrams is the representation of concurrent activities.

33
Activity diagrams – an example © Lethbridge/Laganière 2005Chapter 8: Modelling Interactions and Behaviour 33

34
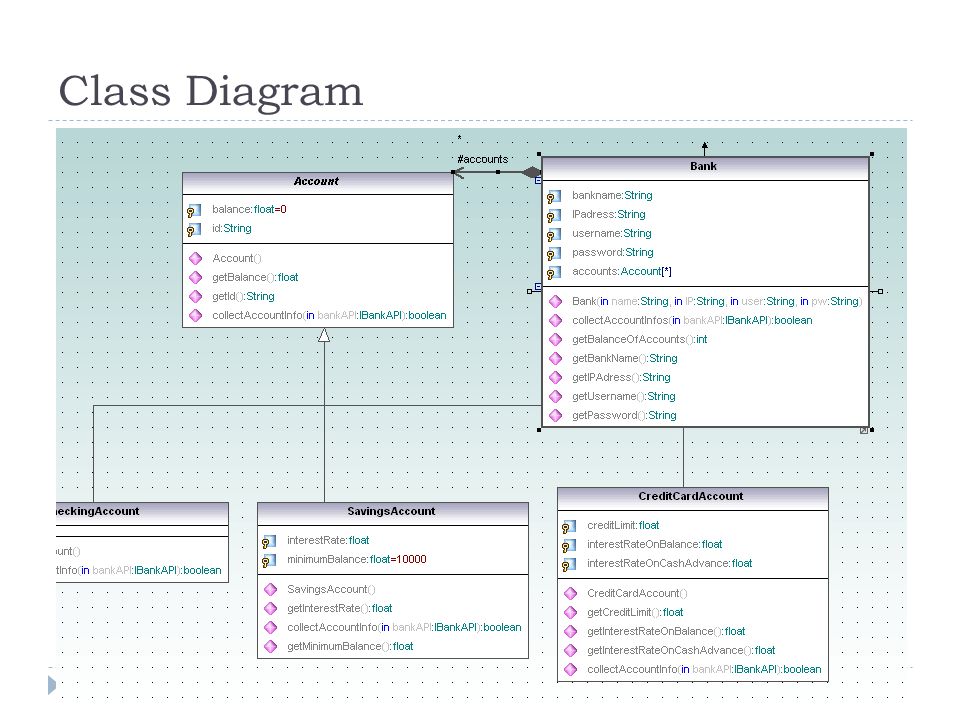
Class Diagram

36
Object Diagram

37
Packages and importing A package combines related classes into subsystems All the classes in a particular directory Classes in different packages can have the same name Although not recommended Importing a package is done as follows: import finance.banking.accounts.*;

38
Key Concepts Abstraction Object -> something in the world Class -> objects Superclass -> subclasses Operation -> methods Attributes and associations -> instance variables Modularity Code can be constructed entirely of classes Encapsulation Details can be hidden in classes This gives rise to information hiding: Programmers do not need to know all the details of a class

39
Thank you for your patience?!!!

40
Thank you.. Good Luck! Any Questions ? GRADUATION PROJECT-1 40

Similar presentations


 Presentation By - SANDEEP REDDY CHEEDEPUDI (Student No: 17037032) - VISHNU CHANDRADAS (Student.>")


