Download presentation
Presentation is loading. Please wait.

2
Understand the basic components of the STAAR assessment system Differentiate between STAAR and TAKS Know the STAAR graduation requirements Consider how STAAR will impact students this year and in the near future

3
TABS TEAMS TAASTAKS

4
Which state exports the least amount of crude oil monthly? A Louisiana B Texas C Alaska D Pennsylvania Grade level? A.Third grade B.Fourth grade C.Fifth grade

5
In 1990, tuition at Britton Pre-School was $300 per pupil. According to this graph, how much money was collected in 1990? A$9000 B$900 C$600 D$6000 Grade level? A.Fourth grade B.Fifth grade C.Sixth grade

6
What percent of the total solid waste was paper? A 33 % B 40 % C 66 % D 72 % The graph shows the types and amounts of solid waste produced in the United States in 1998. Grade level? A.Sixth grade B.Seventh grade C.Eighth grade

7
When making a circle graph, at what central angle should the sponsor use for the section representing the votes for the student who finished in third place? A 54 º B 72 º C 90 º D 126 º The student council sponsor is planning to make a circle graph showing the number of votes for each of the candidates for student council president. The table below indicates the name and the vote count for each candidate. Grade level? A.Ninth grade B.Tenth grade C.Eleventh grade

8
Which of the following is the correct description of the graph of a quadratic function given by f (x) = ax 2 + bx + c, a 0 ? A If b 2 – 4ac > 0 then the graph of the function intersects the x-axis twice. B If b 2 – 4ac < 0 then the graph of the function does not intersect the y-axis. C If b 2 – 4ac = 0 then the graph does not intersect the x-axis. D If (b 2 – 4ac) ½ < 0 then the graph does not intersect the x-axis. Grade level? A.Twelfth grade B.Undergraduate C.Masters
 ½ < 0 then the graph does not intersect the x-axis. Grade level. A.Twelfth grade B.Undergraduate C.Masters.")
9
Which state exports the least amount of crude oil monthly? A Louisiana B Texas C Alaska D Pennsylvania Grade level? TABS Grade 10 (1982)
.")
10
In 1990, tuition at Britton Pre-School was $300 per pupil. According to this graph, how much money was collected in 1990? A$9000 B$900 C$600 D$6000 Grade level? TEAMS Grade 10 (1986)
.")
11
What percent of the total solid waste was paper? A 33 % B 40 % C 66 % D 72 % The graph shows the types and amounts of solid waste produced in the United States in 1998. Grade level? TAAS Grade 10 (1999)
.")
12
When making a circle graph, at what central angle should the sponsor use for the section representing the votes for the student who finished in third place? A 54 º B 72 º C 90 º D 126 º The student council sponsor is planning to make a circle graph showing the number of votes for each of the candidates for student council president. The table below indicates the name and the vote count for each candidate. Grade level? TAKS Grade 11 (2002)
.")
13
TAKS Grade 3 (2009)
")
14
Grade level? Which of the following is the correct description of the graph of a quadratic function given by f (x) = ax 2 + bx + c, a 0 ? A If b 2 – 4ac > 0 then the graph of the function intersects the x-axis twice. B If b 2 – 4ac < 0 then the graph of the function does not intersect the y-axis. C If b 2 – 4ac = 0 then the graph does not intersect the x-axis. D If (b 2 – 4ac) ½ < 0 then the graph does not intersect the x-axis. STAAR Algebra II (2012??)
 = ax 2 + bx + c, a 0 . A If b 2 – 4ac > 0 then the graph of the function intersects the x-axis twice. B If b 2 – 4ac < 0 then the graph of the function does not intersect the y-axis. C If b 2 – 4ac = 0 then the graph does not intersect the x-axis. D If (b 2 – 4ac) ½ < 0 then the graph does not intersect the x-axis. STAAR Algebra II (2012 ).")
15
School Year2011 – 20122012 – 20132013 – 20142014 – 2015 Grades 3-9STAAR Grade 10TAKSSTAAR Grade 11TAKS STAAR Grade 12TAKS STAAR or TAKS

16
Greater rigor and depth Focus on college and career readiness Four-hour time limit Two days for ELA Performance tied to grades and diploma type

17
TAKS tests Grade-level tests. Example: Math Grade 9 Only exit-level (11 th grade) tests counted toward graduation STAAR End-of-Course (EOC) tests Course-specific tests. Example: Algebra I May take tests for up to 12 different courses Scores from all EOCs count toward graduation
 tests counted toward graduation STAAR End-of-Course (EOC) tests Course-specific tests. Example: Algebra I May take tests for up to 12 different courses Scores from all EOCs count toward graduation.")
18
ELAMathScienceSocial Studies English IAlgebra IBiologyWorld Geography English IIGeometryChemistryWorld History English IIIAlgebra IIPhysicsU S History

19
Level I: Unsatisfactory Level II: Satisfactory Level III: Advanced ReadinessSatisfactory Performance Passing Did not meet standard Met standard CommendedPassing standard Commended Performance TAKS STAAR

20
Test scores on all EOCs will count toward graduation. A cumulative score will be determined for each subject. A students scores in each subject area (ELA, Math, Science, Social Studies) must equal or exceed a minimum cumulative score in order to be eligible to graduate.
 must equal or exceed a minimum cumulative score in order to be eligible to graduate..")
21
Readiness Satisfactory Performance Passing Minimum Performance Three performance standards will be set for each EOC in February 2012 Minimum performance standard Satisfactory performance (passing) standard Readiness standard
 standard Readiness standard")
22
UnsatisfactorySatisfactoryAdvanced Readiness Satisfactory Performance Passing Grayarea Minimum Performance Student performance will fall into four categories Unsatisfactory Unsatisfactory gray area above minimum Satisfactory Advanced

23
UnsatisfactorySatisfactoryAdvancedGrayarea Minimum Performance Students scoring below the minimum standard May not count score toward the overall cumulative score Are required to retest Will receive accelerated instruction

24
UnsatisfactorySatisfactoryAdvanced Satisfactory Performance Passing Grayarea Minimum Performance Students scoring in the gray area between the minimum and satisfactory standards May count score toward the overall cumulative score May choose to retest May receive accelerated instruction

25
UnsatisfactorySatisfactoryAdvanced Satisfactory Performance Passing Grayarea Students scoring above the satisfactory standard May count the score toward the overall cumulative score May choose to retest Students meeting the satisfactory standard in Algebra II and English III may qualify for the recommended program Minimum Performance

26
UnsatisfactorySatisfactoryAdvanced Readiness Satisfactory Performance Passing Grayarea Minimum Performance Students meeting the readiness standard in Algebra II and English III may qualify for the Distinguished Achievement Program (DAP)
")
27
UnsatisfactorySatisfactoryAdvanced Readiness Satisfactory Performance Passing Grayarea Minimum Performance Suppose the state sets the following standards Minimum = 50 Satisfactory = 60 Readiness = 90 (Please keep in mind that this is an example and we do not know what the actual standards will be) 5050606090
")
28
UnsatisfactorySatisfactoryAdvanced Readiness Satisfactory Performance Passing Grayarea Minimum Performance In this case a student would need a cumulative score of 180 to meet the graduation requirement in a subject area (math) 60 points x 3 tests = 180 points 5050606090
 60 points x 3 tests = 180 points")
29
UnsatisfactorySatisfactoryAdvanced Readiness Satisfactory Performance Passing Grayarea Minimum Performance Suppose Johnny had these scores in math Algebra I – 50 points Geometry – 75 points Algebra II – 60 points Cumulative = 50 + 75 + 60 = 185 Since his overall score was greater than 180, Johnny met the requirements for graduation in math 5050606090

30
State law requirements Students will receive a final grade for courses with EOCs Performance on the EOC will count as 15% of the final grade

32
Students will receive a final grade for courses with EOCs Performance on the EOC will account for 15% of the final grade Only students with a passing final grade may receive credit for the course District policy regarding EOCs and grading is currently under revision pending further interpretation of the law by the Texas Education Agency

33
March 26-29, 2012 – English Language Arts One day for reading One day for writing May 7-18, 2012 – Math, Science, and Social Studies One day for each subject June 8, 2012– Results arrive for all tests

34
July 9-13, 2012 December 2012 May 2013

35
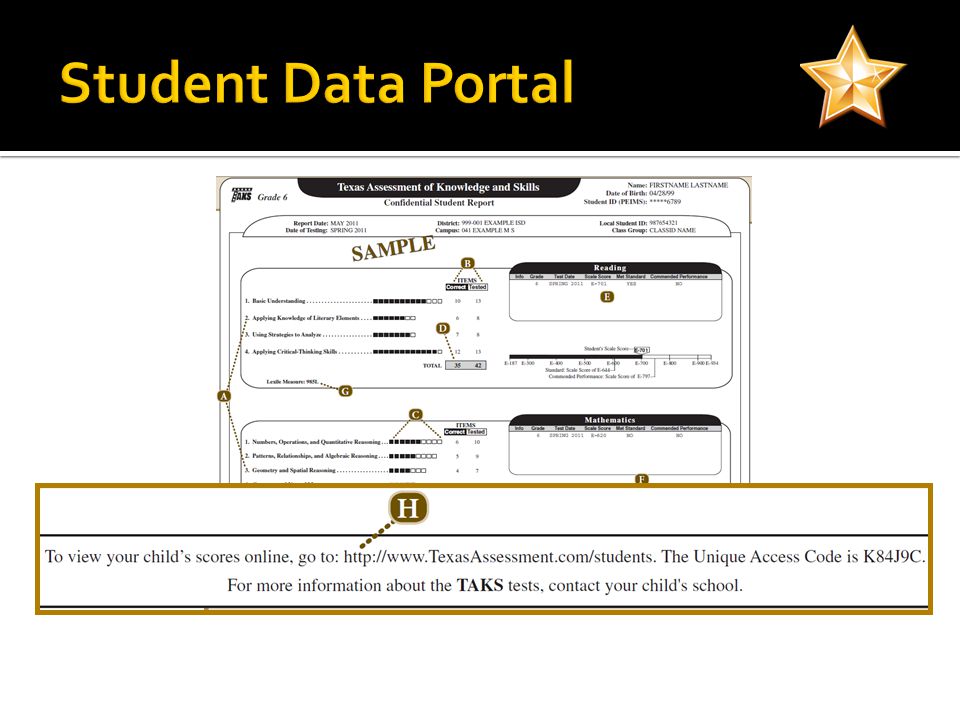
Due to the May testing window for EOCs, test results will not be available until June Final grades will likely be delayed for courses tested with EOCs Parents and students may access test results through the Student Data Portal using the access code provided on Confidential Student Reports at www.TexasAssessment.com/students www.TexasAssessment.com/students

37
EOCs will be administered in December, May and July EOC testing is required of students earning credit by examination, summer school and online coursework Students graduating under STAAR taking EOC courses prior to 2011-12 are not required to take the corresponding exams, but may choose to do so Modified and Alternate versions of STAAR are available for special education students for all tests excluding Algebra II, Chemistry and Physics

38
STAAR means increased rigor, depth, and complexity Grades 3-8 test in same subjects as TAKS High school grade-level tests replaced by EOCs EOC testing for graduation begins THIS YEAR for students in grade 9 and lower Most students will need to have an overall passing average score on 12 EOC tests to graduate EOC performance is now tied to grades, credits and diploma type

39
Birdville ISD Accountability Department 817-547-5891 www.birdvilleschools.net/accountability Texas Education Agency www.tea.state.tx.us/student.assessment/staar/

Similar presentations


 April 16, 2012.>")


 2012-13.>")


 assessment instruments in Algebra I, Algebra II, Geometry, Biology,>")


 Ervin Knezek John Fessenden>")

