Download presentation
Presentation is loading. Please wait.

1
Interpretation of Mass Spectra I
Beatrix Ueberheide February 27th 2018

2
The Mass Spectrum

3
Biological Mass Spectrometry
Proteolytic digestion Protein(s) Peptides Base Peak Chromatogram MS Time (min) 500 1000 1500 m/z Mass Spectrometer 200 600 1000 m/z MS/MS Database Search Manual Interpretation
 Peptides. Base Peak Chromatogram. MS. Time (min) m/z. Mass Spectrometer m/z. MS/MS. Database Search. Manual Interpretation.")
4
Peptide Sequencing using Mass Spectrometry
88 145 292 405 534 663 778 907 1020 1166 b ions K L E D F G S 1166 1080 1022 875 762 633 504 389 260 147 y ions 762 100 875 [M+2H]2+ % Relative Abundance 633 292 405 260 534 389 1022 504 663 907 1020 778 1080 250 500 750 1000 m/z

5
Peptide Sequencing using Mass Spectrometry
88 145 292 405 534 663 778 907 1020 1166 b ions K L E D F G S 1166 1080 1022 875 762 633 504 389 260 147 y ions 762 113 100 875 113 [M+2H]2+ % Relative Abundance 633 292 405 260 534 389 1022 504 663 907 1020 778 1080 250 500 750 1000 m/z

6
Peptide Sequencing using Mass Spectrometry
88 145 292 405 534 663 778 907 1020 1166 b ions K L E D F G S 1166 1080 1022 875 762 633 504 389 260 147 y ions 762 100 129 875 [M+2H]2+ 129 % Relative Abundance 633 292 405 260 534 389 1022 504 663 907 1020 778 1080 250 500 750 1000 m/z

7
Peptide Sequencing using Mass Spectrometry
88 145 292 405 534 663 778 907 1020 1166 b ions K L E D F G S 1166 1080 1022 875 762 633 504 389 260 147 y ions 762 100 129 875 [M+2H]2+ 129 % Relative Abundance 633 292 405 260 534 389 1022 504 663 907 1020 778 1080 250 500 750 1000 m/z

8
Searching Proteomics Data
GSFLYEYSRRHPEYAVSVLLRLAKEYEATLEECCAKDDPHACYSTVFDKLKHLVDEPQNLIKQNCDQFEKGEYGFQNALIVRYTRKVPQVSTPTLVEVSRSLGKVGTRCCTKPESERMPCTEDYLSLILNRLCVLHEKTPVSEKVTKCCTESLVNRRPCFSALTP Protein Digestion LFTFHADICTLPDTEK RPCFSALTPDETYVPK MPCTEDYLSLILNR VPQVSTPTLVEVSR DDPHACYSTVFDK Peptide Mass Measurement 500 1000 1500 m/z MS Peptide Fragmentation 200 600 1000 m/z MS/MS

9
Matching the data to the database

10
Matching the data to the database

11
Score alone can be misleading

12
Score alone can be misleading

13
And now to something practical…….

14
How to start sequencing
Know the charge of the peptide Calculate the [M+1H]+1 charge state of the peptide Know the sample treatment (i.e. alkylation, other derivatizations that could change the mass of amino acids) Know what enzyme was used for digestion Find and exclude non sequence type ions (i.e. unreacted precursor, neutral loss from the parent ion, neutral loss from fragment ions) Look for the biggest y or b ion in the spectrum. Try to find sequence ions by finding b/y pairs You usually can conclude you found the correct sequence if you can explain the major ions in a spectrum
 Know what enzyme was used for digestion. Find and exclude non sequence type ions (i.e. unreacted precursor, neutral loss from the parent ion, neutral loss from fragment ions) Look for the biggest y or b ion in the spectrum. Try to find sequence ions by finding b/y pairs. You usually can conclude you found the correct sequence if you can explain the major ions in a spectrum.")
15
Charge State = number of H+
M - molecular mass n - number of charges H – mass of a proton peptide of mass 898 carrying 1 H+ = ( ) / 1 = 899 m/z carrying 2 H+ = ( ) / 2 = 450 m/z carrying 3 H+ = ( ) / 3 = m/z
 / 1 = 899 m/z. carrying 2 H+ = ( ) / 2 = 450 m/z. carrying 3 H+ = ( ) / 3 = m/z.")
16
Common observed neutral losses and mass additions:
Ammonia -17 Water -18 Carbon Monoxide from b ions -28 Phosphoric acid from phosphorylated serine and threonine -98 Carbamidomethyl modification on cysteines upon alkylation with iodoacetamide +57 Oxidation of methionine +18 Calculate with nominal mass during sequencing, but use the monoisotopic masses to check if the sequence fits the parent mass fits. For high res. MS/MS check that the residue mass difference is correct.

17
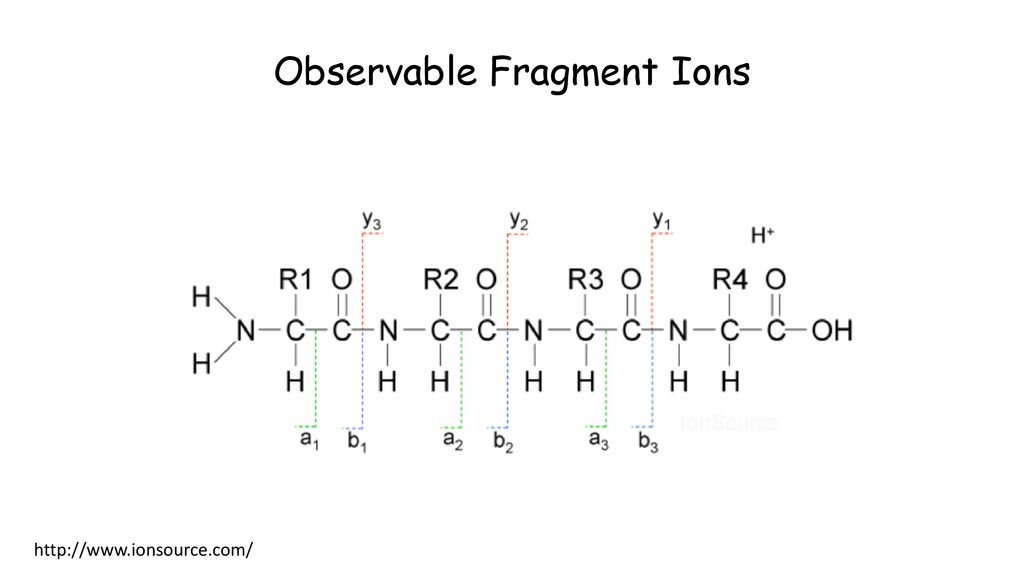
Observable Fragment Ions
18
What fragment ion type is it?

19
Accurate Mass of Amino Acids

20
Common PTMs

21
Immonium Ions

22
How to Sequence: CAD Residue Mass (RM)
The very first N- and C-terminal fragment ions are not just their corresponding residue masses. The peptides N or C-terminus has to be taken into account. b ion y ion b1 = RM + 1 y1 = RM + 19

23
Example of how to calculate theoretical fragment ions
88 159 290 387 500 629 803 S A M P L E R 803 716 645 514 417 304 175 Residue Mass The first b ion The first y ion

24
How to calculate theoretical fragment ions
RM+1 + RM + RM + RM + RM + RM +RM+18 88 159 290 387 500 629 803 S A M P L E R 803 716 645 514 417 304 175 + RM + RM + RM + RM + RM + RM RM+19 The first b ion The first y ion Residue Mass

25
Finding ‘pairs’ and ‘biggest’ ions: b ion
If trypsin was used for digestion, one can assume that the peptide terminates in K or R. Therefore the biggest observable b ion should be: Mass of peptide [M+H] (K) -18 Mass of peptide [M+H] (K) -18
 -18. Mass of peptide [M+H] (K) -18.")
26
Finding ‘pairs’ and ‘biggest’ ions: y ion
y ions are truncated peptides. Therefore subtract a residue mass from the parent ion [M+H] +1 . The highest possible ion could be at [M+H] (G) The lowest possible ion at [M+H] (W)
 The lowest possible ion at [M+H] (W)")
27
Finding ‘pairs’ and ‘biggest’ ions: pairs
H+ H+ b and y ion pairs: Complementary b and y ions should add up and result in the mass of the intact peptide, but since both b and y ion carry 1H+ the peptide mass will be by 1H+ too high therefore: (b (m/z) + y (m/z))-1H+ = [M+H] +1
 + y (m/z))-1H+ = [M+H] +1.")
28
TWEPEDVC(Carbamidomethyl)SFLENR
Spectrum Number 1 TWEPEDVC(Carbamidomethyl)SFLENR
SFLENR.")
29
Full Scan

30
Full Scan

35
-28

36
Immonium Ion of W -28

Similar presentations


 on the Q-ToF2>")

 BCbasics Systems Biology, Integrated Biology.>")


>")

>")


 Course Director David Fenyö Contact information>")

 Course Director David Fenyö Contact information>")


