Download presentation
Presentation is loading. Please wait.

1
Analytical Science A course (in 15 Chapters), developed as an Open Educational Resource, designed for use at 2nd year England & Wales undergraduate level and as a CPD training resource Author Brian W Woodget Owner Royal Society of Chemistry Title Chapter 7 – Gas chromatography (gc) and High Performance Liquid Chromatography (hplc) Classification F180, Analytical Chemistry Keywords ukoer, sfsoer, oer, open educational resources, metadata, analytical science, cpd training resource, analytical chemistry, measurement science, gc, gas-liquid chromatography, hplc, high-performance liquid chromatography Description This chapter covers the two important chromatographic techniques of ‘Gas Chromatography’ and ‘High Performance Liquid Chromatography’. A few of the images have some animation to enhance explanation. Creative Commons licence Language English File size 2.3 Mbytes File format Microsoft PowerPoint (1997 – 2003) 1 © Royal Society of Chemistry 2010 1
, developed as an Open Educational Resource, designed for use at 2nd year England & Wales undergraduate level and as a CPD training resource. parentId=hull%3A2199&type=1&start=10&pid=hull%3A2351. Author. Brian W Woodget. Owner. Royal Society of Chemistry. Title. Chapter 7 – Gas chromatography (gc) and High Performance Liquid Chromatography (hplc) Classification. F180, Analytical Chemistry. Keywords. ukoer, sfsoer, oer, open educational resources, metadata, analytical science, cpd training resource, analytical chemistry, measurement science, gc, gas-liquid chromatography, hplc, high-performance liquid chromatography. Description. This chapter covers the two important chromatographic techniques of ‘Gas Chromatography’ and ‘High Performance Liquid Chromatography’. A few of the images have some animation to enhance explanation. Creative Commons licence. Language. English. File size. 2.3 Mbytes. File format. Microsoft PowerPoint (1997 – 2003) 1. © Royal Society of Chemistry")
2
Chapter 7 – Gas Chromatography (gc) & High Performance Liquid Chromatography (hplc)
Contents

3
Gas chromatography Overview
In gas chromatography (gc) the mobile phase is a gas e.g. helium or nitrogen and the stationary phase is either a low volatility organic liquid or a porous solid. With an organic liquid as the stationary phase (e.g. a polyethylene glycol), the technique is referred to as gas-liquid chromatography (glc). The liquid can either be coated onto a solid support (eg: keiselguhr or a diatomaceous earth) and packed into a column (packed column glc), or more likely, bonded to the wall of a silica glass capillary (capillary column glc). Separation takes place via a partition mechanism and the technique is applicable for the separation and analysis of a wide range of organic substances. With a porous solid as the stationary phase (e.g. molecular sieve), the technique is referred to as gas-solid chromatography (gsc). The technique uses columns similar to packed column glc, but has application limited to the separation of low molecular weight hydrocarbons. The mechanism of separation is adsorption.. 3 3
 the mobile phase is a gas e.g. helium or nitrogen and. the stationary phase is either a low volatility organic liquid or a porous. solid. With an organic liquid as the stationary phase (e.g. a polyethylene glycol), the. technique is referred to as gas-liquid chromatography (glc). The liquid can. either be coated onto a solid support (eg: keiselguhr or a diatomaceous earth) and packed into a column (packed column glc), or more likely, bonded to the. wall of a silica glass capillary (capillary column glc). Separation takes place. via a partition mechanism and the technique is applicable for the separation. and analysis of a wide range of organic substances. With a porous solid as the stationary phase (e.g. molecular sieve), the. technique is referred to as gas-solid chromatography (gsc). The technique. uses columns similar to packed column glc, but has application limited to the. separation of low molecular weight hydrocarbons. The mechanism of. separation is adsorption")
4
Instrumentation - the gas chromatograph
Capillary column (a) (b) Figure 7.1 a) modern gas chromatograph b) gas chromatograph with the oven door open to reveal the capillary column. 4
 (b) Figure 7.1 a) modern gas chromatograph. b) gas chromatograph with the oven door open to reveal. the capillary column. 4.")
5
Figure 7.2 - Simplified diagram of a gas chromatograph
Gas flow controller Sample injection port Detector Read out Gas supply Column Thermostated oven Figure Simplified diagram of a gas chromatograph

6
A controlled gas supply, usually of helium, nitrogen or hydrogen;
A gas chromatograph as illustrated in figures (7.1) is a sophisticated instrument. Figure (7.2) shows that the gas chromatograph requires: A controlled gas supply, usually of helium, nitrogen or hydrogen; A separating column, coiled to fit into a thermostatically controlled oven; An injection port which enables liquid samples to be quickly vapourised upon injection; A sensitive detector at the other end of the column. When developing a gas chromatographic separation there are a number of factors that need to be considered: The boiling point range and nature (types of chemicals) of the analytes; The choice of stationary phase; The gas flow rate; The length of the column; The internal diameter of the column; The thickness of the stationary phase. 6 6
 is a sophisticated instrument. Figure (7.2) shows that the gas chromatograph requires: A controlled gas supply, usually of helium, nitrogen or hydrogen; A separating column, coiled to fit into a thermostatically controlled oven; An injection port which enables liquid samples to be quickly vapourised. upon injection; A sensitive detector at the other end of the column. When developing a gas chromatographic separation there are a number of factors that need to be considered: The boiling point range and nature (types of chemicals) of the analytes; The choice of stationary phase; The gas flow rate; The length of the column; The internal diameter of the column; The thickness of the stationary phase")
7
Mobile phases Elution is brought about by a flowing inert gas. In contrast to most types of chromatography the mobile phase does not interact with the analytes, hence it is often called the carrier gas because its only function is to transport the molecules through the column. Whichever gas is used it must be: Pure; Be compatible with the detector; Be oxygen free. At the temperatures used for analysis, the presence of oxygen in the flowing gas, causes degradation of the stationary phases and therefore shortens the life of columns. The preferred carrier gas is helium as it is readily available, gives short retention times and is not flammable. Its disadvantage is its cost. Hydrogen gives even shorter retention times but can react with analytes containing double bonds and there can be safety issues due to its flammability. Nitrogen is a cheap alternative but the retention times will be longer. 7 7 7

8
Figure 7.3 - Effect of mobile phase flow rate
Rate x1 Figure Effect of mobile phase flow rate Figure (7.3) illustrates that altering the flow rate of the carrier gas can seriously affect the retention and consequential separation of a mixture of analytes. With the higher flow rate the peaks are seen to be bunching together. A compromise position with this mixture would be somewhere the 1 and 10 times extremes. 8 8 8
 illustrates that altering the flow rate of the carrier gas can seriously. affect the retention and consequential separation of a mixture of analytes. With the. higher flow rate the peaks are seen to be bunching together. A compromise. position with this mixture would be somewhere the 1 and 10 times extremes")
9
The injection port The injection port is heated, typically in the range 100 – 300oC, so that the analyte solutions are instantly vapourised upon injection. Sample sizes of as little as a tenth of a microlitre are injected, using a syringe of the type shown in figure (7.4), through a self-sealing rubber septum. The sample is instantly vapourised and the mobile phase flowing through the injection port, sweeps the vapourised analytes on to the column. When using capillary columns, the injection ports also include a splitter. This is a device which allows only a small proportion of the vapourised sample to pass on to the separating column the remainder being vented to waste. It is assumed that a splitter will always introduce the same percentage of the samples injected onto the column and is required with capillary column technology so as to avoid overloading the column, which would have a serious effect on separation and peak shape. Figure 7.4 - photograph of a microlitre syringe used to inject samples manually into the gas chromatograph 9 9
, through a self-sealing rubber septum. The sample is instantly vapourised and the mobile phase flowing through the injection port, sweeps the vapourised analytes on to the column. When using capillary columns, the injection ports also include a splitter. This is a device which allows only a small proportion of the vapourised sample to pass on to the separating column the remainder being vented to waste. It is assumed that a splitter will always introduce the same percentage of the samples injected onto the column and is required with capillary column technology so as to avoid overloading the column, which would have a serious effect on separation and peak shape. Figure photograph of a microlitre syringe used to inject samples manually into the gas. chromatograph")
10
Oven temperature control
Oven temperature control is very important, as temperature is one of the variables which greatly influences the retention time of analytes. If temperature was not controlled and reproducible, it would be impossible to replicate analytical separations. This would mean that retention times obtained for sample solutions could not be compared with those obtained for standard solutions. Ovens have a low thermal mass to allow them to heat up and cool down as quickly as possible. Oven temperature should be controllable to within 0.1oC. Most modern ovens can operate from 30 – 400oC and can be programmed to heat up or cool down at 0.5 – 50oC/min. Note: Packed columns should not be heated at rates greater than 10oC/min as their thermal mass prevents them heating at faster rates. This would result in the column temperature lagging behind that of the oven, resulting in problems with experimental reproducibility. Continued on the next slide 10 10 10

11
of separations obtained using both isothermal and temperature
Gas chromatographs can be operated isothermally which means one selected temperature is used throughout a separation or temperature programmed whereby the temperature is increased throughout the analysis in accordance with a chosen set of conditions. An example of a typical temperature programme is given below: The fast second ramp is intended to clean the column of any sample residues before the next analysis. If all the analyte compounds boil within a narrow range, the oven should be set isothermally at a temperature slightly above the average boiling point. If the analytes have a broad boiling range then temperature programming will be needed. Figures (7.5 & 7.6) shown on the next slide are example chromatograms of separations obtained using both isothermal and temperature programme situations. 11 11
 shown on the next slide are example chromatograms. of separations obtained using both isothermal and temperature. programme situations")
12
Figure 7.5 - capillary gas chromatogram of a mixture of butanols
3 Figure capillary gas chromatogram of a mixture of butanols The chromatogram shown in figure (7.6) was obtained by using a temperature programme between C. Compounds detected were: 1.Propachlor; 2.Trifluralin; 3. α-HCH 4. Hexachlorobenzene 5. β-HCH; 6. γ-HCH; 7. δ-HCH; 8. Heptachlor; 9.Aldrin; 10. DCPA; 11. Heptachlor epoxide; 12. γ-chlordane 13. α-chlordane 14. Dieldrin; 15. p,p’-DDE 16. Endrin; 17. p,p’-DDD 18. Endrin aldehyde 19. Endosulpham sulphate 20. p,p’-DDT 4 2 Detector signal 1 The chromatogram shown in Figure (7.5) was obtained under isothermal conditions. The order of elution was: 1. tertiary butanol; 2. secondary butanol; 3. butan-2-ol; 4.butan-1-ol Injection point 1 2 3 Time/min Detector signal Solvent peak Time/min Figure capillary gas chromatogram of a mixture of chlorinated pesticides
 was. obtained by using a. temperature programme. between C. Compounds detected were: 1.Propachlor; 2.Trifluralin; 3. α-HCH. 4. Hexachlorobenzene. 5. β-HCH; 6. γ-HCH; 7. δ-HCH; 8. Heptachlor; 9.Aldrin; 10. DCPA; 11. Heptachlor epoxide; 12. γ-chlordane. 13. α-chlordane. 14. Dieldrin; 15. p,p’-DDE. 16. Endrin; 17. p,p’-DDD. 18. Endrin aldehyde. 19. Endosulpham sulphate. 20. p,p’-DDT Detector. signal. 1. The chromatogram shown in. Figure (7.5) was obtained under. isothermal conditions. The order. of elution was: 1. tertiary butanol; 2. secondary butanol; 3. butan-2-ol; 4.butan-1-ol. Injection point Time/min. Detector signal. Solvent peak. Time/min. Figure capillary gas chromatogram of a mixture of chlorinated pesticides.")
13
Gas chromatographic columns
There are two types of gc column - packed and capillary. Packed columns can be made of glass or steel tubing usually mm internal diameter and 1 – 10 metres in length. Packed columns are packed with a high surface area granular support material on which is coated the stationary phase. Typically a packed column has 300 – 3,000 plates per metre. (see chapter 6 of this teaching and learning programme) The support material is typically crushed firebrick, kieselguhr or diatomaceous earth, which all have high surface areas (>1m2/g). These can be coated with the liquid stationary phase to create the column packing. These packing materials are robust against mechanical breakdown and exist as small reasonably spherical particles which allow for even packing of the column. The smaller the particles the greater the pressure required to maintain the carrier gas flow rate, therefore in practise, particles sizes of 170 – 250 µm diameter are used. These will support 1 – 30% by weight of stationary phase. 13 13 13
 The support material is typically crushed firebrick, kieselguhr or diatomaceous. earth, which all have high surface areas (>1m2/g). These can be coated with. the liquid stationary phase to create the column packing. These packing. materials are robust against mechanical breakdown and exist as small. reasonably spherical particles which allow for even packing of the column. The smaller the particles the greater the pressure required to maintain the. carrier gas flow rate, therefore in practise, particles sizes of 170 – 250 µm. diameter are used. These will support 1 – 30% by weight of stationary phase")
14
Capillary columns are 0. 1 - 0. 5 mm internal diameter with a 0. 1 - 1
Capillary columns are mm internal diameter with a µm thick stationary phase layer and are 10 – 100 m in length. Capillary columns are made from silica glass tubing strengthened by an external coating of polyimide. Typically, capillary columns have more than 10,000 plates per metre. The advantage of capillary columns over packed columns, is that they give extremely good resolution and that peak broadening due to eddy diffusion is eliminated, as there are no particles in the column. The small sample sizes required (less than 0.1 µl), mean that the injection port must be fitted with a splitter. As the smallest injection needles are 1 µl the splitter allows excess sample solution to be vented to waste allowing only hundredths of a microlitre to pass on to the column. A split ratio of 50 or 100 : 1 would be normal allowing only 1 part in every hundred to pass onto the column. Figures (7.7) and (7.8) on the next two slides, show respectively, photographs of typical packed and capillary columns and comparison chromatograms for the separation of ethanol and propan-1-ol present in a dilute aqueous solution. 14 14
, mean that the injection port must be fitted with a splitter. As the smallest injection needles are 1 µl the splitter allows excess sample solution to be vented to waste allowing only hundredths of a microlitre to pass on to the column. A split ratio of 50 or 100 : 1 would be normal allowing only 1 part in every hundred to pass onto the column. Figures (7.7) and (7.8) on the next two slides, show respectively, photographs of typical packed and capillary columns and comparison chromatograms for the separation of ethanol and propan-1-ol present in a dilute aqueous solution")
15
Figure 7.7 a) a 3m long packed gc column
(b) Figure 7.7 a) a 3m long packed gc column b) a 30m long capillary gc column (the diameter of each coil is approximately 20 cm) 15
 Figure 7.7 a) a 3m long packed gc column. b) a 30m long capillary gc column. (the diameter of each coil is approximately 20 cm) 15.")
16
The chromatogram on the left shows the separation of ethanol
Propan-1-ol The chromatogram on the left shows the separation of ethanol and propan-1-ol on a 2 m long packed column. Note: the retention time and width of the peaks. Detector signal Retention time/min The chromatogram on the right shows the same analytes separated on a 25 m long capillary column. Note the shorter retention times and much sharper peaks. The sharper peaks mean that there is less possibility of peaks overlapping when capillary columns are used. Detector signal Propan-1-ol Ethanol Retention time/min

17
Column stationary phases
The stationary phase is a key component in gas chromatography, as there are very few mobile phases. It is by selecting an appropriate stationary phase that separation is achieved. Whether packed or capillary columns are being used, there are a number of desirable properties for a stationary phase. These are: Low volatility, a boiling point at least 100oC above the working temperature of the column Thermally stable Chemically inert Able to form a thin film Have solvent characteristics such that separation is achieved. Continued on the next slide 17 17

18
Table (7.1) below gives examples of the stationary phases used in gas
chromatographic separations. Table examples of commercial stationary phases for use in glc 18

19
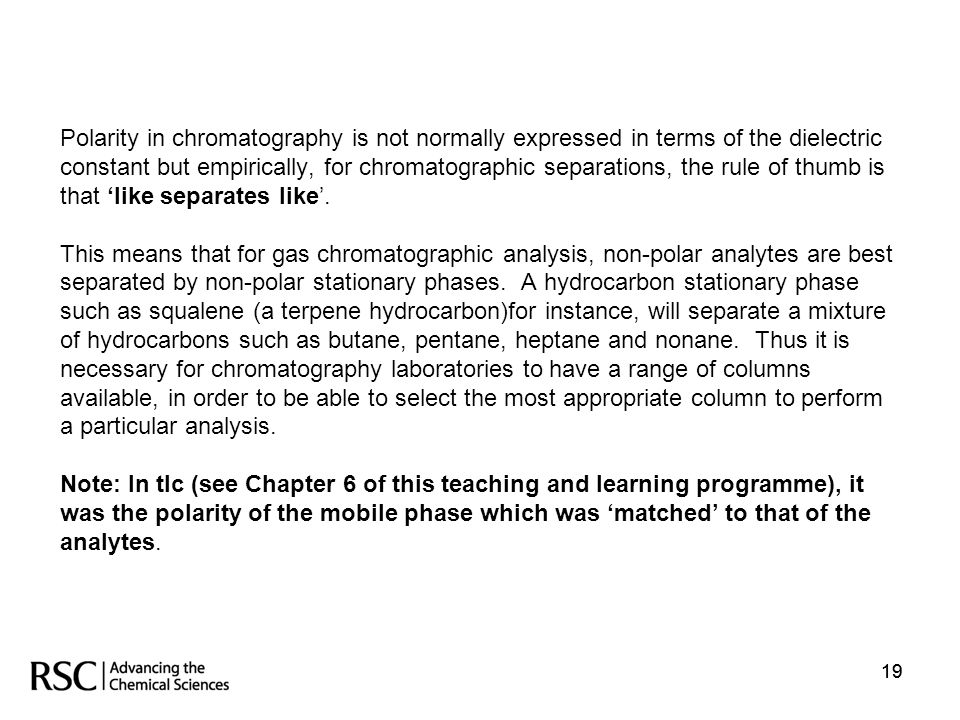
Polarity in chromatography is not normally expressed in terms of the dielectric constant but empirically, for chromatographic separations, the rule of thumb is that ‘like separates like’. This means that for gas chromatographic analysis, non-polar analytes are best separated by non-polar stationary phases. A hydrocarbon stationary phase such as squalene (a terpene hydrocarbon)for instance, will separate a mixture of hydrocarbons such as butane, pentane, heptane and nonane. Thus it is necessary for chromatography laboratories to have a range of columns available, in order to be able to select the most appropriate column to perform a particular analysis. Note: In tlc (see Chapter 6 of this teaching and learning programme), it was the polarity of the mobile phase which was ‘matched’ to that of the analytes. 19 19
20
Gas Chromatographic detectors
The characteristics of the ideal detector are: Adequate sensitivity Good stability Wide linear response range Short response time Working temp. range of ambient – 400oC High reliability Similarity of response to all analytes Non-destructive The next two slides, consider in more depth, these characteristics of an ideal detector Unfortunately, no detector has all these characteristics. For example, the Flame Ionisation detector is very sensitive and is capable of detecting nanogram quantities of analytes, however it is also destructive. 20 20 20

21
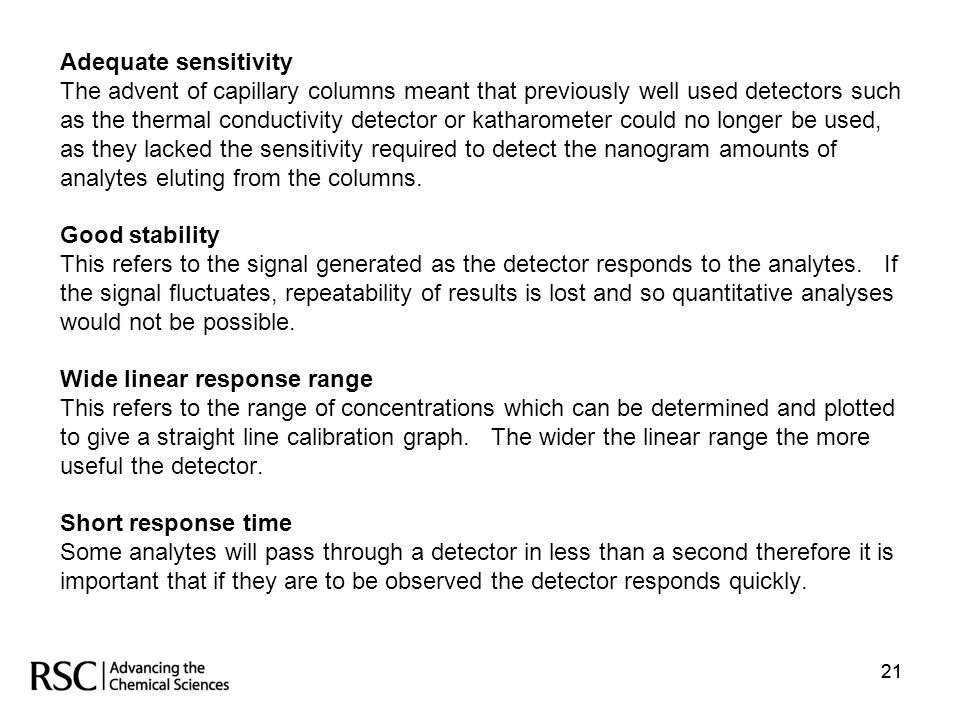
Adequate sensitivity The advent of capillary columns meant that previously well used detectors such as the thermal conductivity detector or katharometer could no longer be used, as they lacked the sensitivity required to detect the nanogram amounts of analytes eluting from the columns. Good stability This refers to the signal generated as the detector responds to the analytes. If the signal fluctuates, repeatability of results is lost and so quantitative analyses would not be possible. Wide linear response range This refers to the range of concentrations which can be determined and plotted to give a straight line calibration graph. The wider the linear range the more useful the detector. Short response time Some analytes will pass through a detector in less than a second therefore it is important that if they are to be observed the detector responds quickly. 21 21 21
22
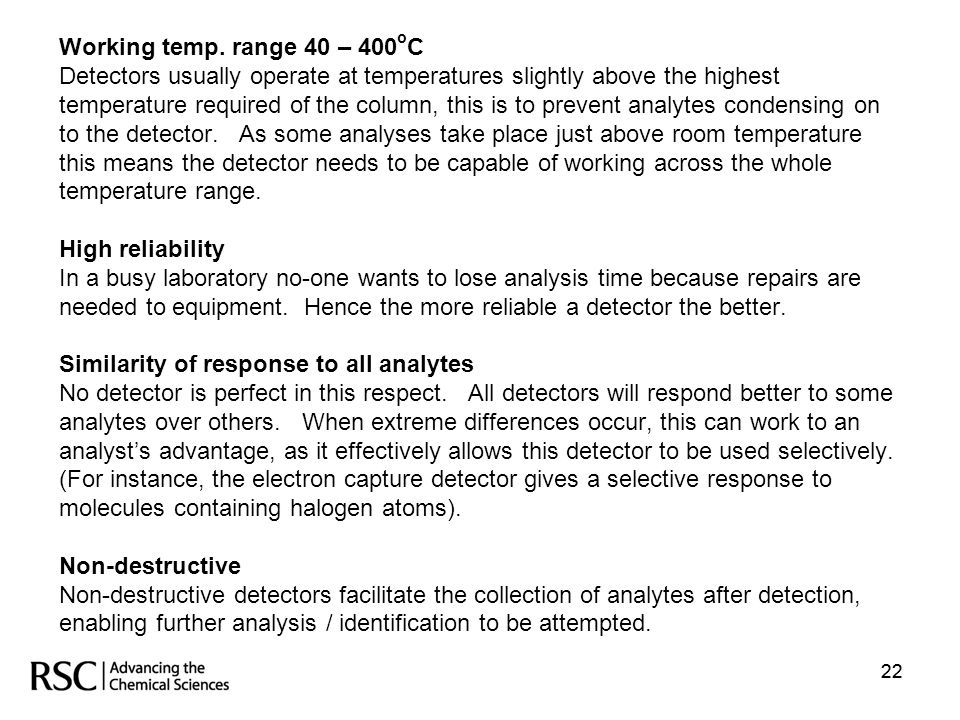
Working temp. range 40 – 400oC Detectors usually operate at temperatures slightly above the highest temperature required of the column, this is to prevent analytes condensing on to the detector. As some analyses take place just above room temperature this means the detector needs to be capable of working across the whole temperature range. High reliability In a busy laboratory no-one wants to lose analysis time because repairs are needed to equipment. Hence the more reliable a detector the better. Similarity of response to all analytes No detector is perfect in this respect. All detectors will respond better to some analytes over others. When extreme differences occur, this can work to an analyst’s advantage, as it effectively allows this detector to be used selectively. (For instance, the electron capture detector gives a selective response to molecules containing halogen atoms). Non-destructive Non-destructive detectors facilitate the collection of analytes after detection, enabling further analysis / identification to be attempted. 22 22
23
The flame ionisation detector
The flame ionisation detector (fid) illustrated in figure (7.9), is one of the most popular gas chromatographic detectors. The mobile phase from the end of the column is directed through a flame where the organic analytes are burnt. As they burn they produce ions which are collected by the collector electrode, this results in a current which can be amplified and plotted against retention time to give a typical chromatographic peak. The fid is a very sensitive detector suitable for use with capillary columns. Figure schematic diagram of a flame ionisation detector 23 23 23
 illustrated in figure (7.9), is one of the most popular gas chromatographic detectors. The mobile phase from the end of the column is directed through a flame where the organic analytes are burnt. As they burn they produce ions which are collected by the collector electrode, this results in a current which can be amplified and plotted against retention time to give a typical chromatographic peak. The fid is a very sensitive detector suitable for use with capillary columns. Figure schematic diagram of a flame. ionisation detector")
24
The mass spectrometer as a detector
Ion Source Eluate from the column is directed into the ion source where the analytes become ionised fragments. The magnetic field generated in the mass analyzer, deflects these ions along curved paths into the ion detector. By altering the strength of the magnetic field , ions of varying mass:charge ratios are deflected into the detector. A plot of the abundance of these mass:charge ratios is called a mass spectrum. Interpretation of a mass spectrum (the plural is spectra) allows the analyte to be identified. A typical gc-ms is shown in figure (7.11) on the next slide Accelerating voltage Poles of the magnet Ion beam Deflection of ions according to their mass:charge ratio Detector Exit slit Mass analyser Figure schematic of a mass spectrometric detector Continued on the next 4 slides
 allows the analyte to be identified. A typical gc-ms is shown in figure (7.11) on the next slide. Accelerating. voltage. Poles of. the magnet. Ion beam. Deflection of ions. according to their. mass:charge ratio. Detector. Exit slit. Mass analyser. Figure schematic of a mass. spectrometric detector. Continued on the next 4 slides.")
25
Figure 7.11 - typical gc-ms Gas chromatograph Quadrupole
mass spectrometer Figure typical gc-ms Please refer to Chapter 13 of this teaching & learning package for explanation of quadrupole mass spectroscopy

26
In addition the mass spectrum of substances eluting over short time
When the mass spectrometry detector is set to detect all the ions deflected into it, the plot of the results looks very like a normal chromatogram, because the ‘total ion current’ is the detector response plotted against time as shown in figure (7.12). In addition the mass spectrum of substances eluting over short time intervals (eg: 30 sec) can be scanned for identification purposes – figure (7.13) Signal Limonene Mass spectrum of peak at 6.33 min Time Figure total ion chromatogram of an essential oil Figure 7.13 – chromatogram and mass spectrum of 4-bromofluorobenzene Time in min 26
. In addition the mass spectrum of. substances eluting over short time. intervals (eg: 30 sec) can be scanned. for identification purposes – figure (7.13) Signal. Limonene. Mass spectrum of peak. at 6.33 min. Time. Figure total ion chromatogram of an. essential oil. Figure 7.13 – chromatogram and. mass spectrum of 4-bromofluorobenzene. Time in min. 26.")
27
ion current plot which looks very like a chromatogram from any other
The main advantage of the mass spectroscopic detector is that it allows molecules to be characterised. But this is not the only advantage, as mass detectors can be used in one of three modes: Universal mode - allows the detector to detect all ions. This gives a total ion current plot which looks very like a chromatogram from any other ‘universal’ detector. Selective mode - the detector only records the current from ions with a pre-selected mass:charge ratio. This allows small peaks to be enhanced as other peaks are effectively ignored. Multiple ion monitoring - in between the extremes of monitoring all ions or only one. Selective and multiple ion monitoring are particularly useful when analysing samples that contain low levels of the analyte(s) of interest, in the presence of more abundant matrix components. Such samples could arise from environmental monitoring, the investigation of natural products, or the analysis of drug metabolites in body fluids. These advantages are coupled with a mass spectrometer’s sensitivity, allowing analytes at ppb concentrations to be routinely detected. 27 27
 of interest, in the presence of more abundant matrix components. Such samples could arise from environmental monitoring, the investigation of natural products, or the analysis of drug metabolites in body fluids. These advantages are coupled with a mass spectrometer’s sensitivity, allowing analytes at ppb concentrations to be routinely detected")
28
Comparison of the fid and the ms detectors
Without doubt, the flame ionisation and the mass spectrometry detectors, are the two most popular universal detectors in use today for routine gas chromatographic analysis. Both of these detectors are very sensitive and robust, however both destroy the substances being detected. The mass spectrometer has the advantage over the flame ionisation detector, in that it can characterise the analytes whilst detecting them. The fid is simpler to use and requires less maintenance. Selective detectors Despite their sensitivity there are occasions when other detectors give even better results. Two examples of selective detectors are: The flame photometric detector which is primarily used to detect sulphur, phosphorus and heavy metal containing analytes at nanogram levels; The electron capture detector which detects elements which can capture electrons. Detects analytes for example containing halogens, nitro groups or peroxides, whilst being insensitive to alcohols, amines and hydrocarbons. 28 28

29
Gas chromatographic - applications
The very good resolving power of capillary columns means that complex mixtures can be analysed. For example: Environmental pollutants in water and air samples; 400+ volatiles have been detected in wine samples; Forensic analysis of urine and blood samples for drug residues. The main disadvantage of gas chromatography, is that analytes need to be volatile. Some non-volatile analytes, can be converted however, to produce volatile derivatives by chemical derivatisation. An example of this is the analysis of triglycerides which are broken down into gylcerol and fatty acids, the fatty acids are themselves difficult to analyse by gas chromatography because of their relatively high polarity, so they are further derivatised to volatile methyl esters which can be separated in a reasonable time and give well shaped chromatographic peaks. 29 29

30
that can result from this form of chemical derivitisation
Example (7.i) - chemical derivitisation Vegetable oils, which are mixtures of triglycerides, can undergo chemical reaction to produce eventually, methyl esters of long-chain fatty acids. The reactions involved are described briefly below and may be used to identify vegetable oils from different sources Vegetable oil + (NaOH in methanol) Glycerol + (Na salts of fatty acids) Solution of methyl esters in heptane Methyl esters of fatty acids Acidify with HCl followed by reaction with methylating agent Solvent extract with n-heptane Separate & analyse by glc Figures (7.14) & (7.15) shown on the next slide, are examples of chromatograms that can result from this form of chemical derivitisation 30 30
 - chemical derivitisation. Vegetable oils, which are mixtures of triglycerides, can undergo chemical reaction to. produce eventually, methyl esters of long-chain fatty acids. The reactions involved are. described briefly below and may be used to identify vegetable oils from different sources. Vegetable oil + (NaOH in methanol) Glycerol + (Na salts of fatty acids) Solution of methyl esters in heptane Methyl esters of fatty acids. Acidify with HCl. followed by reaction. with methylating agent. Solvent extract. with n-heptane. Separate & analyse by glc. Figures (7.14) & (7.15) shown on the next slide, are examples of chromatograms. that can result from this form of chemical derivitisation")
31
Figure 7.14 Figure 7.14 Figure 7.15 31 Note: although both chromatograms were obtained using the same stationary phase, different temperature programmes were employed so the retention times are not relatable

32
High performance liquid chromatography
High performance liquid chromatography (hplc), uses a liquid mobile phase pumped at high pressure through a packed column usually containing a bonded stationary phase. [see Chapter 6 of this teaching and learning programme for a description of bonded phases] As with tlc there are many combinations of solvents which can be used as the mobile phase. Where possible aqueous based mobile phases are used, as this facilitates easier disposal of waste solvent following chromatographic analysis. The choice of stationary phase is more limited, octadecylsilane (known as C18 bonded phase) columns being the most popular. A diagrammatic representation of the essential components of a typical hplc chromatographs together with photographs of a modern instrument are shown in figures (7.16/7/8) shown on the next three slides. 32 32
, uses a liquid mobile phase pumped at high pressure through a packed column usually containing a bonded stationary phase. [see Chapter 6 of this teaching and learning programme for a description of bonded phases] As with tlc there are many combinations of solvents which can be used as the mobile phase. Where possible aqueous based mobile phases are used, as this facilitates easier disposal of waste solvent following chromatographic analysis. The choice of stationary phase is more limited, octadecylsilane (known as C18 bonded phase) columns being the most popular. A diagrammatic representation of the essential components of a typical hplc. chromatographs together with photographs of a modern instrument are shown in. figures (7.16/7/8) shown on the next three slides")
33
Figure 7.16 - block diagram of an hplc chromatograph
33

34
The hplc chromatograph
Figure photograph of modern hplc with controlling pc 34 34

35
Figure 7.18 - photograph of a modern hplc chromatograph indicating
Injection port Detector Pump and flow control Solvent reservoir Figure photograph of a modern hplc chromatograph indicating the main visible parts (the column is in the unit behind the injection port) 35 35
")
36
Hplc mobile phases In hplc, the mobile phase is critical to the success of a separation. Mobile phases can be organic solvents, water or buffers. There is such a wide choice of solvent combinations that the best an analyst can do is narrow down the types of solvents to use and then determine the best mixture by trial and error. The desirable properties for all mobile phase are: High purity Readily available A boiling point 20 – 50oC above the column temperature Low viscosity Low reactivity Compatibility with the detector Continued on the next slide 36 36

37
Modern instruments can be programmed
All mobile phases should be free of air bubbles and suspended particles and in order to achieve this, modern instruments contain filters and degassing units. The same mobile phase can be used throughout a chromatographic separation – termed an isocratic analysis, OR two (or more) different mobile phases can be combined together and the relative amounts of each altered according to a predetermined programme throughout the separation - termed a gradient elution analysis. Modern instruments can be programmed with a number of changes in mobile phase composition during an analysis, however the simplest gradient elution is to linearly increase one mobile phase (B) as the second (A) decreases, see figure (7.19). Time Figure Graph showing the different types of solvent gradient 37 37
 different mobile phases can be combined together and the relative amounts of each altered according to a predetermined programme throughout the separation - termed a gradient elution analysis. Modern instruments can be programmed. with a number of changes in mobile phase composition during an analysis, however the simplest gradient elution is to linearly increase one mobile phase (B) as the second (A) decreases, see figure (7.19). Time. Figure Graph showing the different. types of solvent gradient")
38
Hplc sample inlet In hplc, samples are injected as solution and unlike gas chromatography, there is no need to vapourise the samples as soon as it is deposited onto the column. A fixed volume sample loop is generally used with loop sizes varying from 5 – 100 µl. When using such a sample loop, the loop is filled or loaded using a syringe, with excess going to waste (care must be taken not to introduce air bubbles into the system at this stage). The loop is then turned (manually or automatically) to the inject position; in this position the loop is between the pump and the column so the mobile phase is directed through the loop flushing out the sample solution and carrying it on to the column. In figure (7.20), shown on the next slide, the position of the loop has been highlighted in red. 38 38
. The loop is then turned (manually or automatically) to the inject position; in this position the loop is between the pump and the column so the mobile phase is directed through the loop flushing out the sample solution and carrying it on to the column. In figure (7.20), shown on the next slide, the position of the loop has been highlighted in red")
39
To waste Load loop From pump To column
Figure diagram of a fixed volume sample loop. The red bar shows how turning the valve redirects the mobile phase flow. 39 39 39

40
Figure 7.21 - photograph of a typical
Auto-sampler An alternative method of injecting solutions onto a chromatographic column is to use an auto-sampler. The chromatographic auto-sampler consists of a carousel in which sample vials are placed in numbered slots. It is possible to programme the auto-sampler to take various volumes of the solutions in the vials and inject them into the chromatograph where they will be separated according to an allocated method. The advantage of using an auto-sampler is that it can be left unattended, e.g. overnight, to inject 100 or more solutions. Sample carousel Figure photograph of a typical hplc auto-sampler 40

41
End fittings to connect to high pressure liquid supply
Hplc columns Most columns are made from stainless steel - 6 mm id and up to 30 cm in length and are packed with bonded phase silica. With silica based stationary phase, the pH of the mobile phase must be restricted to between 2 – 8, as lower than 2 breaks the bond between the bonded phase and the silica and greater than 8, will cause the silica to start to dissolve. A typical column is shown in figure (7.22): Recently, cross-linked bonded phases have been developed. These are better able to withstand high pressures (up to 12,000 psi compared to 3000 psi for normal hplc.) and so have led to the development of ultra performance liquid chromatography (uplc). The use of higher pressures results in shorter retention times and faster analyses. In addition, because smaller columns are used, improved resolution and sensitivity are also obtained. 30 cm hplc column Figure 7.22 – typical hplc column End fittings to connect to high pressure liquid supply 41 41 41
: Recently, cross-linked bonded phases have been developed. These are better able to withstand high pressures (up to 12,000 psi compared to 3000 psi for normal hplc.) and so have led to the development of ultra performance liquid chromatography (uplc). The use of higher pressures results in shorter retention times and faster analyses. In addition, because smaller columns are used, improved resolution and sensitivity are also obtained. 30 cm hplc column. Figure 7.22 – typical hplc. column. End fittings to connect to high pressure liquid supply")
42
Figure 7.23 – comparison of particle diameter and
In the three chromatograms illustrated as ‘A’, ‘B’ and ‘C’ in figure (7.23): N is the number of plates/m; dP is the average particle diameter; Rs is the resolution Decreasing the particle diameter from 10 to 5 µm improves the resolution. Staying with the smaller particle size but shortening the length of the column, reduces the separation efficiency but halves the analysis time. Note: Uplc columns use particle diameters of around 2 µm. B C Figure 7.23 – comparison of particle diameter and column length on hplc separation 42 42
: N is the number of plates/m; dP is the average particle diameter; Rs is the resolution. Decreasing the particle diameter from. 10 to 5 µm improves the resolution. Staying with the smaller particle size. but shortening the length of the. column, reduces the separation. efficiency but halves the analysis time. Note: Uplc columns use particle. diameters of around 2 µm. B. C. Figure 7.23 – comparison of particle diameter and. column length on hplc separation")
43
Table (7.2) - Comparison of normal and reversed phase hplc
Although the application of reversed phase technologies using bonded stationary phases are the most important in modern hplc, there are a few occasions when normal phase systems are employed. Table (7.2) below compares The essential properties of normal and reversed phase chromatographic systems. Table (7.2) - Comparison of normal and reversed phase hplc 43 43
 below compares. The essential properties of normal and reversed phase chromatographic systems. Table (7.2) - Comparison of normal and reversed phase hplc")
44
Hplc detectors The ideal characteristics of detectors for use in hplc are similar to those described in gas chromatography. [see slide ]. There are two types of hplc detector: Bulk property - e.g. refractive index detectors Solute property – e.g. ultraviolet/visible absorbance detector; mass spectrometry detector; fluorescence detector, electrochemical detector. The most popular detectors are those highlighted above. There are two types of UV/visible detectors: Fixed wavelength detectors which measures the absorbance of eluents passing through the detector at predetermined wavelengths Photo-diode array detectors (PDA) that allow a complete absorbance spectrum of the eluent to be plotted for each substance eluted. Figures (7.24/5) show the layout of a typical hplc flow cell and a photo-diode array detector. Figure (7.26) is a photograph of an hplc equipped with a mass spectrometry detector 44 44 44
 that allow a complete absorbance. spectrum of the eluent to be plotted for each substance eluted. Figures (7.24/5) show the layout of a typical hplc flow cell and a photo-diode array detector. Figure (7.26) is a photograph of an hplc equipped with a mass. spectrometry detector")
45
Hplc flow cell and fixed wavelength UV detector
A chromatographic column has a comparatively short internal diameter therefore if a light source was placed one side of the column and the detector the other, the pathlength (L) would also be short leading to low sensitivity. To address this problem a flow cell [figure (7.24)] is used in order to increase the pathlength through which the light travels and thereby increasing the sensitivity of the detector. Pathlength of cell Figure diagram of a flow cell 45 45 45
 would also. be short leading to low sensitivity. To address this problem a flow cell. [figure (7.24)] is used in order to increase. the pathlength through which the light. travels and thereby increasing the. sensitivity of the detector. Pathlength of cell. Figure diagram of a flow cell")
46
The UV photo-diode array detector
An ultraviolet-visible (UV) detector works by shining light through the mobile phase as it leaves the chromatographic column. Assuming the mobile phase itself is non-absorbing, any light absorbed is due to the analyte. The amount of light absorbed can be used to determine the concentration of an analyte against calibration data. There are two types of UV detector, those that measure one or two single wavelengths and those which can record a complete UV spectrum the latter is known as a photo-diode array or PDA detector. A schematic diagram of a PDA detector is shown in figure (7.25) Figure Schematic of photo-diode array detector 46 46 46
 detector works. by shining light through the mobile phase. as it leaves the chromatographic column. Assuming the mobile phase itself is. non-absorbing, any light absorbed is due to. the analyte. The amount of light absorbed. can be used to determine the concentration. of an analyte against calibration data. There are two types of UV detector, those. that measure one or two single wavelengths. and those which can record a complete UV. spectrum the latter is known as a photo-diode. array or PDA detector. A schematic diagram. of a PDA detector is shown in figure (7.25) Figure Schematic of photo-diode array detector")
47
The nature of the analyte and its molar absorptivity (K);
The quantity of light absorbed, given by the absorbance (A), depends on three factors: The nature of the analyte and its molar absorptivity (K); The pathlength or thickness of solution the light shines through (L) The concentration of the analyte solution (C) These three factors can be combined using the Beer-Lambert law: A = KCL [See Chapter 10 of this teaching and learning programme for further explanation on this topic] In an hplc detector the absorbance is converted into an electrical signal which is then plotted to give the chromatogram. Note: Although both of these detectors may be used for quantitative analysis, the diode array detector offers the advantage of being able to generate an absorbance spectrum which can then be used for identification purposes or in the case of pharmaceutical analysis, to confirm an identity. 47 47
, depends on three factors: The nature of the analyte and its molar absorptivity (K); The pathlength or thickness of solution the light shines through (L) The concentration of the analyte solution (C) These three factors can be combined using the Beer-Lambert law: A = KCL [See Chapter 10 of this teaching and learning programme for further explanation on this topic] In an hplc detector the absorbance is converted into an electrical signal which is then plotted to give the chromatogram. Note: Although both of these detectors may be used for quantitative analysis, the diode array detector offers the advantage of being able to generate an absorbance spectrum which can then be used for identification purposes or in the case of pharmaceutical analysis, to confirm an identity")
48
Connection between hplc & MS
Mass spectrometric detector Increasingly, mass spectrometers are being used as hplc detectors. These have the same advantages and characteristics as when they are used as detectors in gas chromatographic analysis, - being able to provide both qualitative and quantitative information. Mass spectrometers work under high vacuum conditions, so the biggest problem, is coupling an hplc which uses solvents pumped under pressure, with this vacuum. This technical difficulty, delayed the use of mass spectrometers as hplc detectors and is still partially reflected in the greater cost of hplc-ms systems compared to gc-ms instrumentation. A typical hplc/ms is shown in figure (7.26). Connection between hplc & MS Mass spectrometer hplc Figure typical hplc/ms instrumentation Read out 48
. Connection between hplc & MS. Mass spectrometer. hplc. Figure typical hplc/ms. instrumentation. Read out. 48.")
49
Evaporative light scattering detector (ELSD)
This is a relatively new hplc detector. The column eluent is passed into a nebuliser where it is converted into a fine mist, this mist is carried into a temperature controlled drift tube where the mobile phase evaporates leaving behind a cloud of analyte particles which then pass through a laser beam and scatter the radiation. It is this scattered radiation which is measured. The advantage of this detector is that it can be used for analytes which do not absorb UV light, such as sugars, and it is significantly more sensitive than refractive index detectors. The main disadvantage is that the mobile phase needs to be volatile. 49

50
Hplc –method development
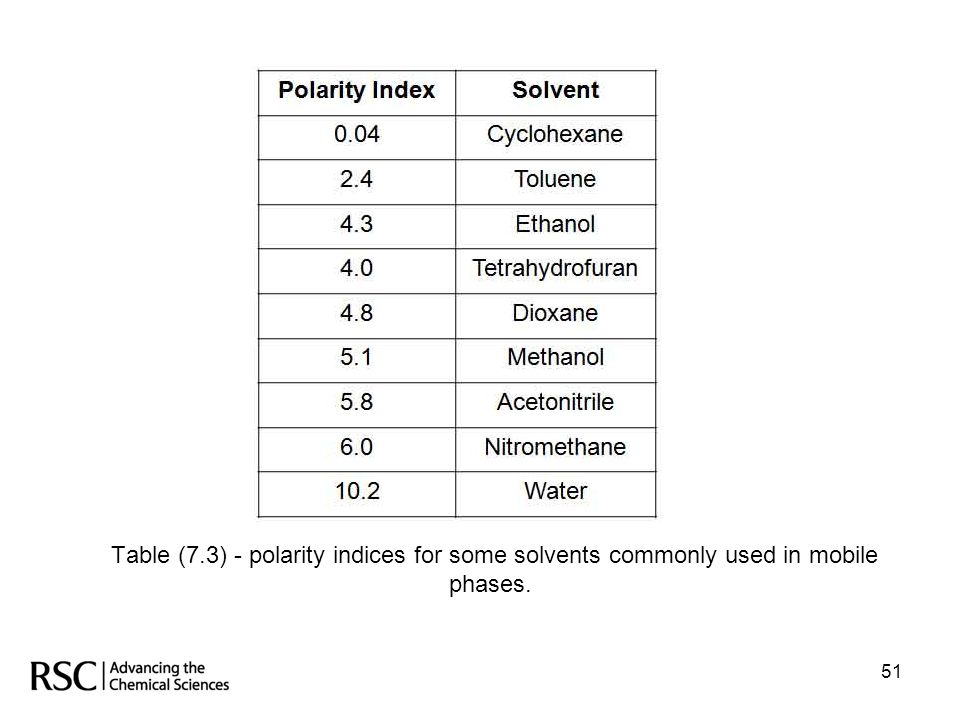
Successful chromatography with interactive mobile phases requires a proper balance of the intermolecular forces among the three active participants: The stationary phase The mobile phase The analyte . The intermolecular forces for the solvents can be described in terms of relative polarity. Each solvent can be given a polarity index which can then be used to calculate the relative polarity of solvent mixes and hence an indication of the retention times which will be obtained for the analytes. Table (7.3) on the next slide gives polarity indices for some common solvents frequently used as mobile phases. 50 50
 on the next slide gives polarity indices for some common solvents frequently used as mobile phases")
51
Table (7.3) - polarity indices for some solvents commonly used in mobile phases.
51 51
52
Mobile phase selection
Ideally the capacity factor, k’ should be 2 – 5 [see slide 42 in chapter 6 of this teaching and learning programme] k’ can be altered by altering the composition of the mobile phase where P’ is the polarity index for the appropriate solvent and f is the fraction of the solvents ‘A’ and ‘B’ For a reversed phase procedure where k’1 is the capacity factor value obtained for the first analysis and k’2 is the capacity factor required in a second analysis. Equation (7.1) Equation (7.2) Example (7.ii) on the next slide, illustrates this type of calculation 52 52
 Equation (7.2) Example (7.ii) on the next slide, illustrates this type of calculation")
53
a k’ value of 4 - ie in the range 2 – 5?
Example (7.ii) A mobile phase composition of 60% methanol and 40% of water is giving a k’ value of 12 for a particular analyte. What mobile phase composition is required to give a k’ value of 4 - ie in the range 2 – 5? Substituting into equation (7.1) on the previous slide the polarity for the 60% methanol 40% water mobile phase is given by A k’ value of 4 is required so equation (7.2) on the previous slide becomes From equation (7.1), and as Thus: And: Which means a mobile phase composed of 78% methanol and therefore 22% water will give a k’ value of 4 for this particular analyte. = 7.14 = P2’ 53 53
 A mobile phase composition of 60% methanol and 40% of water is giving a. k’ value of 12 for a particular analyte. What mobile phase composition is required to give. a k’ value of 4 - ie in the range 2 – 5 Substituting into equation (7.1) on the previous slide the polarity for the 60% methanol 40% water mobile phase is given by. A k’ value of 4 is required so equation (7.2) on the previous slide becomes. From equation (7.1), and as. Thus: And: Which means a mobile phase composed of 78% methanol and therefore. 22% water will give a k’ value of 4 for this particular analyte. = = P2’")
54
Hplc applications Quantification of pharmaceutical products;
Determination of food additives; Determination of herbicide and pesticide residues; Analysis of clinical samples. In some instances the analytes are unable to be detected at the sensitivity level required, and thus derivatisation of the analyte is required either before or after the separation is achieved. 54

55
Chromatographic Derivatisation
To enable a successful analysis by hplc, as with gas chromatography (see slides ) it is sometimes necessary to derivatise, or chemically change an analyte. There are a number of reasons why derivatisation may take place: To facilitate separation of an analyte; To increase the detector response of analytes. Derivatisation can take place before a sample is injected into the chromatograph, this is referred to as pre-column derivatisation and often takes place away from the instrument . Alternatively the derivatisation can take place post-column and pre-detector; this requires an adaptation of the instrumentation to place a derivatisation reactor to be placed between the column and the detector, and is referred to as on-line derivatisation. Whichever technique is used the analyte undergoes a chemical reaction which alters one or more of its properties, for example an analyte could be reacted with a reagent such as picric acid, the intention being that the product of the reaction has a greater ability to absorb UV/visible radiation and therefore be detectable. Continued on the next slide 55 55
 it is sometimes necessary to derivatise, or chemically change an analyte. There are a number of reasons why derivatisation may take place: To facilitate separation of an analyte; To increase the detector response of analytes. Derivatisation can take place before a sample is injected into the chromatograph, this is referred to as pre-column derivatisation and often takes place away from the instrument . Alternatively the derivatisation can take place post-column and pre-detector; this requires an adaptation of the instrumentation to place a derivatisation reactor to be placed between the column and the detector, and is referred to as on-line derivatisation. Whichever technique is used the analyte undergoes a chemical reaction which alters one or more of its properties, for example an analyte could be reacted with a reagent such as picric acid, the intention being that the product of the reaction has a greater ability to absorb UV/visible radiation and therefore be detectable. Continued on the next slide")
56
Facilitating separation To facilitate separation, derivatisation must be done before the sample is injected. This is because the structure of the analyte is being altered so that it interacts with the stationary and mobile phases in a different way with the intention of changing its retention time. An example would be the derivatisation of fatty acids, these compounds are so strongly retained on some gc columns that they are ‘never seen again’, however derivatisation to their methyl esters enables them to be separated and quantified. Increasing the detector response of analytes This can be done pre- or post- column. However if done pre-column it must be remembered that it is very likely that the chromatographic conditions will have to change to ensure separation is still achieved. Ideally if it is necessary to increase the detector response of an analyte, derivatisation will take place in a post-column reactor. The separated analytes flow from the column into the reactor, derivatisation takes place and the derivatised analytes flow into the detector. A simple example of this type of derivatisation is for the therapeutic barbiturates, this class of compounds is easily separated in their unionised form but the ionised form (conjugate base) has the better UV absorbance, hence mixing with borate buffer (pH 10) in a post column reactor enhances the detector response. 56

57
Advantages and disadvantages of derivatisation
Table 7.4 – comparison of derivatisation procedures With the increasing availability of UV absorbance detectors which can monitor more than one wavelength, (i.e. computer programming of the detector enables each analyte to be detected at its optimum wavelength) and mass spectrometric detectors, the need to derivatise analytes is diminishing. 57
 and mass spectrometric detectors, the need to derivatise analytes is diminishing. 57.")
58
Figure 7.27 - photograph of an hplc
Fraction collector A fraction collector consists of a rack of test tubes or sample vials into which mobile phase containing separated analytes is dispensed after passing through a non-destructive detector. The dispensing tube can be programmed to dispense each analyte into a different tube or to dispense timed segments of eluate. Such collectors are of limited use when using analytical hplc columns into which microlitre aliquots are injected but can be useful with semi-preparative scale separations which use columns capable of separating 1 cm3 injection volumes. The larger injection volume means that the amount of analyte collected is large enough for further analysis or chemical reactions. Figure photograph of an hplc fraction collector 58

59
Chromatography - qualitative analysis
As stated in Chapter 6 of this teaching and learning programme, the term ‘Chromatography’ refers to methods used to separate analytes and unless a mass spectrometric or nuclear magnetic resonance or infra-red detector is used, the analytes measured by the detector are not characterised. However, having separated the analytes, it is necessary to know what they are, in order that they can then be quantified against standard substances. In most chromatographic techniques, comparative methods are employed to provide this qualitative information. These methods do not provide definitive identification, but when coupled with other information about the solution being separated, they can give a very strong indication of an analyte’s identity. There are three main comparative methods: Peak coincidence; Spiking; Relative retention. 59 59

60
Peak coincidence Spiking
In this method, the retention time of the analyte is compared with the retention time of an authenticated standard compound which has been subjected to exactly the same chromatographic conditions. This is the method most likely to lead to misidentification especially if little is known about the analysis solution. Separating the analyte and standard compounds under a second set of chromatographic conditions (including use of a different pair of phases) and comparing the retention times a second time, reduces the possibility of a misidentification. Spiking In this method, after the initial analysis, a known standard is added to a portion of the analysis solution which is then analysed for a second time. If a peak of interest has increased in size, this is indicative that the analyte giving rise to that peak, has the same identity as the standard. Again the robustness of the method is improved by repeating both separations using a second set of chromatographic conditions, for example using a different temperature programme or stationary phase in the case of glc or different mobile phase in the case of hplc. 60
 and comparing the retention times a second time, reduces the possibility of a misidentification. Spiking. In this method, after the initial analysis, a known standard is added to a portion. of the analysis solution which is then analysed for a second time. If a peak of. interest has increased in size, this is indicative that the analyte giving rise to. that peak, has the same identity as the standard. Again the robustness of the. method is improved by repeating both separations using a second set of. chromatographic conditions, for example using a different temperature. programme or stationary phase in the case of glc or different mobile phase in. the case of hplc. 60.")
61
Relative retention As the name suggests, the retention of the analyte is reported relative to the retention of another compound. This could be a standard deliberately added to the sample solution or it could be another analyte present in the sample solution. The advantage of using relative retentions is that any changes in the experimental conditions which lead to a change in the absolute retention values do not have such a noticeable affect on the relative retentions, see the next slide. The relative retention ratio (RRR) is given by equation (7.3) below and an example of its usage is shown on the next slide retention time of the analyte RRR = retention time of a reference compound Note: Kovats index is also a relative retention system which uses linear alkanes for the standards, however discussion of this system is outside the scope of the programme. A short presentation on this topic can be found at: Note: strictly, the two retention measurement referred to in this equation for RRR, should not be measured from the time of injection, but from the retention time for an unretained substance. See slide 37 in chapter 6 of this teaching and learning programme. 61
 is given by. equation (7.3) below and an example of its. usage is shown on the next slide. retention time of the analyte. RRR = retention time of a reference compound. Note: Kovats index is also a relative retention system which uses linear alkanes for the standards, however discussion of this system is outside the scope of the programme. A short presentation on this topic can be found at: Note: strictly, the two retention. measurement referred to in this. equation for RRR, should not. be measured from the time of. injection, but from the retention. time for an unretained substance. See slide 37 in chapter 6 of this. teaching and learning programme. 61.")
62
Example (7.iii) – Relative retention ratios
62

63
Chromatography – quantitative analysis
Gas chromatography - B hplc - A Why the difference? Peak area Peak area concentration concentration Figure the lack of peak area correlation in gas chromatographic analysis Continued on the next slide 63 63

64
The area under a chromatographic peak is directly related to the concentration of the analyte giving rise to that peak, in accordance to the equation: A = kVC Where: A is the peak area k is a proportionality constant (detector sensitivity to solute) V is the volume of sample injected onto the column C is the concentration of the analyte injected Because hplc uses fixed volume loop injectors V can be assumed to be constant and hence the calibration shown in figure (7.28A). However with gc, when using manual injection, V is likely to be variable, and thus a calibration is likely to be obtained which has a lower coefficient of variation [figure (7.28B)] and which inevitably gives rise to analytical results with increased levels of measurement uncertainty. In order to overcome this, the method of internal standards is employed. [please refer to Chapter 4 of this teaching and learning programme] Note: although some gas chromatographic systems employ automatic injection, which provides a better precision of injection than manual systems, when using capillary columns the sample is ‘split’ so that only a fraction of the sample injected is actually separated and analysed. Because of the potential variability of this splitting process, the use of internal standards is still recommended. 64 64
 V is the volume of sample injected onto the column. C is the concentration of the analyte injected. Because hplc uses fixed volume loop injectors V can be assumed to be constant and hence the calibration shown in figure (7.28A). However with gc, when using manual injection, V is likely to be variable, and thus a calibration is likely to be obtained which has a lower coefficient of variation [figure (7.28B)] and which inevitably gives rise to analytical results with increased levels of measurement uncertainty. In order to overcome this, the method of internal standards is employed. [please refer to Chapter 4 of this teaching and learning programme] Note: although some gas chromatographic systems employ automatic injection, which provides a better precision of injection than manual systems, when using capillary columns the sample is ‘split’ so that only a fraction of the sample injected is actually separated and analysed. Because of the potential variability of this splitting process, the use of internal standards is still recommended")
65
Use of internal standards in gas chromatography
Figure the problem of a variable volume being injected, following manual injection. 65

66
For the analyte: AA = kAVACA Equation (7.4)
On the previous slide there were two components in the solution injected. One component was the analyte the other the internal standard. An internal standard is recommended for gas chromatographic analysis, in order to produce acceptable levels of precision and accuracy. The area under each peak can be represented mathematically as: For the analyte: AA = kAVACA Equation (7.4) For the internal standard: AIS = kISVISCIS Equation (7.5) As the internal standard and the analyte are both present in the same aliquot injected, then: VA = VIS Ratioing the two peak areas gives: AA kA. VA. CA kA. CA CA = = = K AIS kIS. VIS. CIS kIS. CIS CIS Thus the ratio of the peak areas is proportional to the ratio of the two concentrations as illustrated in figure (7.29) on the previous slide. By keeping the concentration of the internal standard constant: AA/AIS = K/ CA Equation (7.7) Equation (7.6) Continued on the next slide 66 66
 For the internal standard: AIS = kISVISCIS Equation (7.5) As the internal standard and the analyte are both present in the same aliquot injected, then: VA = VIS. Ratioing the two peak areas gives: AA kA. VA. CA kA. CA CA. = = = K. AIS kIS. VIS. CIS kIS. CIS CIS. Thus the ratio of the peak areas is proportional to the ratio of the two concentrations as illustrated in figure (7.29) on the previous slide. By keeping the concentration of the internal standard constant: AA/AIS = K/ CA Equation (7.7) Equation (7.6) Continued on the next slide")
67
Figure 7.30 - calibration graph using multiple internal standards
In the graph shown in figure (7.30), four solutions have been prepared containing variable known concentrations of the analyte, together with a fixed concentration of the internal standard. AA/AIS Slope of the graph – K/ CA Figure calibration graph using multiple internal standards 67
, four. solutions have been prepared containing. variable known concentrations of the. analyte, together with a fixed concentration. of the internal standard. AA/AIS. Slope of the graph – K/ CA. Figure calibration graph using multiple internal standards. 67.")
68
Example (7.iv) - Determination of trace organic solvents in an aqueous effluent
An aqueous effluent is known to contain small quantities of both acetone (dimethyl ketone) and methyl-ethyl ketone (MEK). Ethanol, which separates chromatographically from both of these analytes on the chosen column is selected as the internal standard. To a set of five 100 cm3 calibrated flasks, is added about 50 cm3 of pure water together with increasing amounts of both acetone and MEK. The quantities added are shown on the table below To each flask is then added 0.50 cm3 of pure Ethanol. All flasks are then diluted to volume with further water. To a further flask is added about 90 cm3 of the effluent sample, to which is added 0.50 cm3 of pure ethanol. The flask Is filled to volume with additional effluent sample. Each solution is then analysed by gas-liquid chromatography with the peaks due to acetone, MEK and ethanol all being measured. All results are tabulated below. Calculate the concentration of the two ketones in the effluent sample. Table (7.5) Calculation is continued on the next slide Note: this calculation is a copy of example (4.xxii) shown in Chapter 4 of this teaching & learning programme
 and methyl-ethyl. ketone (MEK). Ethanol, which separates chromatographically from both of these analytes on the chosen. column is selected as the internal standard. To a set of five 100 cm3 calibrated flasks, is added about 50 cm3 of pure water together with increasing. amounts of both acetone and MEK. The quantities added are shown on the table below To each flask is. then added 0.50 cm3 of pure Ethanol. All flasks are then diluted to volume with further water. To a further. flask is added about 90 cm3 of the effluent sample, to which is added 0.50 cm3 of pure ethanol. The flask. Is filled to volume with additional effluent sample. Each solution is then analysed by gas-liquid. chromatography with the peaks due to acetone, MEK and ethanol all being measured. All results are. tabulated below. Calculate the concentration of the two ketones in the effluent sample. Table (7.5) Calculation is continued on the next slide. Note: this calculation is a copy of example (4.xxii) shown in Chapter 4 of this teaching & learning programme.")
69
Note: calculation is completed on the next slide
From equation (7.7) it can be seen that the ratio of peak areas from the table of results has to be calculated before graphs can be plotted. This calculation and the subsequent graphs are shown below: Table (7.6) Figure (7.31) Figure (7.32) 69 69 69 69 69 Note: calculation is completed on the next slide
 it can be seen that the ratio of peak areas from the table of results has to be. calculated before graphs can be plotted. This calculation and the subsequent graphs are shown below: Table (7.6) Figure (7.31) Figure (7.32) Note: calculation is completed on the next slide.")
70
It must be miscible with the sample solution;
When using the internal standard method, the choice of internal standard is crucial: It must be miscible with the sample solution; It must be chromatographically separable from all other components in the sample; It should elute from the chromatographic column close to the analyte(s). Note: As illustrated in example (7.iv), a single internal standard can be used to measure a number of analytes in a sample matrix 70
. Note: As illustrated in example (7.iv), a single internal standard can be used to. measure a number of analytes in a sample matrix. 70.")
71
Area normalisation Retention time (min) Peak area Percentage area
As well as the chromatogram itself most chromatographic results include a table of results with column headings such as those below. As has been seen, the retention time is indicative of an analytes identity and the peak area is used to obtain quantitative results. The last column, percentage area, is an example of area normalisation. At its simplest, area normalisation is the peak area for the analyte of interest divided by the sum of the peak areas for all the peaks on the chromatgram and the answer expressed as a percentage. Retention time (min) Peak area Percentage area This quantitative method is only applicable, when all of the separated components of the sample, have equal detector sensitivities, for instance if all were aliphatic hydrocarbons. 71
 Peak area. Percentage area. This quantitative method is only applicable, when all of the separated. components of the sample, have equal detector sensitivities, for instance. if all were aliphatic hydrocarbons. 71.")
72
Reflection Chromatography is a separation technique
Separation is achieved by an analyte partitioning itself between two phases, a stationary and a mobile phase. The longer an analyte remains in/on the stationary phase the longer its retention time Retention times are used to ‘identify’ the analyte by comparison with standards. The only way to characterise an analyte is to use chromatography in conjunction with mass spectrometry or nuclear magnetic resonance. The rate theory explains why various experimental variables affect the results obtained. It is possible to obtain qualitative and quantitative results. 72 72

73
Question 7.1 Label the following statements true or false?
(a) Chromatography is always a method of characterising analytes; (b) Chromatography is a method of separation; (c) An internal standard is required when performing quantitative analysis by hplc; (d) The photodiode array detector is non-destructive; (e) Infinity is one of the modes of chromatography. Question 7.2 Fill in the blanks in the following sentences: Chromatography is a method of 1._____________________ which relies on two phases, called the 2.___________________ and the 3.__________________ phase. In its simplest form chromatography can be performed using a piece of paper however most chromatographic analyses are done using a sophisticated instrument called a 4.____________________; the plot of the detector response versus time is called a 5.____________________.
 Chromatography is always a method of characterising analytes; (b) Chromatography is a method of separation; (c) An internal standard is required when performing quantitative analysis by hplc; (d) The photodiode array detector is non-destructive; (e) Infinity is one of the modes of chromatography. Question 7.2 Fill in the blanks in the following sentences: Chromatography is a method of 1._____________________ which relies on two phases, called the 2.___________________ and the 3.__________________ phase. In its simplest. form chromatography can be performed using a piece of paper however most chromatographic. analyses are done using a sophisticated instrument called a 4.____________________; the. plot of the detector response versus time is called a 5.____________________.")
74
Question 7.3 Gas chromatography was used to monitor the blood plasma concentration of a drug. A standard solution was prepared containing 50 µg/cm3 of an internal standard and 25 µg/cm3 of the drug. When analysed this solution gave peak areas of 357 area counts and 197 area counts respectively. A second solution was prepared from 0.5 cm3 plasma made up to 1.0 cm3 in which the internal standard concentration was 25 µg/cm3. Chromatographic analysis of this solution gave a peak area of 162 area counts for the internal standard and 105 area counts for the drug. What was the concentration of the drug in the plasma sample? Question 7.4 Gas chromatography was used to determine the amount of the herbicide, thiobencarb, in dried vegetation. Thiobencarb was extracted from 160 g of dried vegetation (assume 100% extraction efficiency) an internal standard solution added to give mg of internal standard and the total extract volume made up to 25 cm3 with a suitable solvent. When analysed this solution gave a peak area of 550 area counts for the herbicide and 7,015 area counts for the internal standard. A second solution containing 0.2 mg/dm3 of internal standard and 0.4 mg/dm3 of thiobencarb was also analysed, this gave peak areas of 1,800 and 2,016 respectively. What was the concentration of thiobencarb in the dried vegetation, express the answer as µg/kg Question 7.5 A reversed phase hplc method using a mobile phase made up of 30% acetonitrile and 70% water is giving a capacity factor of 15 for a particular analyte. What mobile phase composition will give a capacity factor of 3 ie within the acceptable range of 2 – 5?
 an internal standard solution added to give mg of internal standard and the total extract volume made up to 25 cm3 with a suitable solvent. When analysed this solution gave a peak area of 550 area counts for the herbicide and 7,015 area counts for the internal standard. A second solution containing 0.2 mg/dm3 of internal standard and 0.4 mg/dm3 of thiobencarb was also analysed, this gave peak areas of 1,800 and 2,016 respectively. What was the concentration of thiobencarb in the dried vegetation, express the answer as µg/kg. Question 7.5 A reversed phase hplc method using a mobile phase made up of 30% acetonitrile and 70% water is giving a capacity factor of 15 for a particular analyte. What mobile phase composition will give a capacity factor of 3 ie within the acceptable range of 2 – 5")
75
Question 7.6 Use the information given in the table below to calculate the area normalisation percentages for each analyte. Retention time (min) Peak area (µv.min) Percentage area 1.2 (analyte A) 12,000 2.4 (analyte B) 20,000 3.0 (analyte C) 18,000 3.3 (analyte D) 30,000
 Peak area (µv.min) Percentage area. 1.2 (analyte A) 12, (analyte B) 20, (analyte C) 18, (analyte D) 30,000.")
76
Question 7.7 Use the information given in the table below to calculate the area normalisation percentages for each analyte. Retention time (min) Peak area (µv.min) Relative response factor 1.8 (analyte X) 8,000 2.5(analyte Y) 14,000 3.1 (analyte Z) 20,000 HINT: The first table shows the results for a standard mixture containing equal amounts of each analyte. These results need to be used to calculate the relative response factor for each analyte (relative to Y). These factors and the peak areas in the second table are then used to calculate the compensated peak area for each analyte in the analysis solution. It is these compensated areas that are then used to calculate the percentage composition of the analysis solution. Retention time (min) Peak area (µv.min) Percentage area 1.8(analyte X) 20,000 2.5 (analyte Y) 16,000 3.1 (analyte Z) 18,000
 Peak area (µv.min) Relative response factor. 1.8 (analyte X) 8, (analyte Y) 14, (analyte Z) 20,000. HINT: The first table shows the results for a standard mixture containing equal amounts of each analyte. These results need to be used to calculate the relative response factor for each analyte (relative to Y). These factors and the peak areas in the second table are then used to calculate the compensated peak area for each analyte in the analysis solution. It is these compensated areas that are then used to calculate the percentage composition of the analysis solution. Retention time (min) Peak area (µv.min) Percentage area. 1.8(analyte X) 20, (analyte Y) 16, (analyte Z) 18,000.")
77
Question number 7.1 (a) False, Chromatography is a separation technique only when a characterising detector such as a mass spectrometer is used, does it become a characterising technique as well. Most of the detectors give limited information about the nature of the separated analytes, the exceptions being the mass spectrometer and nmr spectrometer detectors. (b) True, see answer to (a). (c) False, an internal standard is required for quantitative gc analysis not hplc. However this does not mean that internal standards are not used with hplc; if lengthy sample preparation is required the use of an internal standard may be used to determine the efficacy of the preparation procedures. (d) True, see slides Most hplc detectors are non-destructive hence it is possible to collect the eluates after separation see slide 58. (e) False, affinity is a mode of chromatography, see slides 27 – 31 in Chapter 6 of this teaching and learning programme.
 False, Chromatography is a separation technique only when a characterising detector such as a mass spectrometer is used, does it become a characterising technique as well. Most of the detectors give limited information about the nature of the separated analytes, the exceptions being the mass spectrometer and nmr spectrometer detectors. (b) True, see answer to (a). (c) False, an internal standard is required for quantitative gc analysis not hplc. However this does not mean that internal standards are not used with hplc; if lengthy sample preparation is required the use of an internal standard may be used to determine the efficacy of the preparation procedures. (d) True, see slides Most hplc detectors are non-destructive hence it is possible to collect the eluates after separation see slide 58. (e) False, affinity is a mode of chromatography, see slides 27 – 31 in Chapter 6 of this teaching and learning programme.")
78
Question number 7.2 This is a revision question relating to introductory material covered in Chapter 6 of this teaching and learning: Separation Mobile phase Stationary phase Chromatograph Chromatogram The last two terms are the most likely to cause confusion. The chromatograph is the instrument and the chromatogram is the plot of the results.

79
Question number 7.3 The answer to this question may be found on slides This problem uses the area ratio equation; (Aa/Ais) = K (Ca/Cis) Calculate K Firstly K needs to be calculated using the data for the solution in which both the internal standard and the analyte concentration are known: (197/357) = K (25/50) = 1.100 Determine Ca Using the data from the second solution Ca, the concentration of the drug in the analysis solution can be calculated: (105/162) = 1.1 (Ca/25) µg /cm3 = µg /cm3 This is the concentration in the analysis solution Apply dilution factor The analysis solution contained diluted plasma, therefore a dilution factor needs to be applied to obtain the concentration of the analyte in the original specimen. Therefore the concentration of the drug in the plasma is: Ca x (1.0/0.5) = 29.4 µg /cm3 Of the three steps given here to solve this internal standard calculation the first two are always needed, the application of a dilution factor is usually but not always required.
 = K (25/50) = Determine Ca. Using the data from the second solution Ca, the concentration of the drug in the analysis solution can be calculated: (105/162) = 1.1 (Ca/25) µg /cm3 = 14.7 µg /cm3. This is the concentration in the analysis solution. Apply dilution factor. The analysis solution contained diluted plasma, therefore a dilution factor needs to be applied to obtain the concentration of the analyte in the original specimen. Therefore the concentration of the drug in the plasma is: Ca x (1.0/0.5) = 29.4 µg /cm3. Of the three steps given here to solve this internal standard calculation the first two are always needed, the application of a dilution factor is usually but not always required.")
80
Question number 7.4 As in question 7.3 this question is an example of how an internal standard can be used without recourse to drawing a graph. The analysis makes use of the following relationship: Calculate K The first step is to calculate K. This is done using the results for the soultion which contains a known amount of analyte and internal standard, in this problem this was the second solution. Putting in the numbers gives: therefore K = 1.786 Determine CA Using the results from the solution containing the extracted herbicide it is now possible to calculate CA for this solution. Rearranging the area ratio equation gives: Continued on next slide

81
Putting in the numbers gives:
Solving gives CA = x mg /25cm3 Note the concentration units, they are always the units used for the internal standard. Calculate the concentration in the specimen 2.195 x10⁻⁴ mg was extracted from 160 g of dried vegetation. 2.195 x10⁻⁴ mg is equivalent to µg and 160 g is equivalent to 0.16 kg So /0.16 = 1.35 µg/kg. There were 1.35 µg/kg of the herbicide thiobencarb in the dried vegetation. As in question 7.3 there are three sections to the answer.

82
Question number 7.5 The answer to this question may be found on slides The polarity index for the mobile phase is given by equation ( 7.1 ): P’AB = ΦAP’A + ΦBP’B For the mobile phase used, this gives: P’AB = (0.3 X 5.8) + (0.7 X 10.2) = 8.88 For a reversed phase separation, the relationship between the capacity factors and the polarity indices is given by: k2/k1 = 10 (P’2 –P’1)/2 If k1 is 15 and k2 is required to be 3, while the initial polarity index has been calculated to be 8.88, and P’2 is what we are trying to find, this gives: 3/15 = 10 (P’2 – 8.88)/2 Taking logs of both sides gives: log (3/15) = (P’2 – 8.88)/2, which calculates as: (-.70) X 2 = P’2 – 8.88 P’2 = 7.48 So a polarity index of 7.48 is needed for the mobile phase to give the required capacity factor. Thus: P’AB = (ΦACN X 5.8) + [(1 – ΦACN) X 10.2] = Thus ΦACN = 0.62 This means that a mobile phase of 62% acetonitrile and 36% water will give the required capacity factor for the separation of the particular analyte. Polarity index Solvent 0.04 Cyclohexane 2.4 Toluene 4.0 Tetrahydrofuran 4.3 Ethanol 4.8 Dioxane 5.1 Methanol 5.8 Acetonitrile 6.0 Nitromethane 10.2 Water
: P’AB = ΦAP’A + ΦBP’B. For the mobile phase used, this gives: P’AB = (0.3 X 5.8) + (0.7 X 10.2) = For a reversed phase separation, the relationship between the capacity factors and the. polarity indices is given by: k2/k1 = 10 (P’2 –P’1)/2. If k1 is 15 and k2 is required to be 3, while the initial polarity index has been calculated to be. 8.88, and P’2 is what we are trying to find, this gives: 3/15 = 10 (P’2 – 8.88)/2. Taking logs of both sides gives: log (3/15) = (P’2 – 8.88)/2, which calculates as: (-.70) X 2 = P’2 – P’2 = So a polarity index of 7.48 is needed for the mobile. phase to give the required capacity factor. Thus: P’AB = (ΦACN X 5.8) + [(1 – ΦACN) X 10.2] = Thus ΦACN = This means that a mobile phase of 62% acetonitrile. and 36% water will give the required capacity factor. for the separation of the particular analyte. Polarity index. Solvent Cyclohexane Toluene Tetrahydrofuran Ethanol Dioxane Methanol Acetonitrile Nitromethane Water.")
83
Question number 7.6 The answer to this question may be found on slides 71. The process of area normalisation makes the assumption that all of the analytes have the same sensitivity at the detector being employed. The assumption of equal detector sensitivities is limited to a small range of organic compounds and mostly to the use of the flame ionisation detector as applied in gas-liquid chromatography. The process of normalisation generally works with simple homologous series such as saturated straight chain hydrocarbons, however could not be used with alcohols, esters, ketones etc. where the ratio of oxygen to alkyl moiety changes from compound to compound. Retention time (min) Peak area (µv.min) Percentage area 1.2 (analyte A) 12,000 15% 2.4 (analyte B) 20,000 25% 3.0 (analyte C) 18,000 22.5% 3.3 (analyte D) 30,000 37.5% % of component in mixture peak area of analyte = X 100 total peak area Total area is 80,000
 Peak area (µv.min) Percentage area. 1.2 (analyte A) 12, % 2.4 (analyte B) 20, % 3.0 (analyte C) 18, % 3.3 (analyte D) 30, % % of component in mixture. peak area of analyte. = X 100. total peak area. Total area is 80,000.")
84
Question number 7.7 This question develops the idea used in the previous question. In this case the analytes do not have the same detector response and this has to be taken into account. Analyte Y is taken to be the reference compound; in this instance this is an arbitrary choice. Any of the analytes can be used as the reference however consideration is always given to the end use of the results for example, are the results obtained for this solution to be compared to another solution, in which case is would be sensible to choose, as the reference, an analyte which was present in both solutions. The relative response factor is calculated using the following equation: area for reference X concentration of analyte area for analyte concentration of reference In this example the concentration ratio is 1. Retention time (min) Peak area (µv.min) Relative response factor 1.8 (analyte X) 8,000 1.75 2.5(analyte Y) 14,000 3.1 (analyte Z) 20,000 0.70 Continued on the next slide
 Peak area (µv.min) Relative response factor. 1.8 (analyte X) 8, (analyte Y) 14, (analyte Z) 20, Continued on the next slide.")
85
For Analyte Y as this is the reference no compensation is made
So the relative response factors for Analyte X is 1.75 and for Z is 0.70 Retention time (min) Peak area (µv.min) Compensated peak area Percentage area 1.8(analyte X) 20,000 35,000 55.0 2.5 (analyte Y) 16,000 25.2 3.1 (analyte Z) 18,000 12,600 19.8 Total peak area 63,600 Note the additional column, the values in this column are calculated by multiplying the peak areas obtained by the relevant response factor. For Analyte X 20,000 x 1.75 = 35,000 For Analyte Y as this is the reference no compensation is made For Analyte Z 18,000 x 0.7 = 12,600 peak area of analyte As previously % of component in mixture = X 100 total peak area This time the compensated areas are used to give the percentage area and therefore the percentage composition of the mixture.
 Peak area (µv.min) Compensated peak area. Percentage area. 1.8(analyte X) 20, , (analyte Y) 16, (analyte Z) 18, , Total peak area 63,600. Note the additional column, the values in this column are calculated by multiplying the peak areas obtained by the relevant response factor. For Analyte X 20,000 x 1.75 = 35,000. For Analyte Y as this is the reference no compensation is made. For Analyte Z 18,000 x 0.7 = 12,600. peak area of analyte. As previously % of component in mixture = X 100. total peak area. This time the compensated areas are used to give the percentage area and therefore the percentage composition of the mixture.")
Similar presentations


 is the most versatile and widely used type of elution chromatography.>")