Download presentation
Presentation is loading. Please wait.

1
Water Resources and Water Pollution
Chapter 9

2
Water Resources Water Earth’s surface is covered by 71% water
Essential for life – can survive only a few days without water

3
Supply of Water Resources
Small fraction (.014%) is readily available for human use
 is readily. available for human use.")
4
Evaporation and transpiration
Water Cycle – continuously collected, purified, recycled and distributed Evaporation and transpiration Evaporation Stream Infiltration Water table Unconfined aquifer Confined aquifer Lake Well requiring a pump Flowing artesian well Runoff Precipitation Confined Recharge Area Aquifer Less permeable material such as clay Confirming permeable rock layer

5
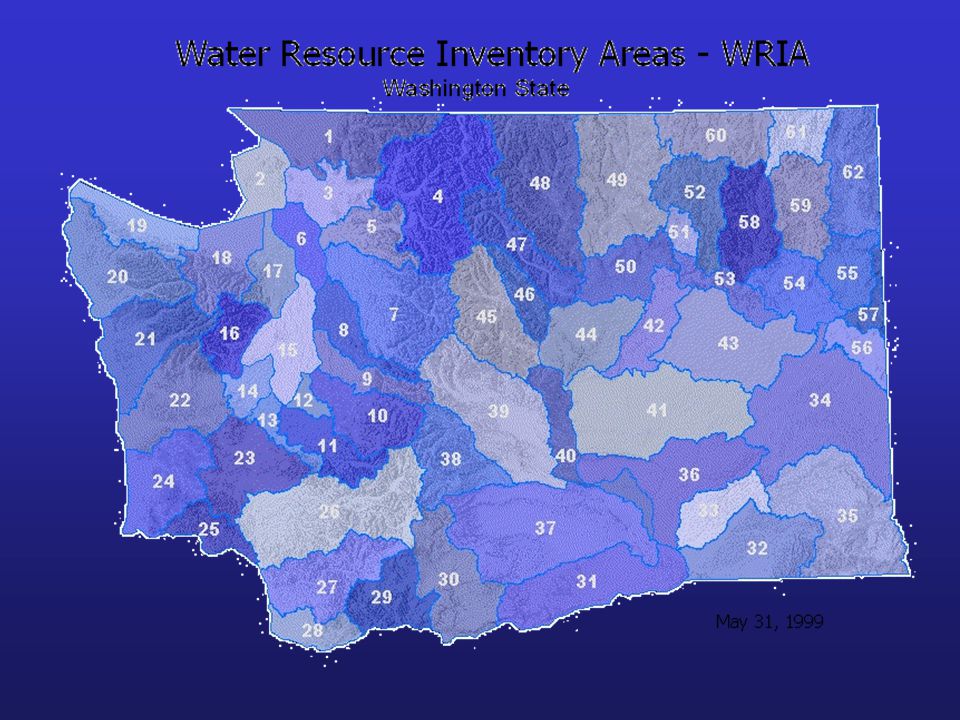
Watershed A watershed describes the total area contributing drainage to a stream or river May be applied to many scales A large watershed is made up of many small watersheds

6
Chehalis Basin

8
Evaporation and transpiration
Stream Infiltration Water table Unconfined aquifer Confined aquifer Lake Well requiring a pump Flowing artesian well Runoff Precipitation Confined Recharge Area Aquifer Less permeable material such as clay Confirming permeable rock layer Zone of saturation (spaces completely filled with water)
")
9
Water sources Surface runoff – 2/3 lost to floods and not available for human use. Reliable runoff = one third Amount of runoff that we can count on year to year Groundwater Zone of saturation Water table – top of zone of saturation Aquifer – water saturated layers of sand, gravel or bedrock through which groundwater flows. Recharge slow ~ 1 meter per year

10
Use of Water Resources Humans directly or indirectly use about 54% of reliable runoff Withdraw 34% of reliable runoff for: Agriculture – 70% Industry – 20% Domestic – 10% Leave 20% of runoff in streams for human use: transport goods, dilute pollution, sustain fisheries Could use up to 70-90% of the reliable runoff by 2025

11
Too Little Water Problems in the West Dry climate Drought Desiccation
Acute shortage Adequate supply Shortage Metropolitan regions with population greater than 1 million US has plenty of water. Much of it is in the wrong place at the wrong time. Most serious problems are flooding, pollution, occassional urban shortages

12
Water conflicts: Western US
Highly likely conflict potential Substantial conflict potential Moderate conflict potential Unmet rural water needs Wash. Oregon Idaho Nevada California Utah Montana Wyoming Colo. N.M. N.D. S.D. Neb. Kansas Oak. Texas Water and Fish

13
Water conflicts: Global
Two main factors for water shortage: dry climate and too many people. Many people live in hydro poverty – can’t afford clean water.

14
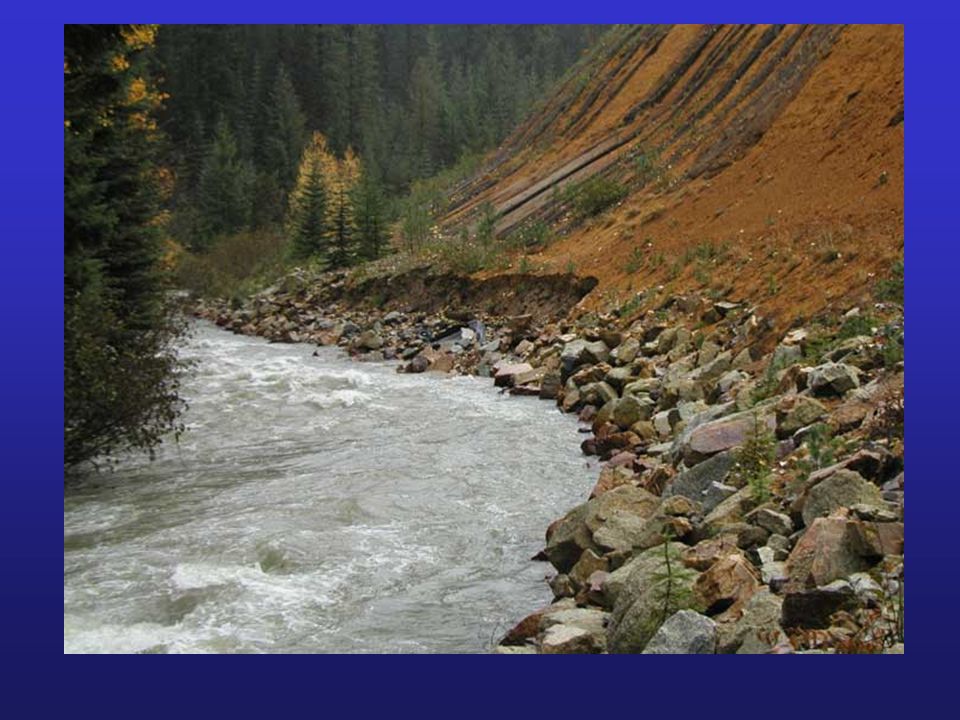
Too Much Water: Floods Natural phenomena
Aggravated by human activities Rain on snow Living on floodplains Impervious surfaces Removal of vegetation Draining wetlands Floodplain Levee Flood wall Dam Reservoir

15
Deforestation and flooding

16
Using Dams and Reservoirs to Supply More Water: The Trade-offs
Large losses of water through evaporation Flooded land destroys forests or cropland and displaces people Downstream flooding is reduced Downstream cropland and estuaries are deprived of nutrient-rich silt Reservoir is useful for recreation and fishing Can produce cheap electricity (hydropower) Migration and spawning of some fish are disrupted Provides water for year-round irrigation of cropland
 Migration and spawning of some fish are disrupted. Provides water. for year-round. irrigation of. cropland.")
17
Tapping Groundwater Year-round use No evaporation losses
Often less expensive Potential Problems: Water table lowering – too much use Depletion – U.S. groundwater being withdrawn at 4X its replacement rate Saltwater intrusion – near coastal areas Chemical contamination Reduced stream flows

19
Reducing water waste read section 9-4

20
Solutions Sustainable Water Use
Not depleting aquifers Preserving ecological health of aquatic systems Preserving water quality Integrated watershed management Agreements among regions and countries sharing surface water resources Outside party mediation of water disputes between nations Marketing of water rights Raising water prices Wasting less water Decreasing government subsides for supplying water Increasing government subsides for reducing water waste Slowing population growth

21
Pollution Source terminology
Point source = pollution comes from single, fixed, often large identifiable sources smoke stacks discharge drains tanker spills Non-point source = pollution comes from dispersed sources agricultural runoff street runoff

22
Types of Water Pollution from Table 9-1 p. 187
Sediment logging, roadbuilding, erosion Oxygen-demanding wastes human waste, storm sewers, runoff from agriculture, grazing and logging, many others Nutrient enrichment = Eutrophication N, P from fertilizers, detergents leads to increased growth in aquatic systems, ultimately more non-living organic matter

23
BOD As micro-organisms decompose (through respiration) organic matter, they use up all the available oxygen. Biological Oxygen Demand (BOD) Amount of oxygen required to decay a certain amount of organic matter. If too much organic matter is added, the available oxygen supplies will be used up.
 Amount of oxygen required to decay a certain amount of organic matter. If too much organic matter is added, the available oxygen supplies will be used up.")
25
Eutrophication Eutrophic – well-fed, high nutrient levels present in a lake or river Oligotrophic – poorly-fed, low nutrient levels Water bodies can be naturally eutrophic or oligotrophic, but can also be human-caused

26
Types of Water Pollution (con’t) from Table 9-1 p. 187
Disease-causing organisms from untreated sewage, runoff from feed lots Toxic chemicals pesticides, fertilizers, industrial chemicals Heavy metals lead, mercury Acids (to discuss later) Elevated temperatures = Thermal Pollution water is used for cooling purposes, then heated water is returned to its original source any increase in temperature, even a few degrees, may significantly alter some aquatic ecosystems.
 Elevated temperatures = Thermal Pollution. water is used for cooling purposes, then heated water is returned to its original source. any increase in temperature, even a few degrees, may significantly alter some aquatic ecosystems.")
27
Groundwater Pollution
Agricultural products Underground storage tanks Landfills Septic tanks Surface impoundments

28
Oil Spills Exxon Valdez released 42 million liters of oil in Prince William Sound, contaminating 1500 km of Alaska coastline in 1989 Was the cleanup effective? Most marine oil pollution comes from non-point sources: runoff from streets improper disposal of used oil discharge of oil-contaminated ballast water from tankers

29
Growth of population Supply & demand are in growing conflict – supply is finite – water management driven by values and needs Increases demand/use of water Increases land use and changes vegetation and permeability Increases demand for instream values – instream flows are for people

30
The construction of dams have
slowed the once flowing Columbia River into a series of lakes.

31
Agriculture uses approximately 70% of the water withdrawn
from our streams and rivers

32
Changing land use changes vegetation and need for water

33
Change in land use also changes permeability

34
Areas with 15 to 75 percent impervious surface are characterized as moderately developed. Areas with greater than 75 percent impervious surface are considered urban or highly developed. Areas with greater than 10% impervious surface have been proven to have a negative affect on groundwater and stormwater.

35
Water Rights Water collectively belongs to the public
Cannot be owned by individuals Individuals or groups may be granted rights to use water Legal authorization to use a predefined quantity of public water for a designated purpose. Irrigation, domestic water supply, power generation

36
Water Rights State law requires certain users of public waters to receive approval from the state prior to using water. Any use of surface water which began after 1917 requires a water-right permit. Withdrawals of underground water from 1945 requires a water-right permit.

38
Instream flows Result – the more we know about stream ecology, the more we realize that all the water has instream value, meaning there is no surplus Compromises and minimizing impact – thresholds for rate of impact Other ways to achieve ecosystem goals – wider view, not just flows – watershed land management

39
Legal/political aspects of instream flow
provide a flow of water sufficient to adequately support food fish and game fish populations in the stream (RCW ) provide protection and preservation and where possible enhancement, of wildlife, fish, … and other environmental values … (RCW 90.54) protect fish, game, birds, and other wildlife, recreational and aesthetic values and water quality (RCW 90.22) antidegradation requirements of Washington’s water quality standards (Ch A WAC, following Federal Clean Water Act)
 provide protection and preservation and where possible enhancement, of wildlife, fish, … and other environmental values … (RCW 90.54) protect fish, game, birds, and other wildlife, recreational and aesthetic values and water quality (RCW 90.22) antidegradation requirements of Washington’s water quality standards (Ch A WAC, following Federal Clean Water Act)")
40
Instream flows Other ways to achieve ecosystem goals – wider view, not just flows – watershed land management Avoid headwater disturbance Vegetation Geology and topography Maintain longitudinal and lateral connectivity Avoid mainstem in-channel storage Allow floodplain to function as floodplain

41
Avoid headwater disturbance and leave vegetation

43
Allow floodplains to function as floodplains

47
Flow restoration Markets and transfers Need to protect restored flows
Enforcement

48
Opportunities Parks and wilderness areas
Renewable natural resource management and harvest (forestry, grazing, secondary forest products) Municipal watershed protection Low intensity sustainable agriculture
 Municipal watershed protection. Low intensity sustainable agriculture.")
49
Watershed Planning The 1998 legislature passed ESHB 2514, codified into Ch RCW, to set a framework for developing local solutions to watershed issues on a watershed basis. Ch RCW states: The legislature finds that the local development of watershed plans for managing water resources and for protecting existing water rights is vital to both state and local interests.

50
Watershed Planning RCW 90.82.005 Purpose.
The purpose of this chapter is to develop a more thorough and cooperative method of determining what the current water resource situation is in each water resource inventory area of the state and to provide local citizens with the maximum possible input concerning their goals and objectives for water resource management and development.

51
Watershed Planning Each implementation plan must contain strategies to provide sufficient water for: (a) Production agriculture; (b) commercial, industrial, and residential use; and (c) instream flows. Each implementation plan must contain timelines to achieve these strategies and interim milestones to measure progress
 Production agriculture; (b) commercial, industrial, and residential use; and (c) instream flows. Each implementation plan must contain timelines to achieve these strategies and interim milestones to measure progress.")
Similar presentations


>")
 of Earth’s water is saltwater Of the 3% that is freshwater, >")


