Download presentation
Presentation is loading. Please wait.

1
Storage and Disks Fusheng Wang Department of Biomedical Informatics
Department of Mathematics and Computer Science Emory University

2
The Systems Side of Databases
Data Organization: physical storage strategies to support efficient updates, retrieval 2. Data retrieval: auxiliary data structures to enable efficient retrieval. Techniques for processing queries to ensure efficient retrieval 3. Data Integrity: techniques for implementing Xtions, to ensure safe concurrent access to data. Ensuring data is safe in the presence of system crashes.

3
Data Organization Key points: 1. Storage Media
“Memory hierarchy” Efficient/reliable transfer of data between disks and main memory Hardware techniques (RAID disks) Software techniques (Buffer mgmt) 2. Storage strategies for relations-file organization Representation of tuples on disks Storage of tuples in pages, clustering
 Software techniques (Buffer mgmt) 2. Storage strategies for relations-file organization. Representation of tuples on disks. Storage of tuples in pages, clustering.")
4
DB2 Architecture Overview

5
An Example Query Process (in DB2)
")
6
CPU Typical Computer ... ... M C Secondary Storage

7
Storage Hierarchy V Higher speed Lower price NV

8
Storage Media: Cache and Main Memory
Cache – fastest and most costly form of storage; volatile; managed by the computer system hardware. Main memory: fast access (10s to 100s of nanoseconds; 1 nanosecond = 10–9 seconds) generally too small (or too expensive) to store the entire database Volatile — contents of main memory are usually lost if a power failure or system crash occurs. But… CPU operates only on data in main memory
 generally too small (or too expensive) to store the entire database. Volatile — contents of main memory are usually lost if a power failure or system crash occurs. But… CPU operates only on data in main memory.")
9
Storage Media: Flash Memory
Data survives power failure Data can be written at a location only once, but location can be erased and written to again Can support only a limited number (10K – 1M) of write/erase cycles. Erasing of memory has to be done to an entire bank of memory Reads are roughly as fast as main memory But writes are slow (few microseconds), erase is slower Widely used in embedded devices such as digital cameras, phones, and USB keys
 of write/erase cycles. Erasing of memory has to be done to an entire bank of memory. Reads are roughly as fast as main memory. But writes are slow (few microseconds), erase is slower. Widely used in embedded devices such as digital cameras, phones, and USB keys.")
10
Storage Media: Disk Disk
Primary medium for the long-term storage of data; typically stores entire database. random-access – possible to read data on disk in any order, unlike magnetic tape Non-volatile: data survive a power failure or a system crash, disk failure less likely than them New technology: Solid State Disks and Flash disks

11
Storage Media: Players
Optical storage non-volatile, data is read optically from a spinning disk using a laser CD-ROM (640 MB) and DVD (4.7 to 17 GB) most popular forms Write-one, read-many (WORM) optical disks used for archival storage (CD-R and DVD-R) Multiple write versions also available (CD-RW, DVD-RW, and DVD-RAM) Reads and writes are slower than with magnetic disk Tapes Sequential access (very slow) Cheap, high capacity
 and DVD (4.7 to 17 GB) most popular forms. Write-one, read-many (WORM) optical disks used for archival storage (CD-R and DVD-R) Multiple write versions also available (CD-RW, DVD-RW, and DVD-RAM) Reads and writes are slower than with magnetic disk. Tapes. Sequential access (very slow) Cheap, high capacity.")
12
Memory Hierarchy primary storage: Fastest media but volatile (cache, main memory) secondary storage: next level in hierarchy, non-volatile, moderately fast access time also called on-line storage E.g. flash memory, magnetic disks tertiary storage: lowest level in hierarchy, non-volatile, slow access time also called off-line storage E.g. magnetic tape, optical storage

13
Memory Hierarchy: Data Transfers
cache – mm : OS/hardware controlled mm – disk : <- reads, -> writes controlled by DBMS disk – CD-Rom or DVD disk – Tapes Backups (off-line)
")
14
Main memory Disk Data Transfers Concerns
1. Efficiency (speed) can be improved by... a. improving raw data transfer speed b. avoiding untimely data transfer c. avoiding unnecessary data transfer 2. Safety (reliability, availability) a. storing data redundantly
 can be improved by... a. improving raw data transfer speed. b. avoiding untimely data transfer. c. avoiding unnecessary data transfer. 2. Safety (reliability, availability) a. storing data redundantly.")
15
Main memory Disk Data Transfers
Achieving efficiency: 1. Improve Raw data Transfer speed 1. Faster Disks 2. Parallelization (RAID) 2. Avoiding untimely data transfers 1. Disk scheduling 2. Batching 3. Avoiding unnecessary data transfers 1. Buffer Management 2. Good file organization
 2. Avoiding untimely data transfers. 1. Disk scheduling. 2. Batching. 3. Avoiding unnecessary data transfers. 1. Buffer Management. 2. Good file organization.")
16
Hard Disk Mechanism http://www.youtube.com/watch?v=Bh80aaygIXg

17
Hard Disk Read-write head Positioned very close to the platter surface
Reads or writes magnetically encoded information Surface of platter divided into circular tracks Over 50K-100K tracks per platter on typical hard disks Each track is divided into sectors (blocks) The smallest unit of data that can be read or written Sector size typically 512 bytes (2048 bytes for DVD/CD-ROM) Typical sectors per track: 500 to 1000 (on inner tracks) to 1000 to 2000 (on outer tracks) To read/write a sector disk arm swings to position head on right track platter spins continually; data is read/written as sector passes under head Head-disk assemblies multiple disk platters on a single spindle (1 to 5 usually) one head per platter, mounted on a common arm Cylinder i consists of ith track of all the platters
 The smallest unit of data that can be read or written. Sector size typically 512 bytes (2048 bytes for DVD/CD-ROM) Typical sectors per track: 500 to 1000 (on inner tracks) to 1000 to 2000 (on outer tracks) To read/write a sector. disk arm swings to position head on right track. platter spins continually; data is read/written as sector passes under head. Head-disk assemblies. multiple disk platters on a single spindle (1 to 5 usually) one head per platter, mounted on a common arm. Cylinder i consists of ith track of all the platters.")
18
“Typical” Values Diameter: 1 inch 15 inches Cylinders: 100 2000 Surfaces: 1 or 2 (Tracks/cyl) 2 (floppies) 30 Sector Size: 512B 50K Capacity: 360 KB (old floppy) 1.5 TB
 1.5 TB.")
19
Performance Measures of Disks
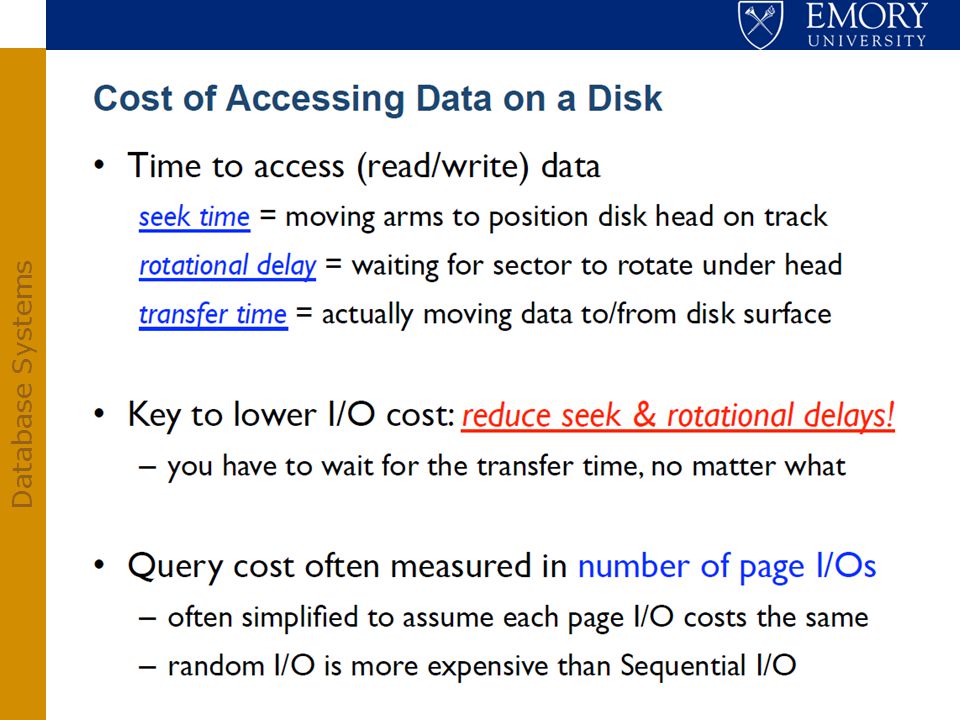
Access time – consists of: Seek time – time it takes to reposition the arm over the correct track Average: 4ms (high end), 9ms(desktop), 12ms (mobile drives) (Rotational) latency time – time it takes for the sector to be accessed to appear under the head Avg: 2ms(15k rpm), 3ms(10k rpm) 4.16ms(7200rpm) Data-transfer rate – the rate at which data can be retrieved from or stored to the disk. Analogy to taking a bus: 1. Seek time: time to get to bus stop 2. Latency time; time spent waiting at bus stop 3. Data transfer time: time spent riding the bus
, 9ms(desktop), 12ms (mobile drives) (Rotational) latency time – time it takes for the sector to be accessed to appear under the head. Avg: 2ms(15k rpm), 3ms(10k rpm) 4.16ms(7200rpm) Data-transfer rate – the rate at which data can be retrieved from or stored to the disk. Analogy to taking a bus: 1. Seek time: time to get to bus stop. 2. Latency time; time spent waiting at bus stop. 3. Data transfer time: time spent riding the bus.")
20
Data Transfer Rate Data transfer rate (also called throughput): min(internal rate, external rate) Internal rate: moving data between the disk surface and the controller on the drive External rate: moving data between the controller on the drive and the host system A typical 7200 RPM desktop HDD: 1030 Mbit/s 12x blue-ray: 432Mbit/s SATA interface: 2Gbits/s

21
Example ST3120022A : Barracuda 7200.7 Capacity:120 GB
Interface: Ultra ATA/100 RPM: 7200 RPM Seek time: 8.5 ms avg Latency time?: 7200/60 = 120 rotations/sec 1 rotation in 8.3 ms => So, Av. Latency = 4.16 ms

22
Random vs sequential I/O
Ex: 1 KB Block Random I/O: 15 ms. Sequential I/O: 1 ms. Rule of Random I/O: Expensive Thumb Sequential I/O: Much less ~10-20 times

23
Courtesy of Shawn Bowers.

24
Courtesy of Shawn Bowers.

29
Exercise: Disk Access Cost Estimation
IBM U GB hard drive has average seek time of 3.6ms, average rotation delay of 2ms for a half rotation (15K rpm), and a transfer rate of 320MB/sec. 1.Estimate access time for a 4KB block 2.Estimate access time for a contiguous 64KB access 3. Estimate access time for 16 random 4KB-blocks 1.: I/O = 3.6ms + 2ms + 4KB/320MB/s = = ms 2.: I/O = 3.6ms + 2ms + 4KB/320MB/s = KB/320MB/s = 5.8 ms 3.: I/O = x 8 = 44.9 ms
, and a transfer rate of 320MB/sec. 1.Estimate access time for a 4KB block. 2.Estimate access time for a contiguous 64KB access. 3. Estimate access time for 16 random 4KB-blocks. 1.: I/O = 3.6ms + 2ms + 4KB/320MB/s = = ms. 2.: I/O = 3.6ms + 2ms + 4KB/320MB/s = KB/320MB/s = 5.8 ms. 3.: I/O = x 8 = 44.9 ms.")
30
Performance Measures (Cont.)
Mean time to failure (MTTF) – the average time the disk is expected to run continuously without any failure. Typically 5 to 10 years Probability of failure of new disks is quite low, corresponding to a “theoretical MTTF” of 30,000 to 1,200,000 hours for a new disk E.g., an MTTF of 1,200,000 hours for a new disk means that given 1000 relatively new disks, on an average one will fail every 1200 hours MTTF decreases as disk ages
 – the average time the disk is expected to run continuously without any failure. Typically 5 to 10 years. Probability of failure of new disks is quite low, corresponding to a theoretical MTTF of 30,000 to 1,200,000 hours for a new disk. E.g., an MTTF of 1,200,000 hours for a new disk means that given 1000 relatively new disks, on an average one will fail every 1200 hours. MTTF decreases as disk ages.")
31
RAID: Redundant Arrays of Independent (Inexpensive) Disks
disk organization techniques that manage a large numbers of disks, providing a view of a single disk Idea: cheaper to have many small disks, than few big disks bonus: also advantageous for: 1. speed (efficiency) 2. reliability (safety)
 2. reliability (safety)")
32
Improvement in Performance via Parallelism
Choices: D D D Dn 1. Distribute files (f1 D1, f2 D2, ....) or 2. Distribute parts of files (“striping”) block striping sector striping ...... bit striping
 or. 2. Distribute parts of files ( striping ) block striping. sector striping bit striping.")
33
Parallelization File distribution
+: Availability: Many files still available if a disk goes down +: recovery requires fewer disks - : but still sequential read for each file Striping +: improved ||’ism (speed) ( - : but a single disk failure catastrophic!)
 ( - : but a single disk failure catastrophic!)")
34
Improving Reliability
Measure: MTTF Striping reduces reliability: why? Solution = Redundancy Redundancy: store data on more than 1 disk E.g. “mirroring” (duplicate disks) (1 disk stored on 2) logical disk Then, MTTF for both disks: 57,000 yrs! assuming MTTF for each disk is 11 yrs. RAID (redundant array of independent disks): a storage technology that combines multiple disk drive components into a logical unit for the purposes of data redundancy and performance improvement
 (1 disk stored on 2) logical disk. Then, MTTF for both disks: 57,000 yrs! assuming MTTF for. each disk is 11 yrs. RAID (redundant array of independent disks): a storage technology that combines multiple disk drive components into a logical unit for the purposes of data redundancy and performance improvement.")
35
RAID Levels Schemes to provide redundancy at lower cost by using disk striping combined with parity bits Different RAID organizations, or RAID levels, have differing cost, performance and reliability characteristics RAID Level 0: Block striping; non-redundant. Used in high-performance applications where data loss is not critical. RAID Level 1: Mirrored disks with block striping Offers good write performance. Popular for applications such as storing log files in a database system.

36
8 bits including parity (even)
Parity Bit A bit added to the end of a string of binary code that indicates whether the number of bits in the string with the value one is even or odd With 3 drives: 7 bits of data (count of 1 bits) 8 bits including parity (even) 3 If drive 2 fails: (1) XOR (3) _____________ (2) XOR Drive 3: Drive 1: Drive 2:
 8 bits including parity (even) If drive 2 fails: (1) XOR (3) _____________ (2) XOR Drive 3: Drive 1: Drive 2:")
37
RAID Levels (Cont.) RAID Level 2: Memory-Style Error-Correcting- Codes (ECC) with bit striping. RAID Level 3: Bit-Interleaved Parity A single parity bit is enough for error correction, not just detection, since we know which disk has failed When writing data, corresponding parity bits must also be computed and written to a parity bit disk To recover data in a damaged disk, compute XOR of bits from other disks (including parity bit disk)
")
38
RAID Levels (Cont.) RAID Level 3 (Cont.)
Faster data transfer than with a single disk, but fewer I/Os per second since every disk has to participate in every I/O. Subsumes Level 2 (provides all its benefits, at lower cost). RAID Level 4: Block-Interleaved Parity; uses block-level striping, and keeps a parity block on a separate disk for corresponding blocks from N other disks. When writing data block, corresponding block of parity bits must also be computed and written to parity disk To find value of a damaged block, compute XOR of bits from corresponding blocks (including parity block) from other disks.
. RAID Level 4: Block-Interleaved Parity; uses block-level striping, and keeps a parity block on a separate disk for corresponding blocks from N other disks. When writing data block, corresponding block of parity bits must also be computed and written to parity disk. To find value of a damaged block, compute XOR of bits from corresponding blocks (including parity block) from other disks.")
39
RAID Levels (Cont.) RAID Level 4 (Cont.)
Provides higher I/O rates for independent block reads than Level 3 Provides high transfer rates for reads of multiple blocks than no-striping Before writing a block, parity data must be computed Can be done by using old parity block, old value of current block and new value of current block (2 block reads + 2 block writes) Parity block becomes a bottleneck for independent block writes since every block write also writes to parity disk
 Parity block becomes a bottleneck for independent block writes since every block write also writes to parity disk.")
40
RAID Level 5 RAID Level 5: Block-Interleaved Distributed Parity; partitions data and parity among all N + 1 disks, rather than storing data in N disks and parity in 1 disk. e.g., with 4 disks, parity block for nth set of blocks is stored on disk (n mod 4) + 1, with the data blocks stored on the other 4 disks.
 + 1, with the data blocks stored on the other 4 disks.")
41
RAID Levels (Cont.) Data is block interleaved – this allows us to get all our data from a single disk on a read (in case of a disk error, read all disks) Block interleaving reduces throughput for a single request ( only a single disk is servicing the request), but improves task-level parallelism as other disk drives are free to service other requests On a write, we access the disk that stores the data and the parity disk – parity information can be updated simply by checking if the new data differs from the old data If we have a single disk for parity, multiple writes can not happen in parallel (as all writes must update parity info) RAID 5 distributes the parity block to allow simultaneous writes
 Block interleaving reduces throughput for a single request ( only a single disk is servicing the request), but. improves task-level parallelism as other disk drives are. free to service other requests. On a write, we access the disk that stores the data and the. parity disk – parity information can be updated simply by. checking if the new data differs from the old data. If we have a single disk for parity, multiple writes can not. happen in parallel (as all writes must update parity info) RAID 5 distributes the parity block to allow simultaneous. writes.")
42
Choice of RAID Level Factors in choosing RAID level
Monetary cost Performance: Number of I/O operations per second, and bandwidth during normal operation Performance during failure Performance during rebuild of failed disk Including time taken to rebuild failed disk RAID 0 is used only when data safety is not important E.g. data can be recovered quickly from other sources Level 2 and 4 never used since they are subsumed by 3 and 5 Level 3 is not used anymore since bit-striping forces single block reads to access all disks, wasting disk arm movement, which block striping (level 5) avoids Level 6 is rarely used since levels 1 and 5 offer adequate safety for almost all applications So competition is between 1 and 5 only
 avoids. Level 6 is rarely used since levels 1 and 5 offer adequate safety for almost all applications. So competition is between 1 and 5 only.")
43
Choice of RAID Level Level 1 provides much better write performance than level 5 Level 5 requires at least 2 block reads and 2 block writes to write a single block, whereas Level 1 only requires 2 block writes Level 1 preferred for high update environments such as log disks Level 1 had higher storage cost than level 5 disk drive capacities increasing rapidly (50%/year) whereas disk access times have decreased much less (x 3 in 10 years) I/O requirements have increased greatly, e.g. for Web servers When enough disks have been bought to satisfy required rate of I/O, they often have spare storage capacity so there is often no extra monetary cost for Level 1! Level 5 is preferred for applications with low update rate, and large amounts of data Level 1 is preferred for all other applications
 whereas disk access times have decreased much less (x 3 in 10 years) I/O requirements have increased greatly, e.g. for Web servers. When enough disks have been bought to satisfy required rate of I/O, they often have spare storage capacity. so there is often no extra monetary cost for Level 1! Level 5 is preferred for applications with low update rate, and large amounts of data. Level 1 is preferred for all other applications.")
Similar presentations


. Disk organization technique that manages a large number of disks, providing a view of a single disk of High.>")


,>")


