Download presentation
Presentation is loading. Please wait.

1
A Spatial Way of Thinking
Seeing the world like a geographer A Spatial Way of Thinking

2
Why do geographers use maps?
Maps help geographers understand and explain the features of the earth. Remember Human & physical geography? Which is human, which is physical?

3
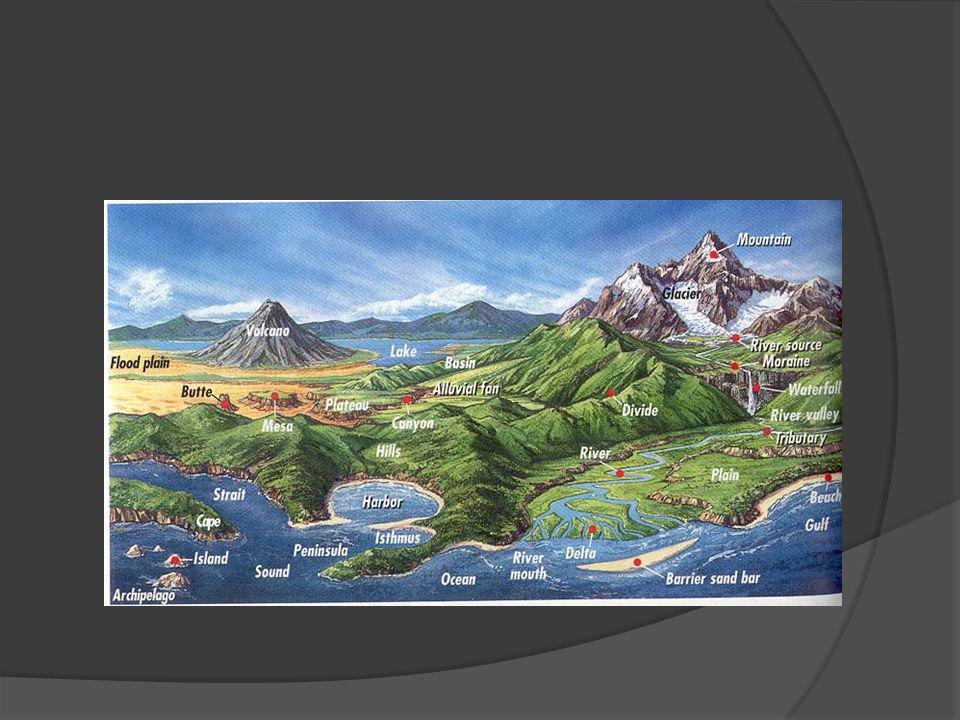
What are geographic “features”?
Features = what is on the earth (human and physical) Physical Features: natural parts earth surface and environment. | pics | Examples: Landforms: mtns, valleys, plains (on land) Bodies of water: oceans, seas, lakes, rivers Climate: type of weather over long periods of time | ex | Vegetation: plant life in a particular area
 Physical Features: natural parts earth surface and environment. | pics | Examples: Landforms: mtns, valleys, plains (on land) Bodies of water: oceans, seas, lakes, rivers. Climate: type of weather over long periods of time | ex | Vegetation: plant life in a particular area.")
4
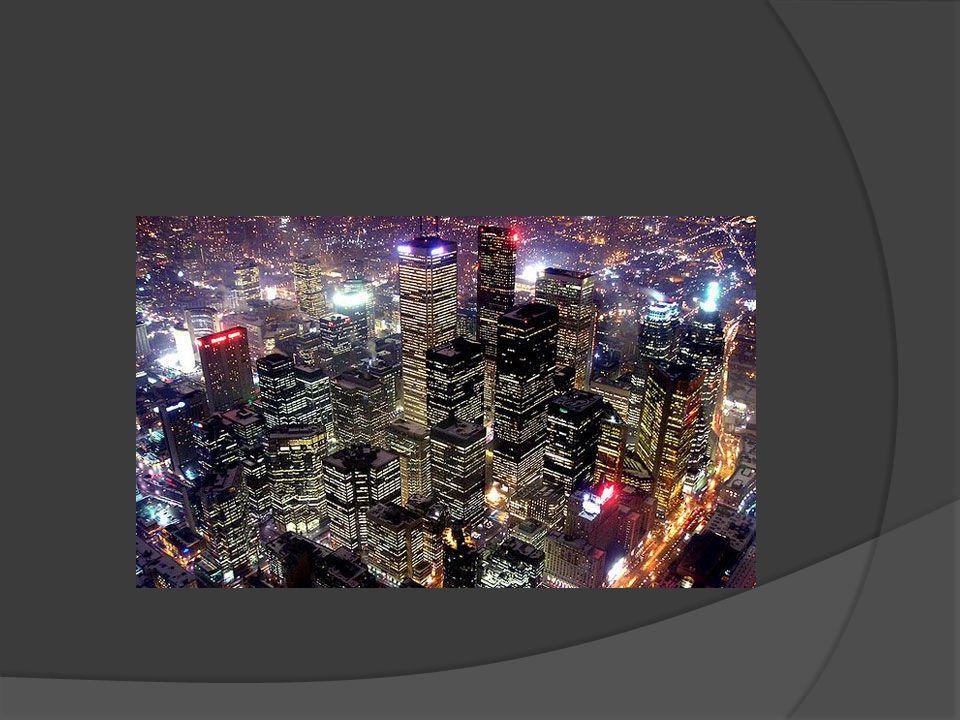
Human Features: Things humans have created on earth.
Examples: countries, population, religion, economic activity. | pics |

5
Thematic Maps What are “thematic maps”?
A map that shows one theme or topic How / why do geographers use thematic maps? Thematic maps help explain “where” the topic is. (What topic is happening where) But also… who, when, and if used correctly, can help explain why. | Maps 1 | maps 2 |
 But also… who, when, and if used correctly, can help explain why. | Maps 1 | maps 2 |")
6
Geography is more than just where things are!
Thematic maps can be used to answer important questions. Is there a problem with gun violence in the U.S.? Do gun laws work? How does the U.S. compare with the rest of the world? Education, health care, jobs, cost of living, safety..? Which countries spend the most money on their military? Why? | map |

7
Are thematic maps all I need to look at to understand the world?
Yes or no? Why or why not? What are some problems with thematic maps? Who made the map and why (purpose / bias)? When was the map made? Is the information accurate?
 When was the map made Is the information accurate")
8
How do I understand a thematic map?
Title + Legend

9
6 Common Thematic Maps Physical Features: mtns, valleys, plains, elevation (on land) | map | Climate: type of weather over long periods of time | ex | map | Vegetation: plant life in a particular area | map | Activity: Hand out climate and vegetation descriptions sheets. Finish wksts.

10
4. Population Density: tells us how crowded a place is. # of people per mile / kilometer. | map | How to calculate: PD = total # of people ÷ total land area The higher the result, the more crowded the place is. | Example | Activity: Finish wkst.; GA population map questions; Classroom representation (use tiles);
;")
11
5. Economic Activity: how use land and resources to make a living | map | Examples:
Subsistence farming, hunting and gathering, forestry, trade and manufacturing, recreation Activity: Finish wkst.; GA map questions; GA Classroom Act outs;

12
6. Region: an area defined by one or more natural or cultural characteristics that set it apart from other areas. | world regions map | Examples: The Northwest, Latin American, The Arctic Region, Portland Transit, China Town, The Heartland, The Middle East, Down Town What examples can you think of?

16
World Climate Zones Climagraphs for the 12 climate zones found around the world are shown above.
| back |

23
| back |

27
Google map hikers with cameras

28
Google map car with camera
| back |

29
What is PD of Redmond, Or.? 26, 646 ÷ 16.79 =
In 2007, New York City PD = more than 26,000 people per square mile. | back | 1,587 people per sq mile.

30
Most PD cities in world:
Hong Kong, China Lagos, Nigeria Dhaka, Bangladesh Jakarta, Indonesia Mumbai, India Ahmadabad, India Ho Chi Minh City, Vietnam Shenyang, China Bangalore, India Cairo, Egypt | back |

Similar presentations


 Write three things that answer what you think of when you think of these places Albert Lea New York City Hawaii.>")


 May show elevation- height.>")

