Download presentation
Presentation is loading. Please wait.

1
SCHOOL DISTRICT ESTIMATES AND PROJECTIONS May 22, 2012

2
Enrollment History Student Research -Geo-code Appraisal Research Housing Research -Single Family -Multi Family Economic Indicators -Census Data Projections -Campus and Grade

3
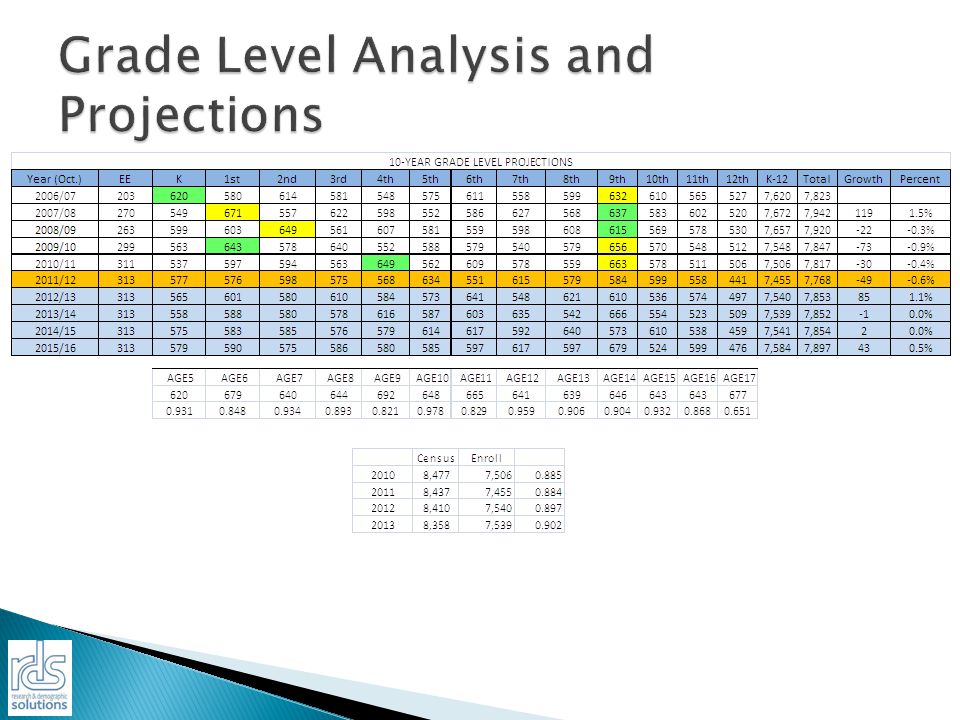
Existing Enrollment Trends 973 New Students, exceeded forecast by 500 students Total net growth previous 5 years: 899 Kindergarten growth of 8%, largest class in recent history First grade exceeds 3,000 students for first time KG-3 rd grade enrollment exceeds 9 th -12 th by over 2,500 students 12 th grade survival rate dropped below 95% for first time

4
Understand Race/Ethnicity Trends Track changes in poverty

5
Kindergarten Growth Exceeds 8% (13% in two years) Kindergarten Growth exceeds 19% 10 Shaded Schools had a total increase of 173 students. 75% of net growth from 2010/11 to 2011/12 Apartment Points

6
Appraisal District Data Dallas County Appraisal District Combined over 63,000 records Over 65 exemptions Accurate Residential Geo-Code Over-65 increases consistent with aging population as detailed through 2010 Census reports. Source: Dallas County Appraisal District

7
Park at North Vista ( Meyer Elementary) Students / Units = Yield 221 (115 Elem) / 252 =.88 Trailing Vine Apartments (Hirsch Elementary) Students / Units = Yield 56 (18 Elem) / 96 =.58 Note: In 2010 this complex had 89 students (43 Elem) a yield of.92. Note: In 2010 this complex had 235 students (127 Elem) a yield of.93.
 a yield of.93..")
8
Huffines Community 2,000 Acres 3,500 Single Family Multi-Family or TH/Condo 450 acres of lakes Mixed Use Build-out 8-10 years Developer has begun permitting SF homes. Expects 250 Homes by end of 2013

9
2000 Census Total Population ISD: 68,207 Total Under 18 Population: 20,122 29% of Total Population Under 18 2010 Census Total Population ISD: 74,409 Total Under 18 Population: 18,791 25% of Total Population Under 18

11
SF1 Census Block data by age Campus Enrollment by grade

12
Annual New home Closings When/how do we adjust household size? Change above - 2.75 – 2.86 – Actual 2010 Census 2.93

13
http://ritter.tea.state.tx.us/adhocrpt/Standard_Reports.html

14
AOI: collection of 2010 census blocks Summarized data researched housing April 10 – April 12 Developed occupancy rate using parcel owner ship records Census household sizes April 2012 Population Compared change to local population estimate changes and ISD growth.

Similar presentations


 pantry survey found that.>")


, 04/22/2010 release. Estimates of detailed employment and wage data for the states.>")


