Download presentation
Presentation is loading. Please wait.

1
Create Your Reverse Logistics Financial Model by John Mehrmann

2
Building a Financial Model All financial models are not created equal There is no one size fits all financial model A personal financial model is determined by –Process –Product –Price –Profit –People –Parts –Performance –Provisions –Percentage –Perspective The goal of this material is to give you building blocks for constructing your own financial model.

3
Process There are different perspectives to the impact of returns Manufacturers may track return ratios by channel, while the channel may track returns by brand and model Product $ MSRP (Retail Price) $ LIC (Cost) $ BOM (Materials) Sales Manufacturer Perspective Credit & Return Ratio $ Direct $ Retail $ VAR Retail Perspective Return Ratio by Brand / Model $ Refund $ Replace Same Brand $ Replace Different Brand $ Time to Return $ RMA & Credit Policies $ Caps on Returns
 $ LIC (Cost) $ BOM (Materials) Sales Manufacturer Perspective Credit & Return Ratio $ Direct $ Retail $ VAR Retail Perspective Return Ratio by Brand / Model $ Refund $ Replace Same Brand $ Replace Different Brand $ Time to Return $ RMA & Credit Policies $ Caps on Returns")
4
Retail Return Impact View Collect Data to compare Brand / Model Performance

5
Manufacturer View Freight and freight related charges How many people touch the product or the process? Are you tracking all of the costs? Product $ MSRP (Retail Price) $ LIC (Cost) $ BOM (Materials) Sales Return Center $ Freight and $ Fuel Surcharges $ Receiving $ Sorting $ Inspection / Validation $ Credit Processing / Finance $ Operations Management $ Warehouse Space $ Ratio Good vs Bad Units $ Return Packaging
 $ LIC (Cost) $ BOM (Materials) Sales Return Center $ Freight and $ Fuel Surcharges $ Receiving $ Sorting $ Inspection / Validation $ Credit Processing / Finance $ Operations Management $ Warehouse Space $ Ratio Good vs Bad Units $ Return Packaging.")
6
Trends Tracking trends by sales channels and return ratios is an important step to forecast resources, storage, and budget impact for manufacturers. Apply historical trends to forecasted future sales by channel and plan ahead.

7
Where are your Returns Received? Freight and fuel charges are greatly impacted by the geographic location of the Returns Center compared to demographics and carrier (truck, rail, etc) 20% of Returns80% of Returns
 20% of Returns80% of Returns.")
8
Return Center Hidden Costs Facility Manpower Utilities Fixed Expense Variable Costs Depreciation IT Systems What do you pay for?

9
After it is received... Product Sales Return Center Hold – Accumulate Inventory at Full Book Value (Uh Oh) Future Financial Impact Return Product to Vendor for Warranty (ODM/OCM) Refurbish Product, Repair Parts from Vendor or Harvest Sell AS IS or SCRAP $ Freight & Fuel Surcharges $ Inventory position $ Depreciation $ Warehouse Storage $ Operations and Accounting $ Shipping & Receiving $ Packing & Insurance
 Future Financial Impact Return Product to Vendor for Warranty (ODM/OCM) Refurbish Product, Repair Parts from Vendor or Harvest Sell AS IS or SCRAP $ Freight & Fuel Surcharges $ Inventory position $ Depreciation $ Warehouse Storage $ Operations and Accounting $ Shipping & Receiving $ Packing & Insurance.")
10
Global Economy $ Labor Rates $ ODM Part Warranty $ Variable Currency Exchange Rates $ Inventory Position $ Accumulated Shipments $ Import, Export, Duties, Tax $ Shipping, Receiving, Handling $ Depreciation in transit $ Freight Compare

11
Are you getting the most value? Cost of Replacement Parts Back-order Spare Parts Status Return Product Refurbish Resale Value Customer Exchanges Harvest Parts for Warranty Harvest Parts for Refurbishing Cost of the sum of Parts compared to Product Value Use Refurbished not NEW units Replace rather than Refund Trend accumulated inventory, depreciation, and price erosion Product Resale Value and Parts Procurement costs change over time and must be updated

12
Accessories How many different ways are the same accessories carried in inventory? Same item with different part numbers and different locations? $ Manuals $ Cables $ Remotes $ AC Adapters $ Batteries $ Ear Buds $ CDs / Software $ ______________ Replenish? Inventory? Consumer Demand? Debit Missing Accessories?

13
Technology Integration and automation Improve tracking, planning, and productivity Automate manual functions Integration between retail dealer, return center, call center, service providers, ODM vendors, claims processing, collectors, recyclers, government, ODM, and OCM vendors Track and trend Failure Rates, Return Ratios, and ROI What is the ROI on your IT Architecture? How is Technology used to plan decisions –When to refurbish –When to repair –When to harvest parts –etc

14
e-Waste Growing awareness, concern, and cost. Expense for collection, recycling, Certificates of Destruction, and related costs for environmental protection are creating new financial burdens by geographic region and product. RoHS & WEEE Directives, Laws being drafted ongoing

15
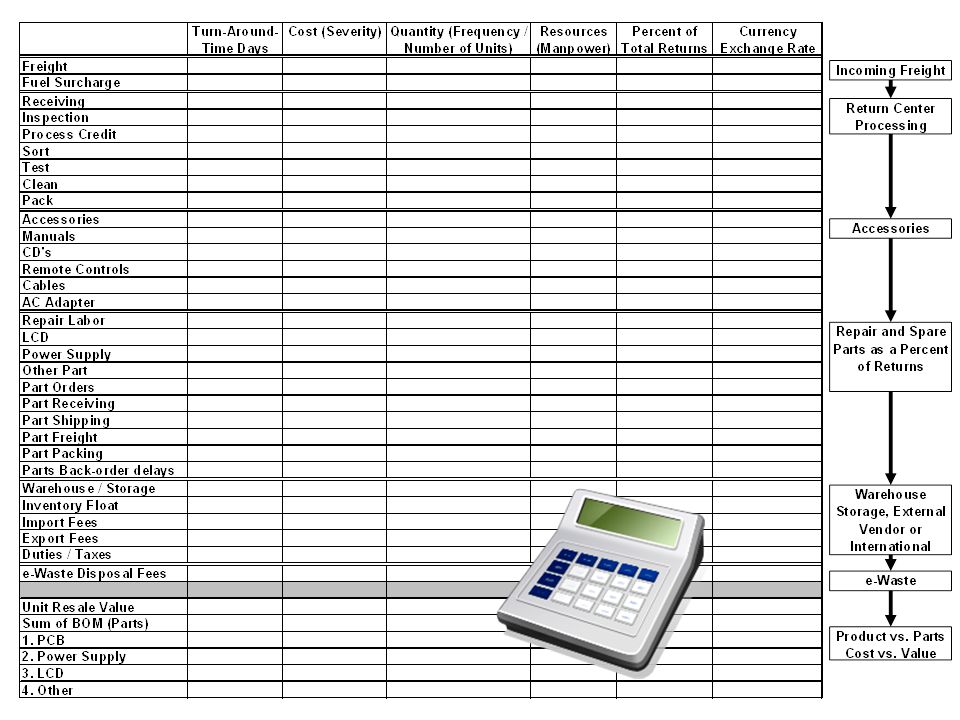
Create your own model 1.Map your process Define and measure each step in the process Define movement between steps, movement = expense 2.Assign Metrics to each Step and Movement Frequency Severity or Cost Resources or Manpower Inventory Depreciation or Process Delay Cost 3.Identify Variables Adjustable Seasonal Headcount Warehouse / Storage Currency Exchange Rates, Duties, Fees 4.Find Hidden Costs Examples: Accessories, Boxes and Packing Materials, Utilities, Management, IT, etc

16
Map Your Process Wal-MartBest BuyCircuit CitySEARSOther Blanket Return Authorization / On-Line Entry / System Integration Options – RMA Options Logistics / Transportation Costs of Return Freight Consolidation and Receipt Confirmation Electronic / On-Line Alert Report to issue Credit NewRefurbish (Not New)Not Economical to Repair TEST REPAIR QUALITY CONTROL Package Warehouse / Inventory Reseller Quality Control Engineering Lab ISO9001/2000 Technical Data Failure Reports AB Time to Repair MFFR Parts ODM Parts Source Parts Repair Parts In-House Repair Stock Balance Consolidate Freight To/From Source Asset Recovery Revenue Share (SCRAP)
Not Economical to Repair TEST REPAIR QUALITY CONTROL Package Warehouse / Inventory Reseller Quality Control Engineering Lab ISO9001/2000 Technical Data Failure Reports AB Time to Repair MFFR Parts ODM Parts Source Parts Repair Parts In-House Repair Stock Balance Consolidate Freight To/From Source Asset Recovery Revenue Share (SCRAP)")
17
1 2 3 4567 8 9 Compare Cost to Return on Investment Simple Example

18
Look for ways to Simplify Measure the cost for each step in the process.

19
Look for ways to Simplify Measure the cost for each step in the process. Then review options and calculate savings to reduce cost. Measure the impact of your changes.

21
Can you think of some additional Cost Concerns that were not included in this overview? Share your experience.

22
Thank You

Similar presentations


>")
 Auto copy to prod orders details Shop floor reporting Generic.>")
>")
