Download presentation
Presentation is loading. Please wait.

1
Making Statistics Talk 1 - Effective reporting of statistical results PPT1
CONTRACTOR IS ACTING UNDER A FRAMEWORK CONTRACT CONCLUDED WITH THE COMMISSION

2
Course overview Principles for writing a statistical report
Identifying and conveying the key message Using graphics to convey a statistical message Introduction to Eurostat’s ‘Flexible dashboard’ tool and other similar tools

3
Principles for writing a statistical report
Write for the audience Comprehensive coverage of data developments Refer to a body of knowledge and established frameworks The borderline between explanation and analysis

4
Statistics explained An encyclopaedia on European Union statistics;
A portal to further information for occasional and for regular users; A statistical glossary. Wiki structure designed for collaborative writing Statistical articles are proposed by an expert in a given field, but can then be reviewed easily by his/her colleague or supervisor. They can be revised by different persons under different angles, for example by a statistical expert on content, by a native English speaker on language, by a technical person on layout and presentation, and by a reviser on coherence or political correctness. Source: Statistics Explained – a user-friendly and low-cost dissemination system, Ulrich Wieland, Eurostat

5
Statistics Explained - objectives
Initial purpose is to provide full information to users about Eurostat’s data and metadata data overview, metadata and non-technical explanations - static Increasing use is to provide a primary statistics dissemination medium current information that requires more frequent update - dynamic this objective can more easily be met with less frequent statistics series Statistics Explained is an online publishing system about EU statistics which uses MediaWiki technology and resembles Wikipedia. It is a wiki-based system that presents statistical articles which together form an encyclopaedia of European statistics, completed by a glossary of the statistical concepts and terms used. In addition, numerous links are provided to the latest data and metadata and to further information, making Statistics Explained a portal for regular and occasional users alike. Less frequent statistics series are here meant annual or less.

6
Statistics explained structure
Static VS. Dynamic: the term 'Static' is meant in the sense of a static database table, i.e. updated not on a regular basis. Summary paragraph - dynamic Main statistical findings - dynamic Data sources and availability - static Context - static Further Eurostat information – direct links - static External links - static Main statistical findings highlight the most important statistical results, both through text and through graphs and tables. Data sources and availability briefly describes how the data were obtained (for example, by which survey) as well as potential limitations and problems. Context discusses reasons behind the data collection and the uses that may be made of the data; it may refer to the legal basis, the policy context, the importance for politics, business or the society as a whole. Further Eurostat information provides direct links to more detailed or more recent information on the Eurostat website including freshest data, publications, or detailed methodological information. External links to related information from other institutions and organisations. Hint: Suggest trainees to find a statistics explained page that has this structure and follow the comments while looking at it.
 as well as potential limitations and problems. Context discusses reasons behind the data collection and the uses that may be made of the data; it may refer to the legal basis, the policy context, the importance for politics, business or the society as a whole. Further Eurostat information provides direct links to more detailed or more recent information on the Eurostat website including freshest data, publications, or detailed methodological information. External links to related information from other institutions and organisations. Hint: Suggest trainees to find a statistics explained page that has this structure and follow the comments while looking at it.")
7
Statistics explained audience
Expert & non-expert users - occasional and regular visitors As with most other statistics publications Readers may not have specialist knowledge in Subject matter being covered Statistics

8
Write for your audience
Data sources and availability describes the structural characteristics of the statistics This is static information; it should not need to be edited very often Be accurate in description of concepts (the experts are reading) Explain technical terms to non-experts Referring to the glossaries
 Explain technical terms to non-experts. Referring to the glossaries.")
9
Mini-exercise – accuracy in writing
Rephrase this statement: “An increase in the general level of prices of goods and services in an economy is called inflation; it is usually measured by consumer price indices or retail price indices.” From Statistics Explained - Consumer prices - inflation and comparative price levels An increase in the general level of prices of goods and services in an economy is called inflation. One of the important inflation statistics is the consumer price index (CPI), which measures the prices of goods and services acquired, used or paid for by households. What was wrong with this statement? The statement ‘It is usually measured by’ suggests that this concept can safely be adopted as the correct measure of inflation. However, in some situations, other statistics such as GDP deflator, are more appropriate.
, which measures the prices of goods and services acquired, used or paid for by households. What was wrong with this statement The statement ‘It is usually measured by’ suggests that this concept can safely be adopted as the correct measure of inflation. However, in some situations, other statistics such as GDP deflator, are more appropriate.")
10
Data sources and availability 1
What is being measured? Refer to EU and UN manuals / regulations How measured - classification (nomenclature) and disaggregations Structure can be illustrated by graphic of weights structure Coverage of the main data series Include recent changes Data sources and frequency
 and disaggregations. Structure can be illustrated by graphic of weights structure. Coverage of the main data series. Include recent changes. Data sources and frequency.")
11
Data sources and availability 2
Explain relationship to other series, For example where survey and administrative data both exist Convey inherent variability and/or uncertainty of data, where appropriate Especially in relation to disaggregation Database metadata pages are source Major methodological explanations can be written on specific pages Inherent variability – when the change between two consecutive data releases typically show large variations, especially at disaggregated levels. Example: external trade.

12
Data sources and availability 3
Illustrate classification structure Weights of the main components of the euro area HICP – 2014 Arguments for / against showing full COICOP12? In favour – provides full information about consumption structure Against: - pie-charts with >5 items are difficult to grasp visually

13
Exercise 1 Draft two paragraphs of Data sources and availability for HICP or another statistics series of your choice (10 minutes) 10 minutes discussion

14
Context Reasons behind the data collection
Uses of the data; legal basis Policy context: politics, business, society Historical evolution of the data Long-term geographical structure Cross-refer to other data series where potential exists for inappropriate demands for data Can refer to commercial data sources E.g. private business surveys Where potential exists for inappropriate demands for data: example – geographical disaggregation of national accounts. Data sources often do not exist; compilation costs are high and interpretation can be difficult. Regional production and employment data provide alternative sources for demands for regional activity measures.

15
Exercise 2 Draft two paragraphs for the Context for HICP or another statistics series of your choice (10 minutes) 10 minutes discussion

16
Summary paragraph One or two paragraphs to summarise the static pages - data sources and availability / context Approximately 40 first words of latest posts appear on the Statistics Explained Main Page

17
Links Links provided within Eurostat website and to external websites
Links need to be organised and explained E.G. Link to Inflation in the euro area Static panel

18
Main statistical findings
Comments on most recent data – dynamic Dates need to be identifiable – file history Cover data developments comprehensively Explain the data changes without analysing external causes Check the analysis – base period, disaggregation Explain clearly Dates need to be identifiable: Release date for statistics under discussion Reference date for these statistics Update date for ‘Findings’ – since the page could potentially be altered after first release

19
Coverage of data developments
Aggregate changes (EU & Eurozone): from previous period from year before / other historical base date From trend (to be considered later) Member State comparisons as above highlight range of outcomes and trend changes Why might analysis from historical base date be misleading?
: from previous period. from year before / other historical base date. From trend (to be considered later) Member State comparisons. as above. highlight range of outcomes and trend changes. Why might analysis from historical base date be misleading")
20
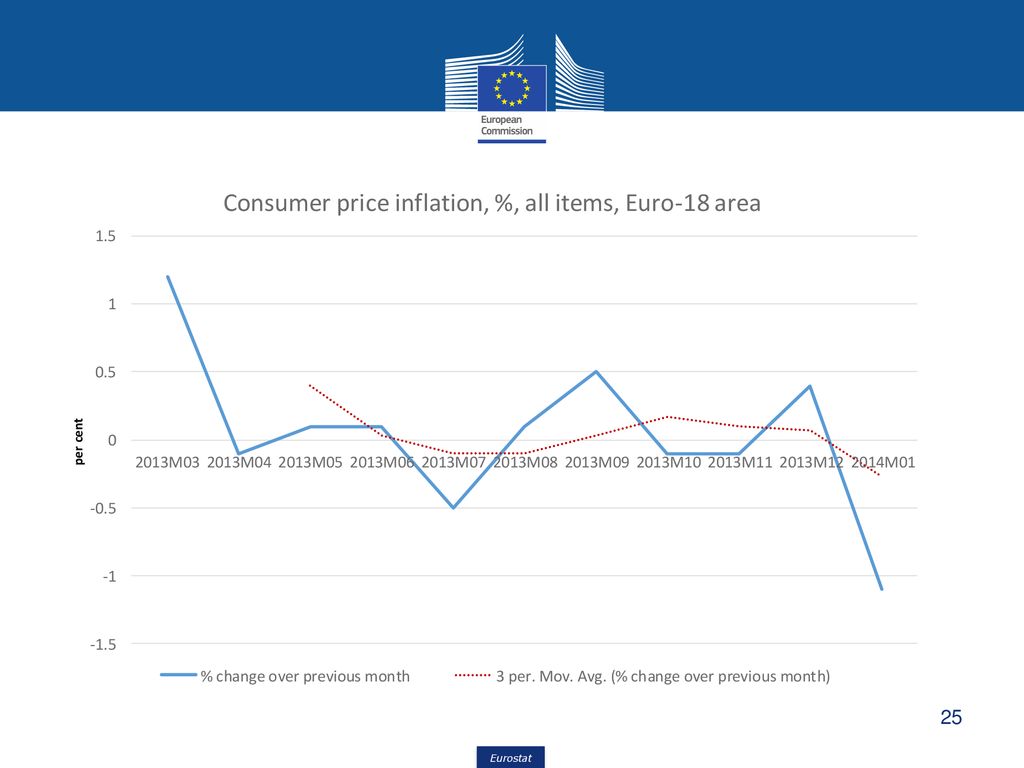
Example of data developments: HICP
geo\time 2013M03 2013M04 2013M05 2013M06 2013M07 2013M08 2013M09 2013M10 2013M11 2013M12 2014M01 M02e M/M-1 EU (28 countries) 0.9 0.1 -0.4 0.4 -0.1 0.3 -0.9 Euro area (18 countries) 1.2 -0.5 0.5 -1.1 M/M-12 1.9 1.4 1.6 1.7 1.5 1.3 1 1.1 0.7 0.8 Percentage change - 12 months average 2.4 2.3 2.2 2.1 2 1.8 HICP all items 2014M1 Link to HICP - all items CPI Consumer Price Index HICP Harmonised index of consumer prices Why might month / month-1 data be misleading? Why might month / month-12 data be misleading?
 Euro area (18 countries) M/M Percentage change - 12 months average HICP all items 2014M1. Link to HICP - all items. CPI Consumer Price Index. HICP Harmonised index of consumer prices. Why might month / month-1 data be misleading Why might month / month-12 data be misleading")
21
HICP ‘Core inflation’ to 2014M1
geo\time 2013M03 2013M04 2013M05 2013M06 2013M07 2013M08 2013M09 2013M10 2013M11 2013M12 2014M01 M02e M/M-1 EU (28 countries) 0.2 0.0 -0.6 0.6 0.1 -1.4 Euro area (18 countries) -0.9 0.7 0.3 -1.7 M/M-12 1.6 1.7 1.5 1.3 0.9 1.0 1.2 1.1 0.8 Percentage change - 12 months average 1.4 HICP ‘Overall index excluding energy, food, alcohol and tobacco’ 2014M1 Link to HICP - all items TOT_X_NRG_FOOD Overall index excluding energy, food, alcohol and tobacco
 Euro area (18 countries) M/M Percentage change - 12 months average HICP ‘Overall index excluding energy, food, alcohol and tobacco’ 2014M1. Link to HICP - all items. TOT_X_NRG_FOOD Overall index excluding energy, food, alcohol and tobacco.")
23
Financial Times 28/02/2014 Eurozone inflation firm at 0.8% in February
By Claire Jones in Frankfurt and Guy Dinmore in Rome Eurozone inflation has held firm ahead of next week’s crucial European Central Bank policy meeting, slightly easing pressure on the ECB to tackle falling inflation… Eurostat, the EU’s statistics bureau, reported on Friday that inflation remained stable at 0.8 per cent in February… Core inflation, which excludes more volatile items such as food and energy prices, rose to 1 per cent, surprising economists, who had expected it to remain at 0.8 per cent.

24
Comments Distinction press release / commentary: increase in ‘core inflation’ Look at this again under disaggregation Both look at annual data, not monthly data, which shows a different path Why is annual data the focus of attention? Why might annual data be misleading? What is the risk in imposing a trend on monthly data?

26
Financial Times – Martin Wolf
The spectre of Eurozone deflation, March 11, 2014 The European Central Bank is failing to hit its own target for price stability. … But the ECB has been far less successful in securing price stability… Its aim is to achieve inflation “below, but close to, 2 per cent over the medium term”. Yet in the year to February 2014, headline inflation was 0.8 per cent. This is hardly close to 2 per cent…. Deflation is absent: only three countries have negative inflation and only a fifth of items in the consumer price index have fallen in price.

27
Avoid contentious analysis
Do not refer to external data or other causes Martin Wolf again: … This low inflation has, as is to be expected, coincided with weak demand. In the fourth quarter of last year, eurozone real demand was 5 per cent below levels in the first quarter of In Spain, real demand fell 16 per cent. In Italy, it fell 12 per cent. Even in Germany, real demand stagnated from the second quarter of 2011: this is no locomotive. The failure to offset this has made recovery of crisis-hit economies more difficult, lowered investment and created long-term unemployment. He can do this, statisticians cannot

28
Disaggregated analysis
Examine top level disaggregation for range of outcomes Look at contribution of each component to aggregate result Small components may have higher variability than large components And may be able to be safely ignored Do the same for geographical or alternative classification

29
HICP, Euro-18, m/m changes 0.1 -0.5 0.5 -0.1 0.4 -1.1 0.6 -0.4 0.7 0.9
COICOP/TIME EU-28 Euro-18 2013M05 2013M06 2013M07 2013M08 2013M09 2013M10 2013M11 2013M12 2014M01 All-items HICP 0.1 -0.5 0.5 -0.1 0.4 -1.1 Food & non-alcohl bevergs 158.21 157.13 0.6 -0.4 0.7 Alcoholic bevrgs, tobcco … 45.57 40.44 0.9 0.3 0.2 0.0 0.8 Clothing & footwear 62.12 63.36 -1.2 -13.8 14.5 2.0 -0.2 -0.9 -15.2 Hsing, watr, electrc, gas, othr fuels 158.58 163.19 Furnishings, etc 63.43 65.97 -0.8 -0.7 Health 41.99 43.64 Transport 148.51 152.21 1.0 Communications 31.46 30.58 -0.3 Recreation and culture 100.50 94.78 1.9 -1.8 1.5 -2.5 Education 12.41 10.47 -0.6 Restaurants and hotels 89.83 91.38 Misc. goods & services 87.38 86.85 What is striking about this data? What is the consequence for aggregate inflation if the high magnitude data are a mistake?

30
Inflation m/m-1 for Member States
GEO/TIME 2013M05 2013M06 2013M07 2013M08 2013M09 2013M10 2013M11 2013M12 2014M01 EU 28 0.1 0.0 -0.4 0.4 -0.1 0.3 -0.9 Euro 18 -0.5 0.5 -1.1 Belgium -1.3 1.6 -0.2 -1.9 Bulgaria -0.3 0.2 Czech Republic Denmark Germany -0.7 Estonia 0.6 Ireland -0.6 Greece -1.6 -1.7 2.5 0.8 Spain -1.8 France Croatia Italy 1.8 -2.1 Cyprus Latvia -1.0 0.7 Lithuania Luxembourg 1.4 Hungary -0.8 Malta 1.1 -2.2 -1.5 Netherlands Austria 1.0 Poland Portugal -1.4 Romania Slovenia Slovakia Finland Sweden -1.2 United Kingdom Graph in next session

31
Volatility and accuracy
Provide sampling errors for survey-based statistics or explain why this is not done. Accuracy measures, such as flash estimate accuracy should be statistically based Maybe R2 ? Possible data issues to be treated diplomatically ‘a large but potentially reversible change in the price of clothing and footwear’

32
Summary of analysis Aggregate data changes are more important
Examine data over a reasonable period Period to period changes may be ephemeral Check that the base period data is not an outlier Examine data trends in different ways Use moving averages, fit different trend lines Look at disaggregated data changes, sceptically By classification, top level ; geographically Comprehensive coverage of changes

33
Readability Writing should be clear to non-specialists
Technical, statistical terms should be explained in text or in footnotes If necessary, in a specialised panel or (if noting else possible) its own page Refer to Eurostat’s style guides Use reading ease indicators as guide
 its own page. Refer to Eurostat’s style guides. Use reading ease indicators as guide.")
34
Reading ease indicators in Microsoft Word
File / Options / Proofing Show readability statistics / OK Reading level should be about university year 1 e.g. Flesch reading ease >30 e.g. Flesch-Kincaid grade level <=14 Alternative reading ease indicators exist Wikipedia in its article describes issues well Current statistics explained page ’Inflation in the Euro area’ scores Flesh 24.6 Flesch-Kinkaid 15.6

35
Manage your pages! Maintaining the coherent organisation of wiki pages is important The organising principle of Statistics Explained is that the technical unit is in charge of their pages The main identification of pages by Categories is not heirarchical and therefore can be duplicated The hierarchical Statistical themes page is currently incomplete Was not in original wiki plan See the following links: Inflation in the euro area Consumer prices Annual inflation and ist main component Each page is 'owned' by the statistical unit responsible for the topic. In case of cooperation between units on a subject, a responsible unit is identified after consultation. Please refer to Wieland presentation: Numerous overlapping pages exist in Wikipedia – maintaining a coherent structure is very difficult

36
Thank you CONTRACTOR IS ACTING UNDER A FRAMEWORK CONTRACT CONCLUDED WITH THE COMMISSION

Similar presentations


 in EU A quick overview Twinning project: Activity 4.1- HICP Short term.>")
,>")


