Download presentation
Presentation is loading. Please wait.

1
Acid – Base Titration Curve

2
Titration Curve A titration curve is a plot of pH vs. the amount of titrant added. Typically the titrant is a strong (completely) dissociated acid or base. Such curves are useful for determining endpoints and dissociation constants of weak acids or bases.
 dissociated acid or base. Such curves are useful for determining endpoints and dissociation constants of weak acids or bases.")
4
Features of the Strong Acid-Strong Base Titration Curve
The pH starts out low, reflecting the high [H3O+] of the strong acid and increases gradually as acid is neutralized by the added base. Suddenly the pH rises steeply. This occurs in the immediate vicinity of the equivalence point. For this type of titration the pH is 7.0 at the equivalence point. Beyond this steep portion, the pH increases slowly as more base is added.

5
HPr = Propionic Acid

6
The four Major Differences Between a Strong Acid-Strong Base Titration Curve and a Weak Acid-Strong Base Titration Curve The initial pH is higher. A gradually rising portion of the curve, called the buffer region, appears before the steep rise to the equivalence point. The pH at the equivalence point is greater than 7.00. The steep rise interval is less pronounced.

8
The four Major Differences Between a Weak Acid-Strong Base Titration Curve and a Weak Base-Strong Acid Titration Curve The initial pH is above 7.00. A gradually decreasing portion of the curve, called the buffer region, appears before a steep fall to the equivalence point. The pH at the equivalence point is less than 7.00. Thereafter, the pH decreases slowly as excess strong acid is added.

10
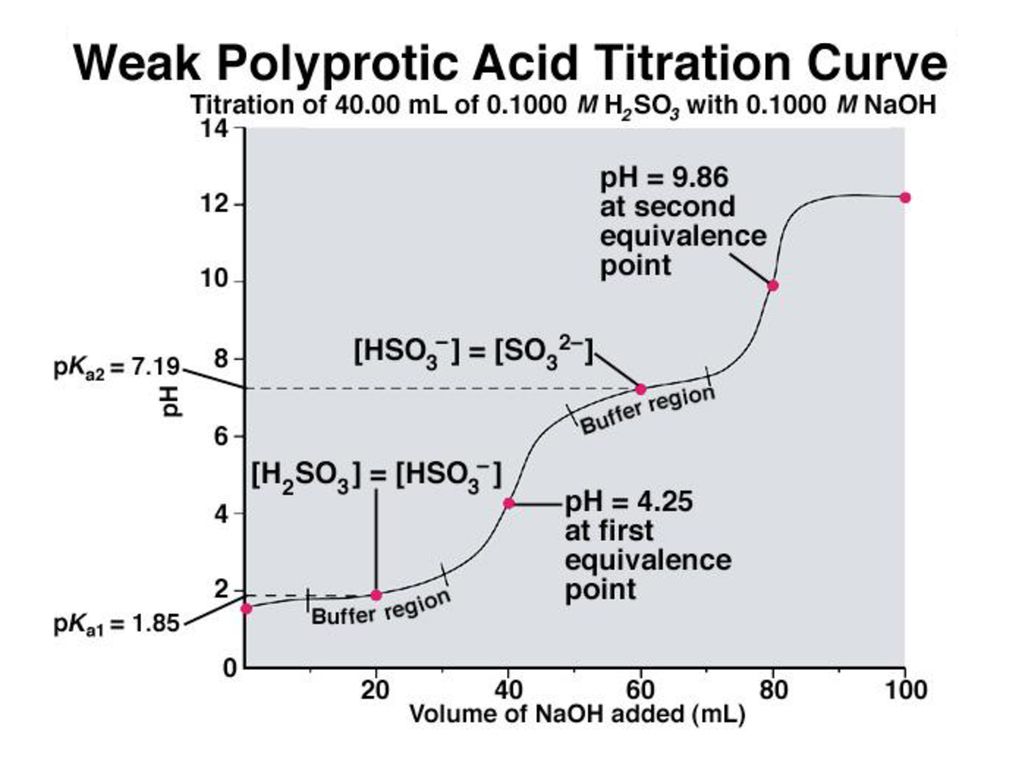
Features of the Titration of a Polyprotic Acid with a Strong Base
The loss of each mole of H+ shows up as separate equivalence point (but only if the two pKas are separated by more than 3 pK units). The pH at the midpoint of the buffer region is equal to the pKa of that acid species. The same volume of added base is required to remove each mole of H+.
. The pH at the midpoint of the buffer region is equal to the pKa of that acid species. The same volume of added base is required to remove each mole of H+.")
Similar presentations


 is when.>")


 = 4.5 x 10 -4.>")


Overview Titrations are Important tools in providing quantitative and qualitative data for a sample. To best understand.>")


