Download presentation
Presentation is loading. Please wait.

1
Markov Chains: Work Force Planning Models Section 17.7 (page 950)
Group Members: Valerie Bastian Phillip Liu Amandeep Tamber

2
Work Force Planning Can help determine the number of employees of each type available in the steady state (long term future) Steady-State Probabilities vs. Steady-State Census You can see page 950 for more explanation but basically a work force planning model is a type of markov chain that can help us determine the number of each type of employee available in the steady state. This can be used for long term planning. In the other Markov chains we have studied, we do analysis with “the steady state probabilities” but in the work force planning models, we similarly analyze something called “the steady state census” (example provided later)
")
3
Textbook example 9, continued in the section problem 2 (pg 951)
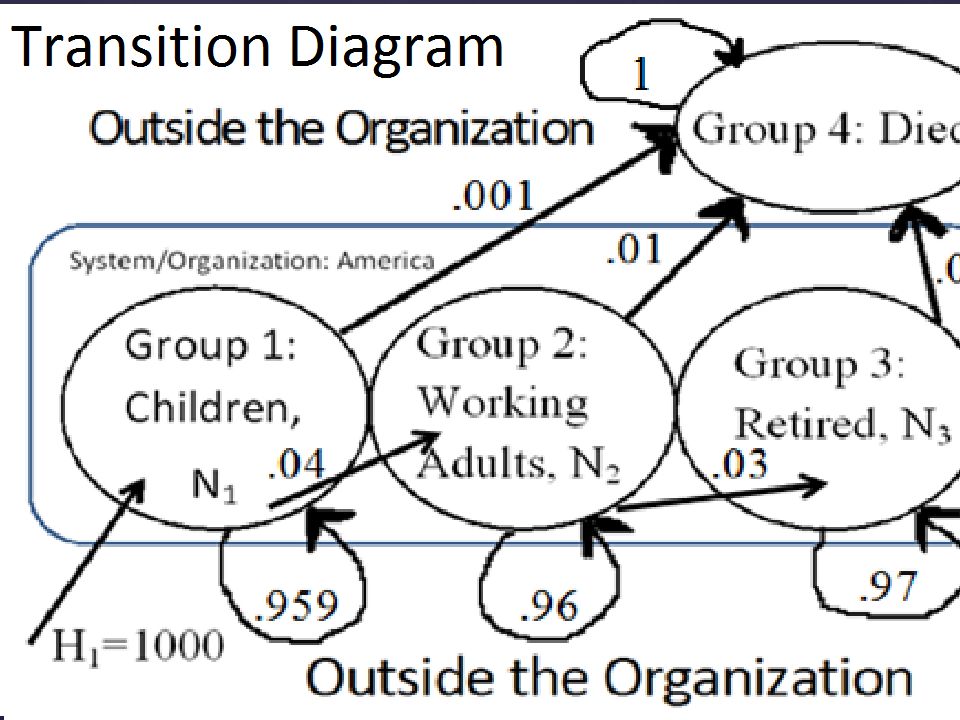
Consider the organization to have s groups America has 3 groups: Group 1: Children Group 2: Working adults Group 3: Retired There is also the s+1 group, the people who leave the organization Group 4: died So this is how we set up a work for planning type problem, first identify the organization. Then within the organization, there are s groups. Also there is an s+1 group, those who leave the organization. Go ahead and think of these groups as the “states” (like state i, state j)
")
4
In this example, the children, working adult, and retired groups are transient states, because members can either remain in that group, or become a member of a different group (from one time period to the next) However, Those who have died are in an absorbing state because once they have entered that group, they will remain there forever
 However, Those who have died are in an absorbing state because once they have entered that group, they will remain there forever.")
5
From one time period to the next, some people remain in the same group, some people enter a different group, and some people leave the organization. Use a s x (s+1) transition matrix to represent these fractions: P= 1 2 3 4 .959 .040 .001 .960 .030 .010 .950 .050 You can explain the first sentence, then explain how p-ij is the FRACTION of people who are going from i to j, NOT the probability they go or not. Then you can say uppercase P represents the entire s by s+1 matrix (in grey). Then give an example of how to read the matrix, from row to column, something like “the fraction of people who go FROM group 2 TO group 3 is 3%, so that means 3% of the working adults are retired in the next time period. You can see the fraction of people who go FROM 3 TO 2 is zero, because no retired people become working adults next time [in this model]” Even though these entries are not probabilities, this matrix is set up similarly so we can think of these “fractions of people going to and from different groups” in the same way we think of “probability of going from one state to another” just like a regular Markov chain. The same rules apply, in which each row must sum to 1. This is not because “probability must add to 1”; instead this is because 100% of the people each group need to be accounted for (whether they stay in the group, or enter a different group from one time period to the next)
. Then give an example of how to read the matrix, from row to column, something like the fraction of people who go FROM group 2 TO group 3 is 3%, so that means 3% of the working adults are retired in the next time period. You can see the fraction of people who go FROM 3 TO 2 is zero, because no retired people become working adults next time [in this model] Even though these entries are not probabilities, this matrix is set up similarly so we can think of these fractions of people going to and from different groups in the same way we think of probability of going from one state to another just like a regular Markov chain. The same rules apply, in which each row must sum to 1. This is not because probability must add to 1 ; instead this is because 100% of the people each group need to be accounted for (whether they stay in the group, or enter a different group from one time period to the next)")
6
It is traditional for an s x (s+1) transition matrix to be used for working force planning models; however it is also correct to also look at the transition matrix this way: T for a Transient State (group) A for an Absorbing State (group) P= T 1 2 3 A 4 T 1 .959 .040 .001 T 2 .960 .030 .010 T 3 .970 A 4
 A for an Absorbing State (group) P= T A. 4. T T T A 4.")
7
At the beginning of each time period:
Hi = no. of new members to group i (from outside the organization) If positive, that group is “hiring” If negative, that group is “firing” For this problem, H1=1000 H2=0 H3=0 H4 does not apply, because group 4 is not “within the organization” Self explanatory, just be clear that Hi means no. hired to group I at the beginning of the time period. Remember that “hiring and firing” means they are entering from outside the organization, or they are leaving the organization,. Also explain that we use these variables for groups 1, 2, 3,….s only. We do not consider these variables for any group outside the organization. In this example, the organization is america, which all members are in three groups (s=3) children, working adults, and the retired. The s+1 group is the dead, and they are no longer within the organization.
 If positive, that group is hiring If negative, that group is firing For this problem, H1=1000. H2=0. H3=0. H4 does not apply, because group 4 is not within the organization Self explanatory, just be clear that Hi means no. hired to group I at the beginning of the time period. Remember that hiring and firing means they are entering from outside the organization, or they are leaving the organization,. Also explain that we use these variables for groups 1, 2, 3,….s only. We do not consider these variables for any group outside the organization. In this example, the organization is america, which all members are in three groups (s=3) children, working adults, and the retired. The s+1 group is the dead, and they are no longer within the organization.")
8
Keep in mind that Hi means those who enter the organization from outside the system.
For example, the 1000 children who are born every year are not coming from any other pre-defined group. They are new members from outside the system. Once they are born, now they are within the organization (the system) because they are in group 1 (children).
 because they are in group 1 (children).")
10
or Ni = no. of members in group i (during a steady state)
As several time periods occur, (when t grows large). Each Ni will approach a limit, or All N reach the steady state census If each Ni approach a limit, it means the set of all N=(N1, N2,…..Ns) is the steady-state census of the organization Ni means no. in group I in the steady state As several periods of time occur (tt+1t+2…infinity) each Ni (the number in each group 1,2….s)will either approach a limit, or will reach a steady state. If none of the Ni’s reach a limit, then the organization has reached the steady state census. In the regular markov chains we studied the “steady state probabilities” of a state. It means the probability at which a transition enters a state j, becomes the same probability at which something leaves state j. recall this stabilization occurs in the long run. Here, “steady state census” means the number who enter a group, will equal the same number leave a group in a single time period. Again, we only consider groups 1,2,…..s, because these are groups within the organization. The group s+1 does not reach a steady state.
. Each Ni will approach a limit, or. All N reach the steady state census. If each Ni approach a limit, it means the set of all N=(N1, N2,…..Ns) is the steady-state census of the organization. Ni means no. in group I in the steady state. As several periods of time occur (tt+1t+2…infinity) each Ni (the number in each group 1,2….s)will either approach a limit, or will reach a steady state. If none of the Ni’s reach a limit, then the organization has reached the steady state census. In the regular markov chains we studied the steady state probabilities of a state. It means the probability at which a transition enters a state j, becomes the same probability at which something leaves state j. recall this stabilization occurs in the long run. Here, steady state census means the number who enter a group, will equal the same number leave a group in a single time period. Again, we only consider groups 1,2,…..s, because these are groups within the organization. The group s+1 does not reach a steady state.")
11
For this problem, N1= no. in group 1, in the steady state N2= no. in group 2, in the steady state N3= no. in group 3, in the steady state N4 does not apply, because group 4 is not “within the organization” and group 4 is an absorbing state, it will never reach a steady state census

12
Existence of Steady State Census
The steady-state census exists if: The no. people entering each group is equal to the no. of people leaving each group (within the organization, groups 1 through s only). This can be expressed mathematically… This equation is basically common sense. The number of members in each group (within the organization) have to be entering and leaving in equal numbers, or one group will “pile up”.
. This can be expressed mathematically… This equation is basically common sense. The number of members in each group (within the organization) have to be entering and leaving in equal numbers, or one group will pile up .")
13
Hi = no. of new people who enter group i from outside the organization
Entering Leaving Hi + ∑(Nk*pki) = k ≠ i Ni * ∑(pik) For all i=(1, 2, … s) Hi = no. of new people who enter group i from outside the organization Ni= no. of people in group i (during a steady state) p=fraction of people from one group to the other
 = k ≠ i. Ni * ∑(pik) For all i=(1, 2, … s) Hi = no. of new people who enter group i from outside the organization. Ni= no. of people in group i. (during a steady state) p=fraction of people from one group to the other.")
14
Children: 1,000 = (. 04 +. 001) N1 Working Adults:. 04N1 = (. 03+
Children: 1,000 = ( ) N1 Working Adults: .04N1 = ( )N2 Retired: .03N2 = .05N3 Solution: N1= 24, 390 N2= 24, N3= 14, Solution means the steady state solution exists All we did is plug in numbers. For each group within the organization (1 though s), we create this equation. Now we have a system of s equations. If the steady state census exists, there will be a solution. If the steady state census does not exist, there will be no solution. Looking at these equations, we notice given the pij’s (the fraction of people beginning in one group that begin a same/different group in one time period) and given the Hi’s, we can solve for the set of all N (the steady state census). Or given the pijs and a desired steady state census (N), we can solve for H’s (find out what hiring policy will provide this steady state). Remember that some H’s may be negative (“firing”) in order to get a steady state census. This means in the steady-state, there are 24,390 children at the beginning of each period, etc
 N1 Working Adults: .04N1 = ( )N2 Retired: .03N2 = .05N3 Solution: N1= 24, 390 N2= 24, N3= 14, Solution means the steady state solution exists All we did is plug in numbers. For each group within the organization (1 though s), we create this equation. Now we have a system of s equations. If the steady state census exists, there will be a solution. If the steady state census does not exist, there will be no solution. Looking at these equations, we notice given the pij’s (the fraction of people beginning in one group that begin a same/different group in one time period) and given the Hi’s, we can solve for the set of all N (the steady state census). Or given the pijs and a desired steady state census (N), we can solve for H’s (find out what hiring policy will provide this steady state). Remember that some H’s may be negative ( firing ) in order to get a steady state census. This means in the steady-state, there are 24,390 children at the beginning of each period, etc.")
15
Example 9 continues, given information: Each retired person receives a $5000 pension per year. The pension fund is funded by each working adult. How much money should each working adult contribute annually to the pension fund?

16
In the steady state: 14, *($5000) = $73, 170, 700 needed for all retired people $73,170,700/ 24, = $3,000 that each working adult needs to contribute each year 14,000 retired people each need $5000/yr, so a total of $73 Million/yr is needed to support all of them. That means $73M is how much all the working adults need to contribute. Since there are 24,000 working adults, this means that each person needs to contribute $3000/yr This example problem demonstrates an application of knowing SS

17
Problem 2 (pg 953) Suppose that advances in medical science have reduced the annual death rate for retired people from 5% to 3%. By how much would this increase the annual pension contribution that a working adult would have to make to the pension fund? First, we should solve for the new steady state census. Then we can use the new number of retired people and working adults to find the new contribution each working adult makes every year.

18
P= P’= 1 2 3 4 .959 .040 .001 .960 .030 .010 .970 Previous, there was matrix P, which represented the fractions of people staying in the same group, or going to another group over one time period. Since we are assuming a change in the fraction of people who move from retirement to death group, we have matrix P prime. Notice only the two fractions have changed.

19
Solution means the steady state solution exists
Children: 1,000 = ( ) N1 Working Adults: .04N1 = ( )N2 Retired: .03N2 = .03N3 Solution: N1= 24, 390 N2= 24, N3= 24, Solution means the steady state solution exists All we did is plug in the numbers, notice only one equation changes and only one value of the solution changes. With a smaller death rate for the retired, there are now more retired people in the population.
 N1. Working Adults: .04N1 = ( )N2. Retired: .03N2 = .03N3. Solution: N1= 24, 390. N2= 24, N3= 24, Solution means the steady state solution exists. All we did is plug in the numbers, notice only one equation changes and only one value of the solution changes. With a smaller death rate for the retired, there are now more retired people in the population.")
20
In the new steady state:
24, *($5000) = $121,951, needed for all retired people $ 121,951,219.5 / 24, = $5,000 that each working adult needs to contribute each year More retired people means more money is required to support them. Since the same no. of people that are working are also retired, the $5000 per retired person required, also means $5000 per working person required.
 = $121,951,219.5 needed for all retired people. $ 121,951,219.5 / 24, = $5,000 that each working adult needs to contribute each year. More retired people means more money is required to support them. Since the same no. of people that are working are also retired, the $5000 per retired person required, also means $5000 per working person required.")
21
Is this model a good representation of a population?
not a good model for population, unless you consider a constant population. But for organizations, it is a good model because it shows how many should be hired/fired to stay in the steady state. in actuality we don’t like this model…because the american population (N1+N2+N3) is not in a steady state. The constant value of 1000 birthrates can only be accurate for one time period. Once the new adults are produced, there is a limitation that they collectively produce only 1000 children. This model is good for maintaining a constant population. In reality, the number of births per year is dependent on of number of adults. There isnt really a “hiring policy” of 1000 children born to america each year. Even in china, where couples are limited to one child, the birthrate still depends on number of adults, because china has not put a max/min on number of children that should be “hired/fired”, that is enter or leave their country every year. Simply: not a good model for population unless you consider a constant population. But for organizations, it is a good model because it shows how many should be hired/fired to stay in the steady state.
 is not in a steady state. The constant value of 1000 birthrates can only be accurate for one time period. Once the new adults are produced, there is a limitation that they collectively produce only 1000 children. This model is good for maintaining a constant population. In reality, the number of births per year is dependent on of number of adults. There isnt really a hiring policy of 1000 children born to america each year. Even in china, where couples are limited to one child, the birthrate still depends on number of adults, because china has not put a max/min on number of children that should be hired/fired , that is enter or leave their country every year. Simply: not a good model for population unless you consider a constant population. But for organizations, it is a good model because it shows how many should be hired/fired to stay in the steady state.")
22
Even though the model is somewhat “flawed” in representing a population, the effect of changed death rate is a good one. We can also ask ourselves, what if we want to maintain a 3:1 ratio of working adults to retired people? How will this affect the amount each working adult needs to contribute? What does the birthrate need to be to provide this ratio? The fractions of people transitioning the same/different groups will remain the same. We need to use the new information (H1) to find out what the steady state census is in this case. Then once we know how many people are in each group, we can find out how much the working adults will need to each contribute.
 to find out what the steady state census is in this case. Then once we know how many people are in each group, we can find out how much the working adults will need to each contribute.")
23
If there are 3 working adults supporting the annual pension of one retired person $5000/3= $1, Each working adult only needs to contribute $1, every year. What is the birthrate required to support this plan? Assume a population of 63, 414 (from original problem) and 50% population working We have to assume a population because of the equations, we can either have the pijs and the H’s to find a SS or we can have the pijs and the SS (the N’s) to find the H’s. Since we are trying to find the H’s (the hiring rate, the birthrate), we need the desired SS, which is assume: a population of 60,000=N1+N2+N3, and we want 50% of the population to be working
 to find the H’s. Since we are trying to find the H’s (the hiring rate, the birthrate), we need the desired SS, which is assume: a population of 60,000=N1+N2+N3, and we want 50% of the population to be working.")
24
Desired Steady State Census:
N2=3N N1+N2+N3=63,414 N2=(.5)*63,414 N2= 31,707 N3= 10, 569 N1= 21,138
*63,414. N2= 31,707. N3= 10, 569. N1= 21,138.")
25
Solution: H1= 866.66 births/year Children: H1 = (.04 +.001) N1
Working Adults: .04N1 = ( )N2 Retired: .03N2 = .05N3 Solution: H1= births/year This solution means, we can have each working adult only contributing $1,667 per year (a small burden). We can have 50% of our population working, and we can have a steady state census. However, the birthrate will have to stay at /yr to maintain this.
N2. Retired: .03N2 = .05N3. Solution: H1= births/year. This solution means, we can have each working adult only contributing $1,667 per year (a small burden). We can have 50% of our population working, and we can have a steady state census. However, the birthrate will have to stay at /yr to maintain this.")
26
Summary Table Births per year % of population working
$ each worker contributes per year Scenario 1 1,000 38% $3000 Scenario 2 866.66 50% $1667 Scenario 3 33% $5000 Scenario 1: original ex, with 5% retired people die each year Sen 2: our model, 5% retired die each year, 50% working, and 3:1 ratio Sen 3: with the 3% retired die each year, and $5000 contribution What can this table tell us? We can only make general conclusions… One way to interpret this table, is to see how we can use the model to significantly lower the financial burden on the individual worker. However, if we compare this sen2 with the others, we are suggesting its better to not have medical advances to reduce the retirement death rate. We are suggesting a large adult population only be permitted to have so many children. Even though, this is what the math model can tell us, is this really the suggestion we want to make? From a financial standpoint we can say Sen2 is “best” based on the math model. But from an ethical standpoint we cannot really say which is “best”, because there is no “ethical data” in the table to compare them…

27
Problem 5 (pg 954) All State University Business School has faculty classified as tenured or untenured. Each year, 10% of the untenured faculty are granted tenure and 10% leave the university; 95% of tenured faculty remain, and 5% leave. The business school wants to maintain a faculty with 100 members, x% untenured. Determine a hiring policy to achieve this goal.

28
Assumptions Assume only the untenured can be hired/fired (for now)
Assume that no tenured staff member later becomes untenured. Basically assume: H1= no. of hired, untenured H2= 0 For now, we want to assume no one can be hired and automatically tenured. We assume only the untenured can be hired, and then some will later become tenured. No one can once be tenured, and then return to untenured. Just like we assume no one can be hired already tenured, we assume no tenured member can be fired

29
Identify the groups We want to look at this problem like a work-force planning model, so we need s groups within the organization: Group 1: Untenured Staff Group 2: Tenured Staff S=2 Also, the s+1 group, outside the organization: Group 3: those who leave the university

30
Create the s x (s+1) matrix:
2 x 3 matrix 1 2 3 .8 .1 .95 .05 P= Remember that the values in the matrix are NOT probabilities. They are the fraction of people that remain in same group, or go to another group over one time period, t. Notice the same rules apply, the values of each row must sum to 1, so that all members of the group are accounted for.

31
Desired Steady State Census: N1/100 =x N1+N2 = 100
N1= no. untenured N2=no. tenured Desired Steady State Census: N1/100 =x N1+N2 = 100 Untenured: H1 = (.1 +.1) N1 Tenured: (.1)N1 = (.05)N2
 N1. Tenured: (.1)N1 = (.05)N2.")
32
Solution: N1= 33.33 untenured staff N2= 66.67 tenured staff
(so x= 33.33% untenured staff) H1=6.67 untenured people hired The existence of a soln means the steady state census exists. Means the staff of 100 has 33 UT and 67 T. To maintain this steady state, hire 6.67 people as new UT every year
 H1=6.67 untenured people hired. The existence of a soln means the steady state census exists. Means the staff of 100 has 33 UT and 67 T. To maintain this steady state, hire 6.67 people as new UT every year.")
33
For what values of x does this goal require firing tenured faculty members?
33.33% untenured staff means hiring 6.67 untenured every year Any x greater than 33.33% would mean firing tenured faculty each year (that is to stay at 100 staff) In the first soln, we assumed no one from the tenured group can be hired/fired, so essentially we said that H2=0. Seeing that 33% UT staff resulted in hiring 6.67 UT every year, any value of x greater than percent would either mean a staff larger than 100, or firing some tenured staff to keep the value at 100.
 In the first soln, we assumed no one from the tenured group can be hired/fired, so essentially we said that H2=0. Seeing that 33% UT staff resulted in hiring 6.67 UT every year, any value of x greater than percent would either mean a staff larger than 100, or firing some tenured staff to keep the value at 100.")
34
Describe a hiring policy that maintains a faculty that is 10% untenured.
Desired Steady State Census: N1/100 =x N1+N2 = 100 X=10% untenured N1= 10 untenured members N2= 90 tenured members We will be considering and h2, the possibility of hiring and firing a tenured staff member

35
H1 = 18 untenured should be hired H2 = 3.5 tenured should be hired
This does not require tenured staff to be fired, because 10% < 33% Note, if we were set h2 at 0, it would mean h1 is 2 (hire 2 UT every year), however the tenured staff would not be at 90, the tenured staff would shrink below 90 (and therefore less than 100 members)
, however the tenured staff would not be at 90, the tenured staff would shrink below 90 (and therefore less than 100 members)")
36
Describe a hiring policy that maintains a faculty that is 40% untenured.
Desired Steady State Census: N1/100 =x N1+N2 = 100 X=40% untenured N1= 40 untenured members N2= 60 tenured members

37
H1 = 12 untenured should be hired
H2 = -1 tenured should be hired (one should be fired) This does require tenured staff to be fired, because 40% > 33% Note, if we were set h2 at 0, it would mean h1 is 8 (hire 8 UT every year), however the tenured staff would not be at 60, the tenured staff would grow above 60 (and therefore more than 100 members)
 This does require tenured staff to be fired, because 40% > 33% Note, if we were set h2 at 0, it would mean h1 is 8 (hire 8 UT every year), however the tenured staff would not be at 60, the tenured staff would grow above 60 (and therefore more than 100 members)")
38
Any questions on Work Force Planning Models? Thank you for listening

Similar presentations


 Options in Capital Budgeting © Pearson Education Limited 2004 Fundamentals of Financial Management, 12/e Created.>")


If you spin once, what is the probability of getting each dollar amount (fractions)? 2) If you spin twice, what is the probability.>")