Download presentation
Presentation is loading. Please wait.

1
How to Fake Data if you must Department of Statistics Rachel Fewster

2
Who wants to fake data? Electoral finance returns… Toxic emissions reports… Business tax returns…

3
Land areas of world countries: real or fake?

4
123456789123456789 IIIII III I I II I

5
Land areas of world countries: real or fake? 123456789123456789 I I III I IIII I II III 123456789123456789 IIIII III I II I

6
Land areas of world countries: real or fake? 123456789123456789 I III I IIII I II III 123456789123456789 IIIII III I II I This one seems more even… This one has as many 1s as 5-9s put together! This one is right!

7
Real land areas of world countries 123456789123456789 IIIII III I II I 11 of them begin with digits 1 – 4… Only 5 begin with digits 5 – 9…

8
Fridays Newspaper: 123456789123456789 IIII IIII III IIII II IIII II III 10 out of 34 numbers began with a 1… None out of 34 began with a 9!

9
The Curious Case of the Grimy Log-books In 1881, American astronomer Simon Newcomb noticed something funny about books of logarithm tables…

10
The Curious Case of the Grimy Log-books The books always seemed grubby on the first pages… … but clean on the last pages The first pages are for numbers beginning with digits 1 and 2… The last pages are for numbers beginning with digits 8 and 9…

11
The Curious Case of the Grimy Log-books People seemed to look up numbers beginning with 1 and 2 more often than they looked up numbers beginning with 8 and 9. Why? Because numbers beginning with 1 and 2 are MORE COMMON than numbers beginning with 8 and 9!!

12
Newcombs Law American Journal of Mathematics, 1881 30% of numbers begin with a 1 !! < 5% of numbers begin with a 9 !!

13
The First Digits… Over 30% of numbers begin with a 1 Only 5% of numbers begin with a 9

14
The First Digits… Numbers beginning with a 1 Numbers beginning with a 9 There is the same opportunity for numbers to begin with 9 as with 1 … but for some reason they dont!

15
0.301 = log 10 (2/1) 0.176 = log 10 (3/2) 0.125 = log 10 (4/3) Chance of a number starting with digit d
 = log 10 (3/2) = log 10 (4/3) Chance of a number starting with digit d")
16
Reactions to Newcombs law Nothing! …for 57 years!

17
Enter Frank Benford: 1938 Physicist with the General Electric Company Assembled over 20,000 numbers and counted their first digits! A study as wide as time and energy permitted.

18
Populations Numbers from newspapers Drainage rates of rivers Numbers from Readers Digest articles Street addresses of American Men of Science

19
About 30% begin with a 1About 5% begin with a 9

20
Benford gave the law its name… …but no explanation. Anomalou s numbers !!

21
…The logarithmic law applies to outlaw numbers that are without known relationship, rather than to those that follow an orderly course; and so the logarithmic relation is essentially a Law of Anomalous Numbers.

22
Explanations for Benfords Law Numbers from a wide range of data sources have about 30% of 1s, down to only 5% of 9s. Benford called these outlaw or anomalous numbers. They include street addresses of American Men of Science, populations, areas, numbers from magazines and newspapers. Benfords orderly numbers dont follow the law – like atomic weights and physical constants What is the explanation?

23
Popular Explanations Scale Invariance Base Invariance Complicated Measure Theory Divine choice Mystery of Nature These two say that IF there is a universal law, it must be Benfords. They dont explain why there should be a law to start with!

24
In a nutshell … If you grab numbers from all over the place (a random mix of distributions), their digit frequencies ultimately converge to Benfords Law Complicated Measure Theory
, their digit frequencies ultimately converge to Benfords Law Complicated Measure Theory")
25
Thats why THIS works well

26
It doesnt explain why street addresses of American Men of Science works well! It doesnt really explain WHAT will work well, nor why

27
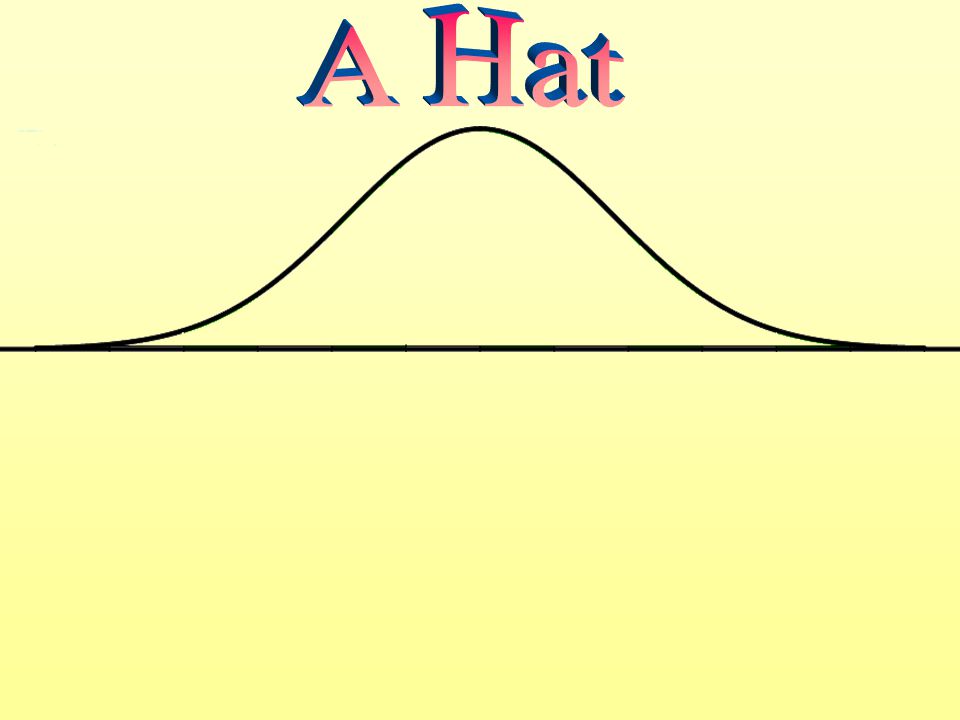
The Key Idea… If a hat is covered evenly in red and white stripes… Photo - Eric Pouhier http ://commons.wikimedia.org/wiki/Napoleon

28
The Key Idea… … it will be half red and half white. If a hat is covered evenly in red and white stripes…

31
The red stripes and the white stripes even out over the shape of the hat If the red stripes cover half the base, theyll cover about half the hat

32
What if the red stripes cover 30% of the base? 0 0.3 1 1.3 2 2.3 3 3.3 4 4.3 5 5.3 6 Then theyll cover about 30% of the hat.

33
What if the red stripes cover precisely fraction 0.301 of the base? 0.301 = log 10 (2/1) 0 0.301 1 1.301 2 2.301 3 3.301 4 4.301 5 5.301 6 Then theyll cover fraction ~0.301 of the hat.
 Then theyll cover fraction ~0.301 of the hat..")
34
Think of X as a random number… We want the probability that X has first digit = 1 Let the hat be a probability density curve for X Then AREAS on the hat give PROBABILITIES for X

35
Think of X as a random number… We want the probability that X has first digit = 1 Let the hat be a probability density curve for X Then AREAS on the hat give PROBABILITIES for X Pr(1 < X < 5) = 0.95 Area = 0.95 from 1 to 5 Total area = 1
 = 0.95 Area = 0.95 from 1 to 5 Total area = 1")
36
In the same way …. 0 0.301 1 1.301 2 2.301 3 3.301 4 4.301 5 5.301 6 If the red stripes somehow represent the X values with first digit = 1, and the red stripes have area ~ 0.301, then Pr(X has first digit 1) ~ 0.301.
 ~")
37
So X values with first digit=1 somehow lie on a set of evenly spaced stripes? Write X in Scientific Notation:

38
So X values with first digit=1 somehow lie on a set of evenly spaced stripes? Write X in Scientific Notation: r is betwee n 1 and 10 n is an integer

39
For example… r is betwee n 1 and 10 n is an integer

40
For example… For the first digit of X, only r matters!

41
For example… For the first digit of X, only r matters! 1 < r < 2 r > 2

42
Take logs to base 10… Or in other words…

43
r is betwee n 1 and 10 n is an integer

44
r is betwee n 1 and 10 n is an integer

45
r is betwee n 1 and 10 n is an integer

46
X has first digit 1 precisely when log(X) is between n and n + 0.301 for any integer n n = 0 : n = 1 : n = 2 : X from 1 to 2 X from 10 to 20 X from 100 to 200
 is between n and n for any integer n n = 0 : n = 1 : n = 2 : X from 1 to 2 X from 10 to 20 X from 100 to 200")
47
n is an integer X has first digit 1 precisely when log(X) is between n and n + 0.301 for any integer n n = 0 : n = 1 : n = 2 : STRIPES!!
 is between n and n for any integer n n = 0 : n = 1 : n = 2 : STRIPES!!")
48
n = 0 : n = 1 : n = 2 : 0 0.301 1 1.301 2 2.301 3 3.301 4 4.301 5 5.301 6 X values with first digit = 1 satisfy: and so on! The hat is the probability density curve for log(X)
.")
49
n = 0 : n = 1 : n = 2 : 0 0.301 1 1.301 2 2.301 3 3.301 4 4.301 5 5.301 6 X values with first digit = 1 satisfy: The hat is the probability density curve for log(X) X from 1 to 2 X from 10 to 20 X from 100 to 200
 X from 1 to 2 X from 10 to 20 X from 100 to 200")
50
0 0.301 1 1.301 2 2.301 3 3.301 4 4.301 5 5.301 6 So X values with first digit=1 DO lie on evenly spaced stripes, on the log scale! The PROBABILITY of getting first digit 1 is the AREA of the red stripes, ~ approx the fraction on the base, = 0.301.

51
Weve done it! Weve shown that we really should expect the first digit to be 1 about 30% of the time!

52
0 0.301 1 1.301 2 2.301 3 3.301 4 4.301 5 5.301 6 The log scale distorts: small numbers (e.g. 100) are stretched out; larger numbers (e.g. 900) are bunched up. The first digit corresponds to regularly spaced stripes on the log scale. Intuitively… So the smallest numbers (first digit = 1) are stretched out, and get the highest probability!
 are stretched out; larger numbers (e.g. 900) are bunched up. The first digit corresponds to regularly spaced stripes on the log scale. Intuitively… So the smallest numbers (first digit = 1) are stretched out, and get the highest probability!.")
53
0 0.301 1 1.301 2 2.301 3 3.301 4 4.301 5 5.301 6 We need a lot of stripes to balance out big ones and little ones! We get one stripe every integer… So we need a lot of integers! When is this going to work? The distribution of X needs to be WIDE on the log scale!

54
0 0.301 1 1.301 2 2.301 3 3.301 4 4.301 5 5.301 6 X ranges from 0 to 6 on the log scale… So it ranges from 1 to 10 6 on usual scale! When is this going to work? 1.. 2.. Miss a few... 999,999.. 1,000,000

55
0 0.301 1 1.301 2 2.301 3 3.301 4 4.301 5 5.301 6 These are Benfords Outlaw Numbers! All we need is a distribution that is: WIDE (4 – 6 orders of magnitude or more) Reasonably SMOOTH … Then the red stripes will even out to cover about 30% of the total area.
 Reasonably SMOOTH … Then the red stripes will even out to cover about 30% of the total area..")
56
In Real Life… World Populations: From 50 for the Pitcairn Islands … To 1.3 x 10 9 for China… Wide (9 integers => 9 stripes) First digits very good fit to Benford!
 First digits very good fit to Benford!")
57
In Real Life… World Populations: From 50 for the Pitcairn Islands … To 1.3 x 10 9 for China…

58
Electorate populations? From 583,000 to 773,000 in California: Of course not! All the first digits are 5, 6, or 7… The hat has less than one stripe! Benford doesnt work here.

59
But naturally occurring populations are a different story! Cities in California: - from 94 in the city of Vernon… - to 3.9 million in Los Angeles… Yes! Its Benford! Wide enough (5 integers => 5 stripes)
.")
60
Powerball Jackpots? - from $10 million to $365 million… Not bad! Orders of magnitude only 1.5 … … but sometimes you just hit lucky! Data with kind permission from www.lottostrategies.com

61
Your tax return….? If you plan to fake data, you should first check whether it ought to be Benford! BUT the IRD has a few other tricks up its sleeve too….

62
To find out more: A Simple Explanation of Benfords Law by R. M. Fewster The American Statistician, to appear. PDF from www.stat.auckland.ac.nz/~fewster/benford.html Judy Patersons CMCT course, Term 1 2009: Centre for Mathematical Content in Teaching Centre for Mathematical Content in Teaching Thanks for listening!

Similar presentations


 Prep Guide 2013>")


