Download presentation
Presentation is loading. Please wait.

1
Missing data in social networks - Problems and prospects for model-based inference Johan Koskinen johan.koskinen@manchester.ac.uk The Social Statistics Discipline Area, School of Social Sciences Mitchell Centre for Network Analysis Tuesday, 20 December 2011 @:

2
A relational perspective – networks matter Vegetarian partner x Ethical Economics Health Taste Dr D eats (predominantly) vegetarian food... Dr Dean Lushers (dlusher@swin.edu.au) relational take

3
A relational perspective – networks matter Someone close to you is unhappy...... will you remain unaffected?

4
A relational perspective – networks matter Equal opportunities based on our individual qualities......

5
A relational perspective – networks matter... bowl alone others bowl in leagues Some people...... bowl alone

6
Part 1 Network representations

7
Social networks mary paul We conceive of a network as a Relation defined on a collection of individuals relates to … go to for advice…

8
Social networks mary paul We conceive of a network as a Relation defined on a collection of individuals relates to … consider a friend…

9
Social networks mary paul We conceive of a network as a Relation defined on a collection of individuals relates to on off Generally binary Tie present Tie absent

10
Network representations A non-directed graph A social network of tertiary students – Kalish (2003)
")
11
Network representations

12
Police training squad: Confiding network (Pane, 2003)
")
13
Network representations World Trade in 1992 Plümper, 2003, JOSS

14
Network representations: attributes The actors (nodes) in the network are individuals with –attitudes, behaviours, and attributes These may –guide them in their choices of partners –be shaped (influenced) by their partners The actors may have individual and collective outcomes
 in the network are individuals with –attitudes, behaviours, and attributes These may –guide them in their choices of partners –be shaped (influenced) by their partners The actors may have individual and collective outcomes")
15
Network representations: attributes A non-directed graph A social network of tertiary students – Kalish (2003)
")
16
Network representations: attributes A non-directed graph A social network of tertiary students – Kalish (2003) JewishArab
 JewishArab")
17
Network representations: attributes High School friendship, Moody, 2001 white black other

18
Network representations: attributes Romantic/sexual relationships at a US high school (Bearman, Moody & Stovel, 2004) Guess the blue and pink
 Guess the blue and pink")
19
Network representations: attributes detachedteam orientedpositive Team structures in training squads (Pane, 2003) (friendship network in 12 th week of training)
 (friendship network in 12 th week of training)")
20
Multiple relations – entrailment, exchange, and generalized exchange Physical violence Violence & attitudes among school boys (Lusher, 2003)
")
21
Social networks We conceive of the Graph as a collection of Tie variables: {X ij : i,j V} john pete mary paul i - x ij x ik x il jx ji -x jl kx ki x kj - x kl lx li x lj x lk - x = i - 110 j 0 - 00 k 01 - 0 l 010 - =

22
Social networks We conceive of the Graph as a collection of Tie variables: {X ij : i,j V} i - x ij x ik x il jx ji -x jl kx ki x kj - x kl lx li x lj x lk - x = i - 110 j 0 - 00 k 01 - 0 l 010 - = l i j k

23
Social networks The Adjacency matrix: The matrix of the collection Tie var. {X ij : i,j V} i - x ij x ik x il jx ji -x jl kx ki x kj - x kl lx li x lj x lk - x =

24
Social networks: adjacency matrix Read Highland tribes 0 1 0 0 0 0 0 0 0 0 0 0 0 0 1 1 1 0 0 0 0 0 0 0 0 0 0 0 0 0 1 1 0 0 0 1 0 1 1 1 0 0 0 0 0 0 0 0 0 0 1 0 0 0 0 1 0 0 0 0 0 0 0 0 0 0 0 0 0 0 1 0 1 0 0 0 0 1 0 0 0 0 1 0 0 0 1 1 0 0 1 1 0 0 0 0 0 0 1 0 1 1 0 1 0 0 1 1 1 0 0 0 0 0 1 1 0 1 1 0 0 0 1 1 0 0 0 0 0 0 0 0 1 0 0 0 0 1 0 0 1 0 0 0 0 0 0 0 0 0 0 0 1 0 0 0 1 0 0 0 0 0 0 0 0 1 1 1 0 0 0 1 0 0 0 0 0 0 0 0 0 1 1 1 0 0 1 0 0 0 0 0 0 0 0 0 0 0 1 0 1 1 0 0 0 1 0 0 0 0 0 0 1 0 0 0 0 0 0 0 1 0 0 0 1 1 0 0 0 0 0 0 0 0 0 0 0 0 0 1 1 1 0 0 0 0 0 0 0 0 0 0 0 0 1 0

25
Social networks: adjacency matrix Read Highland tribes 0 1 0 0 0 0 0 0 0 0 0 0 0 0 1 1 1 0 0 0 0 0 0 0 0 0 0 0 0 0 1 1 0 0 0 1 0 1 1 1 0 0 0 0 0 0 0 0 0 0 1 0 0 0 0 1 0 0 0 0 0 0 0 0 0 0 0 0 0 0 1 0 1 0 0 0 0 1 0 0 0 0 1 0 0 0 1 1 0 0 1 1 0 0 0 0 0 0 1 0 1 1 0 1 0 0 1 1 1 0 0 0 0 0 1 1 0 1 1 0 0 0 1 1 0 0 0 0 0 0 0 0 1 0 0 0 0 1 0 0 1 0 0 0 0 0 0 0 0 0 0 0 1 0 0 0 1 0 0 0 0 0 0 0 0 1 1 1 0 0 0 1 0 0 0 0 0 0 0 0 0 1 1 1 0 0 1 0 0 0 0 0 0 0 0 0 0 0 1 0 1 1 0 0 0 1 0 0 0 0 0 0 1 0 0 0 0 0 0 0 1 0 0 0 1 1 0 0 0 0 0 0 0 0 0 0 0 0 0 1 1 1 0 0 0 0 0 0 0 0 0 0 0 0 1 0 1 1 2 11 15 16

26
Social networks: adjacency matrix Read Highland tribes 0 1 0 0 0 0 0 0 0 0 0 0 0 0 1 1 1 0 0 0 0 0 0 0 0 0 0 0 0 0 1 1 0 0 0 1 0 1 1 1 0 0 0 0 0 0 0 0 0 0 1 0 0 0 0 1 0 0 0 0 0 0 0 0 0 0 0 0 0 0 1 0 1 0 0 0 0 1 0 0 0 0 1 0 0 0 1 1 0 0 1 1 0 0 0 0 0 0 1 0 1 1 0 1 0 0 1 1 1 0 0 0 0 0 1 1 0 1 1 0 0 0 1 1 0 0 0 0 0 0 0 0 1 0 0 0 0 1 0 0 1 0 0 0 0 0 0 0 0 0 0 0 1 0 0 0 1 0 0 0 0 0 0 0 0 1 1 1 0 0 0 1 0 0 0 0 0 0 0 0 0 1 1 1 0 0 1 0 0 0 0 0 0 0 0 0 0 0 1 0 1 1 0 0 0 1 0 0 0 0 0 0 1 0 0 0 0 0 0 0 1 0 0 0 1 1 0 0 0 0 0 0 0 0 0 0 0 0 0 1 1 1 0 0 0 0 0 0 0 0 0 0 0 0 1 0 2

27
Social networks: adjacency matrix Read Highland tribes 0 1 0 0 0 0 0 0 0 0 0 0 0 0 1 1 1 0 0 0 0 0 0 0 0 0 0 0 0 0 1 1 0 0 0 1 0 1 1 1 0 0 0 0 0 0 0 0 0 0 1 0 0 0 0 1 0 0 0 0 0 0 0 0 0 0 0 0 0 0 1 0 1 0 0 0 0 1 0 0 0 0 1 0 0 0 1 1 0 0 1 1 0 0 0 0 0 0 1 0 1 1 0 1 0 0 1 1 1 0 0 0 0 0 1 1 0 1 1 0 0 0 1 1 0 0 0 0 0 0 0 0 1 0 0 0 0 1 0 0 1 0 0 0 0 0 0 0 0 0 0 0 1 0 0 0 1 0 0 0 0 0 0 0 0 1 1 1 0 0 0 1 0 0 0 0 0 0 0 0 0 1 1 1 0 0 1 0 0 0 0 0 0 0 0 0 0 0 1 0 1 1 0 0 0 1 0 0 0 0 0 0 1 0 0 0 0 0 0 0 1 0 0 0 1 1 0 0 0 0 0 0 0 0 0 0 0 0 0 1 1 1 0 0 0 0 0 0 0 0 0 0 0 0 1 0 2 Symmetric for a non-directed network

28
Social networks: adjacency matrix Read Highland tribes 0 1 0 0 0 0 0 0 0 0 0 0 0 0 1 1 1 0 0 0 0 0 0 0 0 0 0 0 0 0 1 1 0 0 0 1 0 1 1 1 0 0 0 0 0 0 0 0 0 0 1 0 0 0 0 1 0 0 0 0 0 0 0 0 0 0 0 0 0 0 1 0 1 0 0 0 0 1 0 0 0 0 1 0 0 0 1 1 0 0 1 1 0 0 0 0 0 0 1 0 1 1 0 1 0 0 1 1 1 0 0 0 0 0 1 1 0 1 1 0 0 0 1 1 0 0 0 0 0 0 0 0 1 0 0 0 0 1 0 0 1 0 0 0 0 0 0 0 0 0 0 0 1 0 0 0 1 0 0 0 0 0 0 0 0 1 1 1 0 0 0 1 0 0 0 0 0 0 0 0 0 1 1 1 0 0 1 0 0 0 0 0 0 0 0 0 0 0 1 0 1 1 0 0 0 1 0 0 0 0 0 0 1 0 0 0 0 0 0 0 1 0 0 0 1 1 0 0 0 0 0 0 0 0 0 0 0 0 0 1 1 1 0 0 0 0 0 0 0 0 0 0 0 0 1 0 10 11 9 13

29
Social networks: adjacency matrix Read Highland tribes 0 1 0 0 0 0 0 0 0 0 0 0 0 0 1 1 1 0 0 0 0 0 0 0 0 0 0 0 0 0 1 1 0 0 0 1 0 1 1 1 0 0 0 0 0 0 0 0 0 0 1 0 0 0 0 1 0 0 0 0 0 0 0 0 0 0 0 0 0 0 1 0 1 0 0 0 0 1 0 0 0 0 1 0 0 0 1 1 0 0 1 1 0 0 0 0 0 0 1 0 1 1 0 1 0 0 1 1 1 0 0 0 0 0 1 1 0 1 1 0 0 0 1 1 0 0 0 0 0 0 0 0 1 0 0 0 0 1 0 0 1 0 0 0 0 0 0 0 0 0 0 0 1 0 0 0 1 0 0 0 0 0 0 0 0 1 1 1 0 0 0 1 0 0 0 0 0 0 0 0 0 1 1 1 0 0 1 0 0 0 0 0 0 0 0 0 0 0 1 0 1 1 0 0 0 1 0 0 0 0 0 0 1 0 0 0 0 0 0 0 1 0 0 0 1 1 0 0 0 0 0 0 0 0 0 0 0 0 0 1 1 1 0 0 0 0 0 0 0 0 0 0 0 0 1 0 Zeroes along the diagonal – self ties not permitted

30
Part 2 Analysing social networks – Putting the building blocks of networks together using ERGM

31
Do we need to analyse networks? -Is the network a unique narrative? -stick to an ethnography? Possible answers -Detecting systematic tendencies -Social mechanisms -lift the description to describe network in generalizable terms

32
Networks matter – ERGMS matter 6018 grade 6 children 1966 FEMALE Male

33
Networks matter – ERGMS matter 6018 grade 6 children 1966 – 300 schools Stockholm

34
Networks matter – ERGMS matter 6018 grade 6 children 1966 – 200 schools Stockholm Koskinen and Stenberg (in press) JEBS
 JEBS")
35
Networks matter – ERGMS matter 6018 grade 6 children 1966 – 200 schools Stockholm Koskinen and Stenberg (in press) JEBS
 JEBS")
36
Networks matter – ERGMS matter 6018 grade 6 children 1966 – 200 schools Stockholm Koskinen and Stenberg (in press) JEBS
 JEBS")
37
Networks matter – ERGMS matter 6018 grade 6 children 1966 – 200 schools Stockholm Koskinen and Stenberg (in press) JEBS
 JEBS")
38
Do we need to analyse networks? -Is the network a unique narrative? -stick to an ethnography? Possible answers -Detecting systematic tendencies -Social mechanisms -lift the description to describe network in generalizable terms Conceptualising the network as a graph is what enables this

39
ERGMS – modelling graphs

41
ERGMS – modelling graphs: example Marriage network of Padgetts Florentine families

42
ERGMS – modelling graphs: example Marriage network of Padgetts Florentine families Model this as combination of 4 local structures Their importance measured by their parameters

43
ERGMS – modelling graphs: example effectMLES.E. Edge-4.141.07 2-star.97.59 3-star-.56.35 Triangle1.26.61

44
ERGMS – modelling graphs: example effectMLES.E. Edge-4.141.07 2-star.97.59 3-star-.56.35 Triangle1.26.61

45
Part 3 Modelling graphs – deriving building blocks out of dependencies

46
Independence - Deriving the ERGM l i j k m n heads tails l i l i heads tails i k i k

47
Independence - Deriving the ERGM 0.25 AUD 0.5 SEK 0.5 l i k l i k Knowledge of AUD, e.g. does not help us predict SEK e.g. whetheror

48
Independence - Deriving the ERGM i i k Knowledge of AUD, e.g.does not help us predict SEK e.g. whetheror even though dyad { i,l } l i and dyad { i,k } have vertex i in common

49
Independence - Deriving the ERGM 0.40.1 0.4 AUD 0.5 SEK 0.5 l i k l i k May we find model such that knowledge of AUD, e.g. does help us predict SEK e.g. whetheror?

50
Deriving the ERGM: From Markov graph to Dependence graph john pete mary paul Consider the tie-variables that have Mary in common How may we make these dependent?

51
Deriving the ERGM: From Markov graph to Dependence graph john pete mary paul pete mary

52
Deriving the ERGM: From Markov graph to Dependence graph john pete mary paul john pete mary

53
Deriving the ERGM: From Markov graph to Dependence graph john pete mary paul john pete mary paul mary

54
Deriving the ERGM: From Markov graph to Dependence graph john pete mary paul john pete mary paul mary pete john

55
Deriving the ERGM: From Markov graph to Dependence graph john pete mary paul john pete mary paul mary paul john pete john

56
Deriving the ERGM: From Markov graph to Dependence graph john pete mary paul john pete mary paul mary paul pete paul john pete john

57
Deriving the ERGM: From Markov graph to Dependence graph john pete mary paul m,pa pa,pe pa,j m,pe pe,j m,j The probability structure of a Markov graph is described by cliques of the dependence graph (Hammersley-Clifford)….
….")
58
Deriving the ERGM: From Markov graph to Dependence graph pete mary paul m,pa pa,pe pa,j m,pe pe,j m,j

59
Deriving the ERGM: From Markov graph to Dependence graph john pete mary paul m,pe

60
Deriving the ERGM: From Markov graph to Dependence graph john pete mary paul m,pa pa,pe pa,j m,pe pe,j m,j

61
Deriving the ERGM: From Markov graph to Dependence graph mary john pete paul m,pa pa,pe pa,j m,pe pe,j m,j

62
Deriving the ERGM: From Markov graph to Dependence graph mary john pete paul m,pe m,j

63
Deriving the ERGM: From Markov graph to Dependence graph mary john pete paul m,pa pa,pe pa,j m,pe pe,j m,j

64
Deriving the ERGM: From Markov graph to Dependence graph mary john pete paul m,pa pa,pe pa,j m,pe pe,j m,j

65
Deriving the ERGM: From Markov graph to Dependence graph mary john pete paul m,pe pe,j m,j

66
Deriving the ERGM: From Markov graph to Dependence graph mary john pete paul m,pa pa,pe pa,j m,pe pe,j m,j

67
Deriving the ERGM: From Markov graph to Dependence graph mary john pete paul m,pa pa,pe pa,j m,pe pe,j m,j

68
Deriving the ERGM: From Markov graph to Dependence graph mary john pete paul m,pa pa,j m,pe pe,j

69
Deriving the ERGM: From Markov graph to Dependence graph mary john pete paul m,pa pa,pe pa,j m,pe pe,j m,j

70
From Markov graph to Dependence graph – distinct subgraphs? too many statistics (parameters)
")
71
The homogeneity assumption = = = =

72
A log-linear model (ERGM) for ties Aggregated to a joint model for entire adjacency matrix Interaction terms in log-linear model of types
 for ties Aggregated to a joint model for entire adjacency matrix Interaction terms in log-linear model of types")
73
A log-linear model (ERGM) for ties By definition of (in-) dependence E.g. andco-occuring i j i j k i k Main effectsinteraction term More than is explained by margins

74
Part 4 Estimation of ERGM

75
Likelihood equations for exponential fam Aggregated to a joint model for entire adjacency matrix X Sum over all 2 n(n-1)/2 graphs The MLE solves the equation (cf. Lehmann, 1983):
:.")
76
Likelihood equations for exponential fam Solving Using the cumulant generating function (Corander, Dahmström, and Dahmström, 1998) Stochastic approximation (Snijders, 2002, based on Robbins-Monro, 1951) Importance sampling (Handcock, 2003; Hunter and Handcock, 2006, based on Geyer- Thompson 1992)
 Stochastic approximation (Snijders, 2002, based on Robbins-Monro, 1951) Importance sampling (Handcock, 2003; Hunter and Handcock, 2006, based on Geyer- Thompson 1992)")
77
Robbins-Monro algorithm Solving Snijders, 2002, algorithm - Initialisation phase - Main estimation - convergence check and cal. of standard errors MAIN: Draw using MCMC

78
Geyer-Thompson Solving Handcock, 2003, approximate Fisher scoring MAIN: Approximated using importance sample from MCMC

79
Bayes: dealing with likelihood The normalising constant of the posterior not essential for Bayesian inference, all we need is: … but Sum over all 2 n(n-1)/2 graphs
/2 graphs")
80
Bayes: MCMC? Consequently, in e.g. Metropolis-Hastings, acceptance probability of move to θ … which contains

81
Bayes: Linked Importance Sampler Auxiliary Variable MCMC LISA (Koskinen, 2008; Koskinen, Robins & Pattison, 2010): Based on Møller et al. (2006), we define an auxiliary variable And produce draws from the joint posterior using the proposal distributions and
, we define an auxiliary variable And produce draws from the joint posterior using the proposal distributions and.")
82
Bayes: alternative auxiliary variable LISA (Koskinen, 2008; Koskinen, Robins & Pattison, 2010): Based on Møller et al. (2006), we define an auxiliary variable Improvement: use exchange algorithm (Murray et al. 2006) Many linked chains: - Computation time - storage (memory and time issues) and Accept θ* with log-probability: Caimo & Friel, 2011
, we define an auxiliary variable Improvement: use exchange algorithm (Murray et al. 2006) Many linked chains: - Computation time - storage (memory and time issues) and Accept θ* with log-probability: Caimo & Friel,")
83
Bayes: Implications of using alternative auxiliary variable Improvement: use exchange algorithm (Murray et al. 2006) and Accept θ* with log-probability: Caimo & Friel, 2011 Storing only parameters No pre tuning – no need for good initial values Standard MCMC properties of sampler Less sensitive to near degeneracy in estimation Easier than anything else to implement QUICK and ROBUST
 and Accept θ* with log-probability: Caimo & Friel, 2011 Storing only parameters No pre tuning – no need for good initial values Standard MCMC properties of sampler Less sensitive to near degeneracy in estimation Easier than anything else to implement QUICK and ROBUST.")
84
Part 5 Types of missing data

85
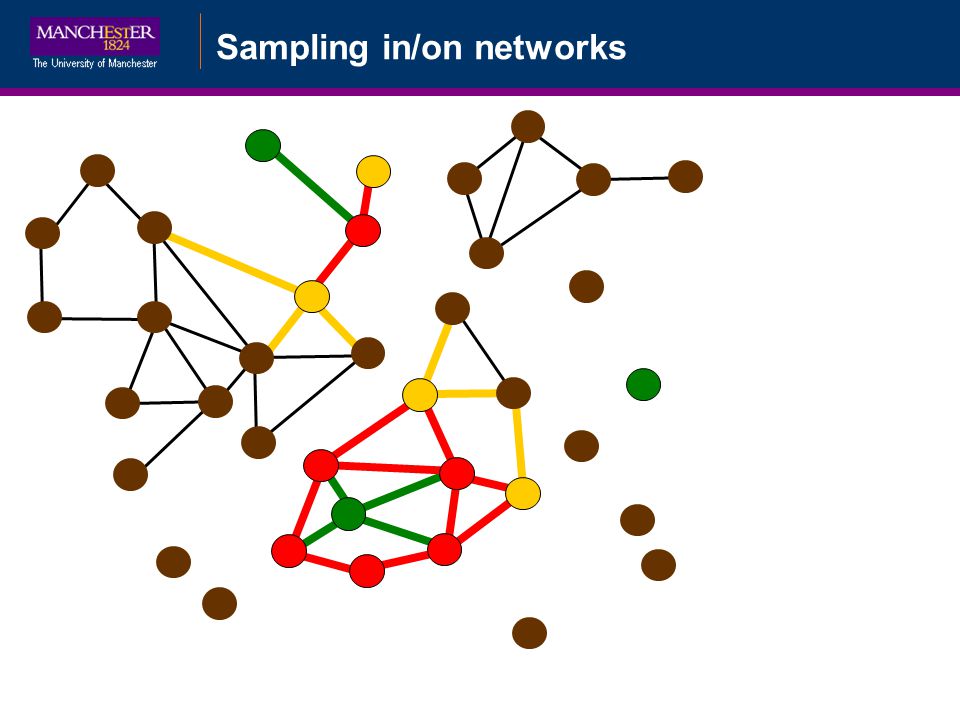
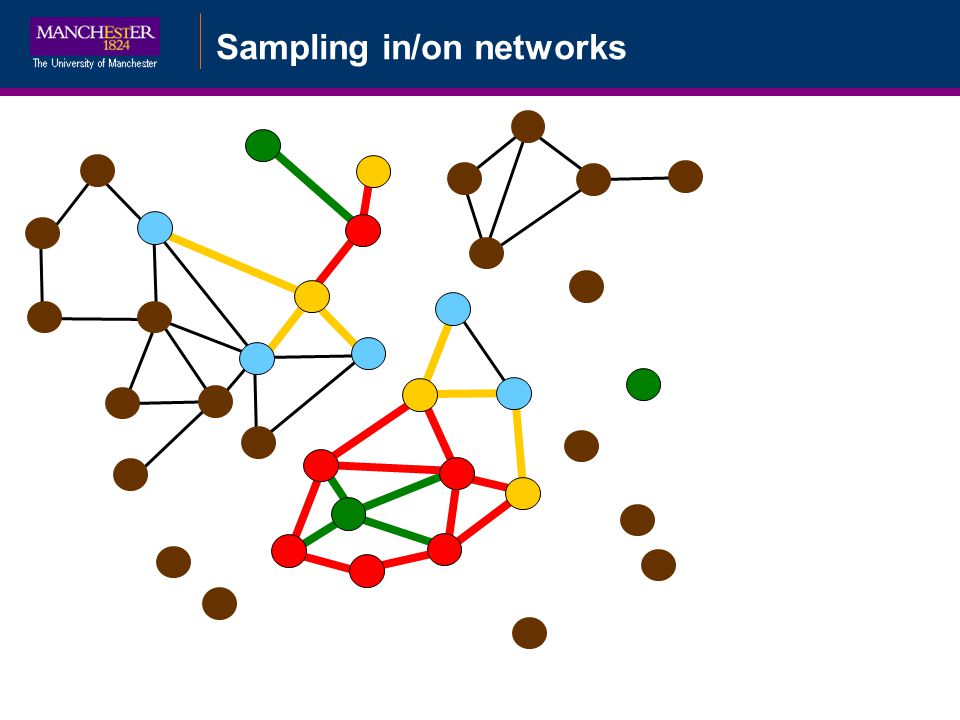
Sampling in/on networks

93
missing data observed data Sampling in/on networks

94
= 0 x = - 1 1

95
Sampling in/on networks = 0 0 1 1 x = - - 0 1 1 0 1 1

96
Sampling in/on networks = 0 0 0 1 0 1 x = - - 0 1 1 0 1 0 0 1

97
Sampling in/on networks = 0 0 0 1 0 1 0 0 0 0 0 0 0 0 x = - - 0 1 1 0 1 0 0 1

98
Sampling in/on networks = 0 0 0 1 0 1 0 0 0 0 0 0 0 0 x = - - - 0 1 0 1 0 0 - 1 0 - 1 0 0 1 1 -

99
Sampling in/on networks = 0 0 0 1 0 1 0 0 ? 0 ? 0 ? ? ? ? 0 0 0 0 x = - - - - - 0 1 ? ? 0 1 0 ? ? 0 - 1 0 ? ? - 1 ? 0 0 1 ? 1 -

100
Ignoring non-sampled? = 0 0 0 1 0 1 0 0 ? 0 ? 0 ? ? ? ? 0 0 0 0 x = - - - - - 0 1 ? ? 0 1 0 ? ? 0 - 1 0 ? ? - 1 ? 0 0 1 ? 1 -

101
What about alter – alter across ego? = 0 0 0 1 0 1 0 0 ? 0 ? 0 ? ? ? ? 0 0 0 0 x = - - - - - 0 1 ? ? 0 1 0 ? ? 0 - 1 0 ? ? - ? ? 0 0 1 ? ? -

102
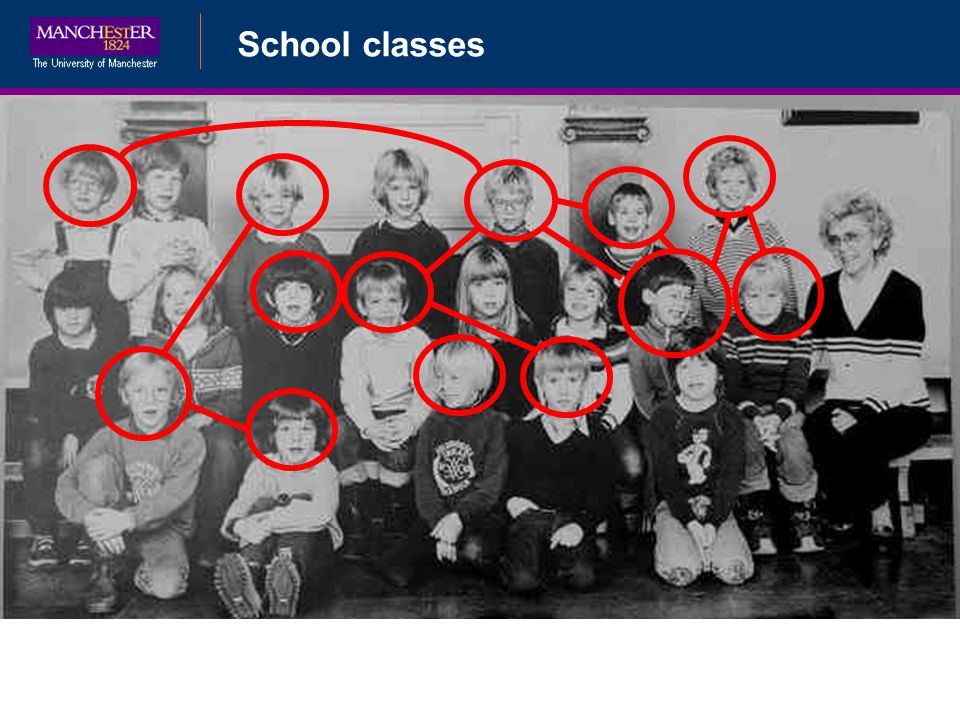
School classes

107
Multilevel attribute models If network like another level: Groups: Group indicators: Networks in groups (scaled): With random intercepts:
: With random intercepts:")
108
Empirical setup = 0 0 0 0 0 0 0 0 0 0 0 0 0 0 0 0 0 0 0 0

109
= 0 0 0 0 0 0 0 0 0 0 0 0 0 0 0 0 0 0 0 0

110
Problem of boundary specification By design – children do not nominate alters outside of school class

111
Problem of boundary specification By design – children do not nominate alters outside of school class Out of school To other school class

112
Problem of boundary specification By design – children do not nominate alters outside of school class Out of school To other school class

113
Multilevel autocorrelation/nef models = 0 0 0 0 0 0 0 0 0 0 0 0 0 0 0 0 0 0 0 0

114
= ? ? ? ? ? ? ? ? ? ? ? ? ? ? ? ? ? ? ? ?

115
Part 6 Estimation of ERGM with missing data

116
Model assisted treatment of missing network data missing data observed data If you dont have a model for what you have observed How are you going to be able to say something about what you have not observed using what you have observed

117
Model assisted treatment of missing network data Importance sampling (Handcock & Gile 2010; Koskinen, Robins & Pattison, 2010) Stochastic approximation and the missing data principle (Orchard & Woodbury,1972) (Koskinen & Snijders, forthcoming) Bayesian data augmentation (Koskinen, Robins & Pattison, 2010)
 Stochastic approximation and the missing data principle (Orchard & Woodbury,1972) (Koskinen & Snijders, forthcoming) Bayesian data augmentation (Koskinen, Robins & Pattison, 2010)")
118
What about alter – alter across ego? missing data observed data Available case analysis: pretend missing does not exist

119
The principled approach in ERGM framework missing data observed data We have to simulate the missing (complement) and pool our inferences
 and pool our inferences")
120
Subgraph of ERGM not ERGM i j k Dependence in ERGMWe may also have dependence i j l k But if k ? j We should include counts of: Marginalisation (Snijders, 2010; Koskinen et al, 2010)
.")
121
Bayesian Data Augmentation With missing data: Simulate parameters In each iteration simulate graphs missing Bayesian Data Augmentation

122
Simulate parameters With missing data: In each iteration simulate graphs missing Most likely missing given current Bayesian Data Augmentation

123
Simulate parameters With missing data: In each iteration simulate graphs missing Most likely given current missing Bayesian Data Augmentation

124
Simulate parameters With missing data: In each iteration simulate graphs missing Most likely missing given current Bayesian Data Augmentation

125
Simulate parameters With missing data: In each iteration simulate graphs missing Most likely given current missing Bayesian Data Augmentation

126
Simulate parameters With missing data: In each iteration simulate graphs missing Most likely missing given current Bayesian Data Augmentation

127
Simulate parameters With missing data: In each iteration simulate graphs missing and so on… Bayesian Data Augmentation

128
Simulate parameters With missing data: In each iteration simulate graphs missing … until Bayesian Data Augmentation

129
What does it give us? Distribution of parameters Distribution of missing data Subtle point Missing data does not depend on the parameters (we dont have to choose parameters to simulate missing) missing Bayesian Data Augmentation
 missing Bayesian Data Augmentation.")
130
What does it give us? Distribution of parameters Distribution of missing data Subtle point Missing data does not depend on the parameters (we dont have to choose parameters to simulate missing) missing Bayesian Data Augmentation
 missing Bayesian Data Augmentation.")
131
Part 7 Estimation of ERGM with missing data - Example Missing ties

132
Bayesian Data AugmentationLazegas (2001) Lawyers Collaboration network among 36 lawyers in a New England law firm (Lazega, 2001) Boston office: Hartford office: Providence off.: least senior: most senior:
 Lawyers Collaboration network among 36 lawyers in a New England law firm (Lazega, 2001) Boston office: Hartford office: Providence off.: least senior: most senior:")
133
Bayesian Data AugmentationLazegas (2001) Lawyers 133 Edges: Seniority: Practice: Homophily Sex: Office: GWESP: with 8 = log( ) Practice: Main effect t 1 : t 2 : etc. ( b i = 1, if i corporate, 0 litigation) t 3 :
 t 3 :.")
134
Bayesian Data Augmentation Lazegas (2001) Lawyers – ERGM posteriors (Koskinen, 2008)
 Lawyers – ERGM posteriors (Koskinen, 2008)")
135
Bayesian Data Augmentation Cross validation (Koskinen, Robins & Pattison, 2010) Remove 200 of the 630 dyads at random Fit inhomogeneous Bernoulli model obtain the posterior predictive tie-probabilities for the missing tie-variables Fit ERGM and obtain the posterior predictive tie- probabilities for the missing tie-variables (Koskinen et al., in press) Fit Hoffs (2008) latent variable probit model with linear predictor T z(x ij ) + w i w j T Repeat many times
 Remove 200 of the 630 dyads at random Fit inhomogeneous Bernoulli model obtain the posterior predictive tie-probabilities for the missing tie-variables Fit ERGM and obtain the posterior predictive tie- probabilities for the missing tie-variables (Koskinen et al., in press) Fit Hoffs (2008) latent variable probit model with linear predictor T z(x ij ) + w i w j T Repeat many times")
136
Bayesian Data Augmentation ROC curve for predictive probabilities combined over 20 replications (Koskinen et al. 2010)
.")
137
Bayesian Data Augmentation ROC curve for predictive probabilities combined over 20 replications (Koskinen et al. 2010)
.")
138
Bayesian Data Augmentation ROC curve for predictive probabilities combined over 20 replications (Koskinen et al. 2010)
.")
139
Part 8 Estimation of ERGM with missing data - Sampled data and covert actors

140
Bayesian Data AugmentationSnowball sampling Snowball sampling design ignorable for ERGM (Thompson and Frank, 2000, Handcock & Gile 2010; Koskinen, Robins & Pattison, 2010)... but snowball sampling rarely used when population size is known... Using the Sageman (2004) clandestine network as test-bed for unknown N
 clandestine network as test-bed for unknown N.")
141
Bayesian Data AugmentationSnowball sampling Snowball sampling design ignorable for ERGM (Thompson and Frank, 2000, Handcock & Gile 2010; Koskinen, Robins & Pattison, 2010)... but snowball sampling rarely used when population size is known... Using the Sageman (2004) clandestine network as test-bed for unknown N
 clandestine network as test-bed for unknown N.")
142
Bayesian Data Augmentationthe Sageman (2004) N = 366 network
 N = 366 network")
143
Bayesian Data Augmentationthe Sageman (2004) N = 366 network
 N = 366 network")
144
Bayesian Data Augmentationthe Sageman (2004) N = 366 network
 N = 366 network")
145
Bayesian Data Augmentationthe Sageman (2004) N = 366 network
 N = 366 network")
146
Bayesian Data Augmentationthe Sageman (2004) N = 366 network Take seed of size n = 120 Snowball out 1 wave. Additional nodes m = 160

147
Bayesian Data Augmentationthe Sageman (2004) N = 366 network Seed n = 120, first wave m = 160, N 280
 N = 366 network Seed n = 120, first wave m = 160, N 280")
148
Bayesian Data Augmentationthe Sageman (2004) N = 366 network Seed n = 120, first wave m = 160, N 280 Assume N = 281
 N = 366 network Seed n = 120, first wave m = 160, N 280 Assume N = 281")
149
Bayesian Data Augmentationthe Sageman (2004) N = 366 network Seed n = 120, first wave m = 160, N 280 Assume N = 281 N = 291
 N = 366 network Seed n = 120, first wave m = 160, N 280 Assume N = 281 N = 291")
150
Bayesian Data Augmentationthe Sageman (2004) N = 366 network Seed n = 120, first wave m = 160, N 280 Assume N = 281 N = 291 N = 301
 N = 366 network Seed n = 120, first wave m = 160, N 280 Assume N = 281 N = 291 N = 301")
151
Bayesian Data Augmentationthe Sageman (2004) N = 366 network Seed n = 120, first wave m = 160, N 280 Assume N = 281 N = 291 N = 301 N = 311
 N = 366 network Seed n = 120, first wave m = 160, N 280 Assume N = 281 N = 291 N = 301 N = 311")
152
Bayesian Data Augmentationthe Sageman (2004) N = 366 network Seed n = 120, first wave m = 160, N 280 Assume N = 281 N = 291 N = 301 N = 311... N = 391 N = 396 N = 399

153
Bayesian Data Augmentationthe Sageman (2004) N = 366 network Seed n = 120, first wave m = 160, N 280 Assume N = 281 N = 291 N = 301 N = 311... N = 391 N = 396 N = 399.95 credibility intervals N

154
Bayesian Data Augmentationthe Sageman (2004) N = 366 network Seed n = 120, first wave m = 160, N 280 Assume N = 281 N = 291 N = 301 N = 311... N = 391 N = 396 N = 399.95 credibility intervals

155
Bayesian Data Augmentationthe Sageman (2004) N = 366 network Seed n = 120, first wave m = 160, N 280 Assume N = 281 N = 291 N = 301 N = 311... N = 391 N = 396 N = 399.95 credibility intervals

156
Bayesian Data Augmentationthe Sageman (2004) N = 366 network Seed n = 120, first wave m = 160, N 280.95 prediction intervals Bernoulli ERGM obs
 N = 366 network Seed n = 120, first wave m = 160, N prediction intervals Bernoulli ERGM obs")
157
Bayesian Data Augmentationthe Sageman (2004) N = 366 network Seed n = 120, first wave m = 160, N 280.95 prediction intervals Bernoulli ERGM obs
 N = 366 network Seed n = 120, first wave m = 160, N prediction intervals Bernoulli ERGM obs")
158
Bayesian Data AugmentationSnowball sampling – Next steps We can fit and predict missing conditional on N Next: Marginalise with respect to N, and Estimate N -Use path sampler -Take combinatorics of zero block into account

159
Part 9 Further issues

160
How large networks can we allow for? Large N ERGMs do not scale up (cp missing data experiments) Lot of unobserved data – lot of unobserved covariates Computational issues – time and memory Heterogeneity…
 Lot of unobserved data – lot of unobserved covariates Computational issues – time and memory Heterogeneity….")
161
How large networks can we allow for? ERGMs typically assume homogeneity (A)Block modelling and ERGM (Koskinen, 2009) (B) Latent class ERGM (Schweingberger & Handcock)
Block modelling and ERGM (Koskinen, 2009) (B) Latent class ERGM (Schweingberger & Handcock).")
162
Solutions and future directions Ignoring unknown N : - Conditional MLE for snowball sample does not require knowledge of N (sic!) (Pattison et al., in preparation) Estimating N : - Bernoulli assumptions (Frank and Snijders, 1994 JOS) - Using ERGM and Bayes factors? (Koskinen et al., in preparation) - Using heuristic GOF; posterior predictive distributions, re-sampling and copula (?)
 - Using heuristic GOF; posterior predictive distributions, re-sampling and copula ( ).")
163
Wrap-up ERGMs - Increasingly being used - Increasingly being understood - I ncreasingly being able to handle imperfect data (also missing link prediction) Methods -Plenty of open issues -Bayes is the way of the future Legitimacy and dissemination - e.g. Lusher, Koskinen, Robins ERGMs for SN, CUP, 2011

Similar presentations


 methods>")


 Computer Science cpsc422, Lecture 11 Jan, 29, 2014.>")
>")


