Download presentation
Presentation is loading. Please wait.

1
HB 1358 Oil & Gas Production Tax Distribution Office of State Treasurer

2
TWO TAXES Gross Production Tax (GPT) - 5% Extraction Tax (ET) – 6.5% Total Tax = 11.5% HB1358 relates to Gross Production only
 - 5% Extraction Tax (ET) – 6.5% Total Tax = 11.5% HB1358 relates to Gross Production only")
3
FISCAL YEAR Fiscal Year 2014 (FY2014) – began July 1, 2013 – ends June 30, 2014 Oil Produced in July Taxes Collected in August Revenue Distributed in September to Counties/Cities/ Schools HB 1358 formula applies to distributions you received beginning September 2013
 – began July 1, 2013 – ends June 30, 2014 Oil Produced in July Taxes Collected in August Revenue Distributed in September to Counties/Cities/ Schools HB 1358 formula applies to distributions you received beginning September 2013")
4
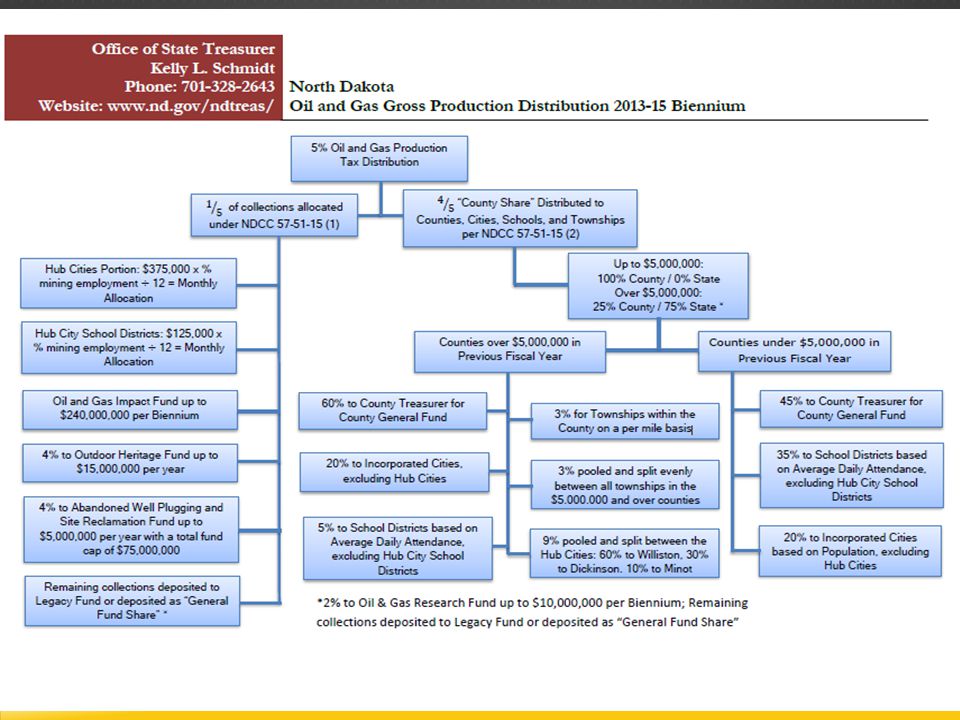
CURRENT FORMULA (HB1358) 2 tiers for split between county & state First $5 Million – 0/100 All $$ Over $5 Million - 75/25
 2 tiers for split between county & state First $5 Million – 0/100 All $$ Over $5 Million - 75/25")
5
CURRENT FORMULA (HB1358) Two distribution formulas: Counties less than $5 Million Counties over $5 Million State Treasurer does ALL allocations to cities and schools FY 2014 and later Counties responsible for handling prior year adjustments in the proper manner
 Two distribution formulas: Counties less than $5 Million Counties over $5 Million State Treasurer does ALL allocations to cities and schools FY 2014 and later Counties responsible for handling prior year adjustments in the proper manner")
6
CURRENT FORMULA (HB1358) 8 Counties Less than $5 Million FY 2013 Bottineau* Golden Valley McHenry Renville Slope Ward Mercer McLean * Bottineau County is on pace to receive over $5M in FY 2014 so will most likely move into the Greater than $5M portion of the formula for FY 2015
 8 Counties Less than $5 Million FY 2013 Bottineau* Golden Valley McHenry Renville Slope Ward Mercer McLean * Bottineau County is on pace to receive over $5M in FY 2014 so will most likely move into the Greater than $5M portion of the formula for FY 2015")
7
CURRENT FORMULA (HB1358) Counties Less than $5 Million 45% General Fund 35% Schools 20% Cities
 Counties Less than $5 Million 45% General Fund 35% Schools 20% Cities")
8
CURRENT FORMULA (HB1358) Billings Bowman Burke Divide Dunn McKenzie Mountrail Stark Williams 9 Counties Over $5 Million FY 2013 County list is subject to change in 2 nd year of biennium (Bottineau County will most likely move into this group)
 Billings Bowman Burke Divide Dunn McKenzie Mountrail Stark Williams 9 Counties Over $5 Million FY 2013 County list is subject to change in 2 nd year of biennium (Bottineau County will most likely move into this group)")
9
CURRENT FORMULA (HB1358) Counties Over $5 Million 60% General Fund 5% Schools 20% Cities 3% Townships (allocated by miles) 3% Townships (pooled & shared equally) 9% Hub Cities (pooled & split)
 Counties Over $5 Million 60% General Fund 5% Schools 20% Cities 3% Townships (allocated by miles) 3% Townships (pooled & shared equally) 9% Hub Cities (pooled & split)")
10
CURRENT FORMULA (HB1358) Counties Over $5 Million 9% to Hub Cities: Williston – 60% Dickinson – 30% Minot – 10%
 Counties Over $5 Million 9% to Hub Cities: Williston – 60% Dickinson – 30% Minot – 10%")
11
PROJECTED DISTRIBUTIONS FOR FY2014* County Total (excl. Hub) County GF Cities (excl. Hub) Schools (excl. Hub) Townships Billings $7,640,000$4,770,000$1,590,000$400,000$880,000 Bowman $10,120,000$6,410,000$2,140,000$530,000$1,040,000 Burke $8,190,000$5,080,000$1,690,000$420,000$1,000,000 Divide $14,710,000$9,410,000$3,140,000$780,000$1,380,000 Dunn $38,730,000$25,600,000$8,530,000$2,130,000$2,470,000 McKenzie $76,580,000$51,110,000$17,040,000$4,260,000$4,170,000 Mountrail $63,490,000$42,540,000$14,180,000$3,550,000$3,220,000 Stark $8,890,000$5,550,000$1,850,000$460,000$1,030,000 Williams $42,960,000$28,420,000$9,470,000$2,370,000$2,700,000 *PROJECTIONS BASED ON ACTUAL DISTRIBUTIONS THROUGH FIRST FIVE MONTHS OF FY2014, THEN USING THE NOVEMBER PRODUCTION NUMBERS FOR THE REMAINING SEVEN MONTHS.
 County GF Cities (excl. Hub) Schools (excl. Hub) Townships Billings $7,640,000$4,770,000$1,590,000$400,000$880,000 Bowman $10,120,000$6,410,000$2,140,000$530,000$1,040,000 Burke $8,190,000$5,080,000$1,690,000$420,000$1,000,000 Divide $14,710,000$9,410,000$3,140,000$780,000$1,380,000 Dunn $38,730,000$25,600,000$8,530,000$2,130,000$2,470,000 McKenzie $76,580,000$51,110,000$17,040,000$4,260,000$4,170,000 Mountrail $63,490,000$42,540,000$14,180,000$3,550,000$3,220,000 Stark $8,890,000$5,550,000$1,850,000$460,000$1,030,000 Williams $42,960,000$28,420,000$9,470,000$2,370,000$2,700,000 *PROJECTIONS BASED ON ACTUAL DISTRIBUTIONS THROUGH FIRST FIVE MONTHS OF FY2014, THEN USING THE NOVEMBER PRODUCTION NUMBERS FOR THE REMAINING SEVEN MONTHS..")
12
PROJECTED DISTRIBUTIONS FOR FY2014* - HUB CITIES City From 1/5 GPT From 4/5 GPT (9%) Williston $16,125,000$16,100,000 Dickinson $7,875,000$8,050,000 Minot $2,250,000$2,680,000 *PROJECTIONS BASED ON ACTUAL DISTRIBUTIONS THROUGH FIRST FIVE MONTHS OF FY2014, THEN USING THE NOVEMBER PRODUCTION NUMBERS FOR THE REMAINING SEVEN MONTHS.
 Williston $16,125,000$16,100,000 Dickinson $7,875,000$8,050,000 Minot $2,250,000$2,680,000 *PROJECTIONS BASED ON ACTUAL DISTRIBUTIONS THROUGH FIRST FIVE MONTHS OF FY2014, THEN USING THE NOVEMBER PRODUCTION NUMBERS FOR THE REMAINING SEVEN MONTHS.")
13
POTENTIAL FORMULA CHANGES Changing the County/State Percentage for amounts over $5 million (Currently 25%/75% County/State) Potential Changes: 50/50 60/40 County/State
 Potential Changes: 50/50 60/40 County/State")
14
POTENTIAL FORMULA CHANGES Effects of changing the allocation percentage: Counties that receive less than $5 million wouldnt see any changes Counties receiving over $5 million would see a potentially substantial increase in distributions It would take considerably longer to fill State Share buckets (ie. GF, PTRF, Disaster Relief, SIIF) As final bucket, the Strategic Investments & Improvements Fund (SIIF) would see a potentially significantly reduced total contribution
 As final bucket, the Strategic Investments & Improvements Fund (SIIF) would see a potentially significantly reduced total contribution.")
15
PROJECTED % INCREASES IF FORMULA ADJUSTED TO 50/50 County Total (excl. Hub) County GF Cities (excl. Hub) Schools (excl. Hub) Townships Billings 41%37% 72% Bowman 55%53% 75% Burke 45%41% 74% Divide 69%68% 79% Dunn 88% 87% McKenzie 94% 91% Mountrail 93% 90% Stark 49%46% 74% Williams 89% 87%
 County GF Cities (excl. Hub) Schools (excl. Hub) Townships Billings 41%37% 72% Bowman 55%53% 75% Burke 45%41% 74% Divide 69%68% 79% Dunn 88% 87% McKenzie 94% 91% Mountrail 93% 90% Stark 49%46% 74% Williams 89% 87%.")
16
PROJECTED % INCREASES IF FORMULA ADJUSTED TO 60/40 County Total (excl. Hub) County GF Cities (excl. Hub) Schools (excl. Hub) Townships Billings 58%52% 101% Bowman 78%75% 105% Burke 63%57% 103% Divide 97%95% 111% Dunn 123%124% 121% McKenzie 132% 127% Mountrail 130% 126% Stark 69%64% 104% Williams 125% 122%
 County GF Cities (excl. Hub) Schools (excl. Hub) Townships Billings 58%52% 101% Bowman 78%75% 105% Burke 63%57% 103% Divide 97%95% 111% Dunn 123%124% 121% McKenzie 132% 127% Mountrail 130% 126% Stark 69%64% 104% Williams 125% 122%.")
17
PROJECTED % INCREASES - HUB CITIES City Change to 50/50 Change to 60/40 Williston 85%119% Dickinson 85%119% Minot 85%119% *PROJECTIONS BASED ON ACTUAL DISTRIBUTIONS THROUGH FIRST FIVE MONTHS OF FY2014, THEN USING THE NOVEMBER PRODUCTION NUMBERS FOR THE REMAINING SEVEN MONTHS. Portion received from 1/5 GPT remains the same. Portion received from 4/5 GPT (9%) increases:
 increases:.")
18
HUB CITY SCHOOL DISTRICTS Would not see any increase in oil & gas distributions under this change. Currently receive: Williston - $5.375 Million/year Dickinson - $2.625 Million/year Minot - $750,000/year

19
DISTRIBUTION INFORMATION The formula flow chart and distribution amounts for Oil/Gas producing Counties, Cities and Schools can be found on the State Treasurers website at www.nd.gov/ndtreas www.nd.gov/ndtreas Various search options are available. Note: Oil/Gas was originally a quarterly distribution. Treasurer Schmidt changed this distribution to monthly in December 2007.

21
QUESTIONS ? CONTACT State Treasurer Kelly Schmidt Deputy Treasurer Jeb Oehlke Accounting Manager Ryan Skor 701-328-2643

Similar presentations


 Hainan c agGY Ia-1 (2) Anhui agGY Ia-2 (3) agGY Ia-1 2 2 WD-2 WD-8 WD-36 agGY Ia-2 3 3.>")


