Download presentation
Presentation is loading. Please wait.

1
Missouri Department of Elementary and Secondary Education
1/6/2011 MSIP 5 MARE Dr. Ron Wilken, State Supervisor Missouri Department of Elementary and Secondary Education Missouri Department of Elementary and Secondary Education February 16, 2013

2
Major MSIP 5 changes Status is three year average not five year
Eliminates 14 METS…..Uses 140 points Replaces H1, H2, AVG, BA, Floor with TARGET, ON-TRACK, APPROACHING, FLOOR New Super Subgroup designation Emphasis placed on AP & dual credit classes Measures Growth in addition to progress Considers ACT, SAT, COMPASS, & ASVAB test New Accreditation with Distinction designation Emphasis on Alg I & English I EOC at 8th grade.

3
MSIP 5 Performance Standards
Academic Achievement 2. Subgroup Achievement 3. College and Career Readiness 4. Attendance Rate 5. Graduation Rate Total Points points k points k-8

4
Status Progress Growth 16 8 56 Academic Achievement CA Science
Mathematics Science Social Studies TOTAL Status Target = 16 On Track =12 Approach =9 Floor =0 Target = 8 On Track =6 Approach =4.5 Progress Target = 12 Approach =3 Exceeds = 12 On Target =6 On Target =6 Exceeds = 6 On Target =3 Approach =1.5 Growth Points Possible 16 8 56 Subgroup Achievement Target = 4 On Track =3 Approach =2 Target = 2 On Track =1.5 Approach =1 Target = 3 On Track =2 Target = 1.5 On Track =1 Approach =.5 Points Possible 4 2 14

5
30 40 10 Status Progress Points Possible College & Career Ready CCR
* 1-3 *4 * 5-6 High School Ready HSR TOTAL Status Target= 10 On Track =7.5 Approach =6 Floor =0 Progress Target = 7.5 On Track =4 Approach =2 Points Possible 10 30 Attendance Graduation Rate 4/5/6/7 Target = 30 On Track =22.5 Approach =18 Target = 22.5 On Track =12 40

6
APR

7
APR Breakdown

8
Academic Achievement

9
Subgroup Achievement

10
College/Career Ready

11
Attendance/Graduation Rate

12
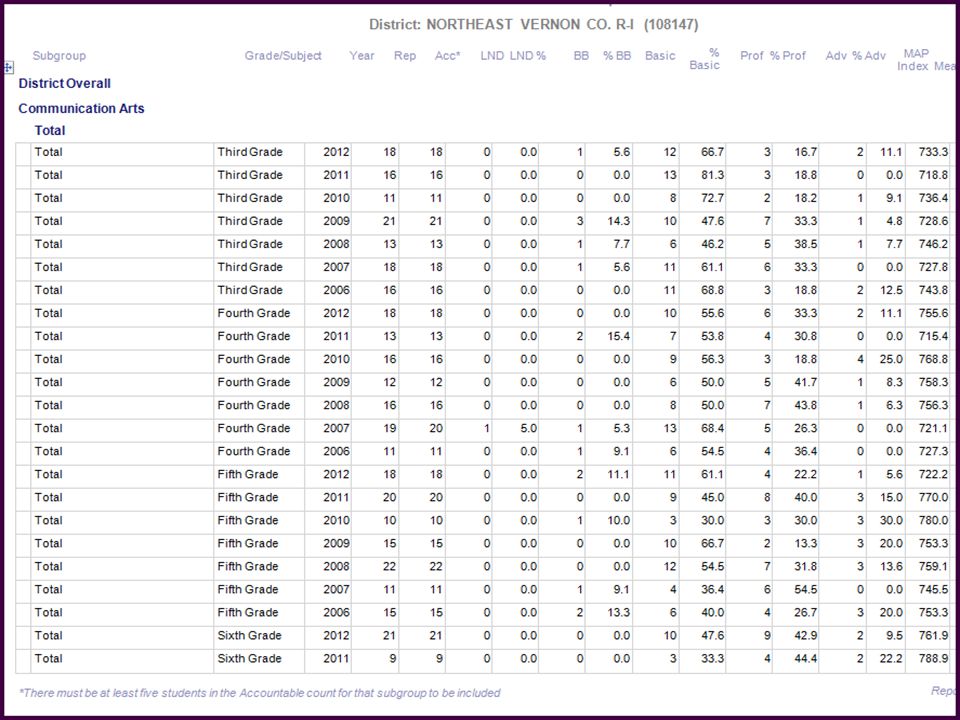
Academic Achievement - Status
Set Standardized Status Expectation for all districts. Use 3 most recent years to calculate status. Full academic year for accountability; report all students. Use an Index to calculate and add percent proficient for reporting. Achievement Level Point Value MSIP 5 Below Basic 1 Basic 3 Proficient 4 Advanced 5

13
MPI---Map Percentage Index (4th)
Achievement Level Index Point Value # of Students Index points Below Basic 6 x 25 = 150 Basic 7 35 245 Proficient 8 40 320 Advanced 9 30 270 Total Index Points 130 985 Total Index Points Total # of Students MPI 985 / 130 = 7.58 *100 758 Year 1 Year 2 Year 4 3 year total 3 year average 758 762 763 = 2283 / 3 261

15
1/6/2011 3. (K-12 only) College and Career Readiness (CCR) – The district provides adequate post-secondary preparation for all students points each grouping…30 points total. The percent of graduates who scored at or above the state standard on any department- approved measure(s) of college and career-readiness, for example, ACT®, SAT®, COMPASS® or Armed Services Vocational Aptitude Battery (ASVAB), meets or exceeds the state standard or demonstrates required improvement. The district’s average composite score(s) on any department-approved measure(s) of college and career readiness, for example, ACT®, SAT®, COMPASS® or Armed Services Vocational Aptitude Battery (ASVAB), meets or exceeds the state standard or demonstrate(s) required improvement. The percent of graduates who participated in any department-approved measure(s) of college and career readiness, for example, ACT®, SAT®, COMPASS® or Armed Services Vocational Aptitude Battery (ASVAB), meets or exceeds the state standard or demonstrates required improvement. The percent of graduates who earned a qualifying score on an Advanced Placement (AP), International Baccalaureate (IB), or Technical Skills Attainment (TSA) assessments and/or receive college credit through early college. dual enrollment, or approved dual credit courses meets or exceeds the state standard or demonstrates required improvement. The percent of graduates who attend post-secondary education/training or are in the military within six (6) months of graduating meets the state standard or demonstrates required improvement. The percent of graduates who complete career education programs approved by the department and are placed in occupations directly related to their training, continue their education, or are in the military within six (6) months of graduating meets the state standard or demonstrates required improvement,
 College and Career Readiness (CCR) – The district provides adequate post-secondary preparation for all students. 10 points each grouping…30 points total. The percent of graduates who scored at or above the state standard on any department- approved measure(s) of college and career-readiness, for example, ACT®, SAT®, COMPASS® or Armed Services Vocational Aptitude Battery (ASVAB), meets or exceeds the state standard or demonstrates required improvement. The district’s average composite score(s) on any department-approved measure(s) of college and career readiness, for example, ACT®, SAT®, COMPASS® or Armed Services Vocational Aptitude Battery (ASVAB), meets or exceeds the state standard or demonstrate(s) required improvement. The percent of graduates who participated in any department-approved measure(s) of college and career readiness, for example, ACT®, SAT®, COMPASS® or Armed Services Vocational Aptitude Battery (ASVAB), meets or exceeds the state standard or demonstrates required improvement. The percent of graduates who earned a qualifying score on an Advanced Placement (AP), International Baccalaureate (IB), or Technical Skills Attainment (TSA) assessments and/or receive college credit through early college. dual enrollment, or approved dual credit courses meets or exceeds the state standard or demonstrates required improvement. The percent of graduates who attend post-secondary education/training or are in the military within six (6) months of graduating meets the state standard or demonstrates required improvement. The percent of graduates who complete career education programs approved by the department and are placed in occupations directly related to their training, continue their education, or are in the military within six (6) months of graduating meets the state standard or demonstrates required improvement,")
16
CCR * HSR * 1

17
CCR *1-3 Status ACT SAT-R/M COMPASS ASVAB Weight
26> > NA 1.25 22> > 66M & 81R 1.00 18> > 66M OR 81R 0.75 < < <66 & < <30 NO TEST at graduation 0.25 0.00

18
CCR *1-3 Status Calculation
STEP 1- Determine the number of students scoring at or above the state standard and multiply by associated point value. No. of Graduates Points Points Earned No Score 19 x .25 24 6.0 .75 46 34.5 1.0 37 37.0 1.25 30.0 Total 150 107.5 * ACT® scores and approximately equivalent scores derived from other assessments must be equal to or greater than the ACT® anchor score in order to be included in the number of students scoring at or above the state standard.

19
CCR *4 Status 10 status/ 7.5 progress
Qualifying Score AP (any) 3 or higher IB (any) 4 or higher TSA (approved) Pass Early College College credit Dual Enrollment A or B Dual Credit (approved)
 3 or higher. IB (any) 4 or higher. TSA (approved) Pass. Early College. College credit. Dual Enrollment. A or B. Dual Credit (approved)")
20
CCR *5-6 Status 10 status/ 7.5 progress
STEP 1- Determine the number of students with recognized post-secondary placement and multiply by associated point value. No. Grads X Points Number of Graduates who attend post-secondary education 147 1.0 Number of Graduates who attend post-secondary training 118 Number of Graduates who are in the military 17 Number of Graduates who complete a Department-approved Career Education Program and are placed in an occupation directly related to their training 57 Number of Graduates Without recognized placement 46 0.0 Total 385 339

21
Attendance 10 Points possible

22
Attendance Status STEP 1- Determine the number of students with qualifying attendance and multiply by associated point value. STEP 2- Divide the number of points earned by the number of students and multiply by 100. No. of Students Points Points Earned With Attendance Rate < 90% 30 x With Attendance Rate >90% 240 1.0 Total 270 Points earned No. of Students Percent 240 / 270 = .888 x 100 88.8%

23
Graduation Rate 4, 5, 6, 7 year graduation rates will be calculated, the highest will be used.

24
Accreditation Levels Accredited With Distinction >90% of points + other criteria as determined Accredited >70% of points Provisional >50% to 69.9% of points Unaccredited < 50% of points

25
PRELIMINARY Impact 90% + 109 20.9% 205,339 23.8% 80%-89.9% 231 44.3%
Percent Total Points Earned No. of Districts Percent of Districts Cumulative Number of Students Percent of Students Cumulative Percent of Students 90% + 109 20.9% 205,339 23.8% 80%-89.9% 231 44.3% 65.3% 348,843 40.4% 64.2% 70%-79.9% 124 89.2% 157,422 18.2% 82.5% 60%-69.9% 41 7.9% 96.9% 65,225 7.6% 90.0% 50%-59.9% 9 1.7% 98.7% 28,734 3.3% 93.4% 40%-49.9% 3 0.6% 99.2% 9,123 1.1% 94.4% 0%-39.9% 4 .08% 100.0% 47,993 5.6%

29
Questions? Comments? Ron Wilken

30
1/6/2011 THANK YOU!!! Type comments here.

Similar presentations


 Implementing the Missouri Standards for Performance, Process and Resource used in the Missouri School.>")


 Florida.>")
