Download presentation
Presentation is loading. Please wait.

1
Final Findings October 2012 This survey and its analysis were supported by a grant from the Ohio DD Council, “Ohio Statewide System of Services for Early Intervention,” awarded to the Ohio Association of County Boards Serving People with Developmental Disabilities (OACB).
.")
2
EI: Early Intervention EBEI: Evidence-Based Early Intervention HMG: Help Me Grow CBDD: County Boards of Developmental Disabilities TA: Technical Assistance SC: Service Coordinator IFSP: Individualized Family Service Plan

3
Part C : The portion of the Federal Individuals with Disabilities Education Improvement Act (IDEA or IDEIA) that “assists states in operating a comprehensive statewide program of early intervention (EI) services for infants and toddlers with disabilities, ages birth through age 2 years, and their families. In order for a state to participate in the program it must assure that early intervention will be available to every eligible child and its family.” Retrieved 10/31/12 from http://www.nectac.org/partc/partc.asp#overview.http://www.nectac.org/partc/partc.asp#overview

4
OSEP sponsored TA Community of Practice- Part C Settings: www.TACommunities.orgwww.TACommunities.org Sponsored by the Office of Special Education Programs, US Dept. of Ed. This community facilitated by: National Early Childhood TA Center (NECTAC); Southeast Regional Resource Center (SERRC) and Region 6 Parent Information and Training Center (PTI) Slide taken from Key Principles and Practices for Providing EI Services in Natural Environments: Reaching Consensus. Hurth, Pletcher & Kelley, 2007.
; Southeast Regional Resource Center (SERRC) and Region 6 Parent Information and Training Center (PTI) Slide taken from Key Principles and Practices for Providing EI Services in Natural Environments: Reaching Consensus. Hurth, Pletcher & Kelley,")
5
Examine the various “models” of providing services in natural environments - how are they the same? Reach consensus on key principles (foundations) Identify the research base on effective practices Identify common practices and leanings that the research, model development projects and the “wisdom” from the field suggest Describe the agreed upon practices that are “model neutral” Describe some examples of how you would know this practice is being implemented Slide taken from Key Principles and Practices for Providing EI Services in Natural Environments: Reaching Consensus. Hurth, Pletcher & Kelley, 2007.
 Identify the research base on effective practices Identify common practices and leanings that the research, model development projects and the wisdom from the field suggest Describe the agreed upon practices that are model neutral Describe some examples of how you would know this practice is being implemented Slide taken from Key Principles and Practices for Providing EI Services in Natural Environments: Reaching Consensus. Hurth, Pletcher & Kelley,")
6
Part C early intervention builds upon and provides supports and resources to assist family members and caregivers to enhance children’s learning and development through everyday learning opportunities. Workgroup on Principles and Practices in Natural Environments OSEP TA Community of Practice – Part C Settings March 2008

7
1)Infants & toddlers learn best through everyday experiences and interactions with familiar people in familiar contexts. 2)All families, with the necessary supports and resources, can enhance their children’s learning and development. 3)The primary role of a service provider is to work with and support family members and caregivers in children’s lives. 4)The early intervention process, from initial contacts through transition, must be dynamic and individualized to reflect the child’s and family members’ preferences, learning styles and cultural beliefs. Workgroup on Principles and Practices in Natural Environments OSEP TA Community of Practice – Part C Settings March 2008
All families, with the necessary supports and resources, can enhance their children’s learning and development. 3)The primary role of a service provider is to work with and support family members and caregivers in children’s lives. 4)The early intervention process, from initial contacts through transition, must be dynamic and individualized to reflect the child’s and family members’ preferences, learning styles and cultural beliefs. Workgroup on Principles and Practices in Natural Environments OSEP TA Community of Practice – Part C Settings March")
8
5)IFSP outcomes must be functional and based on children’s and families’ needs and family-identified priorities. 6)The family’s priorities, needs and interests are addressed most appropriately by a primary provider who represents and receives team and community support. 7)Interventions with young children and family members must be based on explicit principles, validated practices, best available research, and relevant laws and regulations. Workgroup on Principles and Practices in Natural Environments OSEP TA Community of Practice – Part C Settings March 2008
The family’s priorities, needs and interests are addressed most appropriately by a primary provider who represents and receives team and community support. 7)Interventions with young children and family members must be based on explicit principles, validated practices, best available research, and relevant laws and regulations. Workgroup on Principles and Practices in Natural Environments OSEP TA Community of Practice – Part C Settings March")
9
Review of current Part C policies, practices, outcomes, funding, compliance with federal regulations, leveraging resources, and providing appropriate services to families and their children ‘The Ohio Early Childhood Cabinet recognizes that Ohio’s overall approach to Part C services and supports needs to be more clearly articulated in order to eliminate glaring disparities and be consistent through the state in what is available to eligible children and their families’ Members of workgroup: Parents; State Agencies: ODADAS, DODD, ODH, ODJFS, ODMH, ODDC, OECC, OFCF; Local FCFs; Local County Boards; Community Providers; HMG Project Directors; Ohio Help Me Grow Advisory Council; University Centers for Excellence in Developmental Disabilities; Samaritan Behavioral Health; Ohio Commission on Fatherhood

10
Recommendations from the Part C Early Intervention Workgroup of the Governor’s Early Childhood Cabinet Council (April 2010) All EI/Part C Services will be strength- and relationship-based. Assure that every family and their child who is eligible for Part C/EI services has access to federally mandated, evidence-based EI services through a core team of professionals. Maximize existing federal, state and local funding, and leverage additional funding to assure access to federally-mandated early intervention services and to implement these recommendations. Develop a system to ensure family accessibility to core team services, regardless of the political subdivision where families reside. Create a comprehensive, ongoing workforce development strategy for Part C/EI in partnership with other early childhood efforts in the state. Assure family support services and the availability of family-to-family support statewide. Provide consistent materials and public awareness messages statewide (child development, making referrals, enhancing social-emotional development, etc.). Create a state-level centralized dynamic resource of early childhood services and supports that is available to families of young children as well as to EI service providers via live staff and the internet.
. Create a state-level centralized dynamic resource of early childhood services and supports that is available to families of young children as well as to EI service providers via live staff and the internet..")
11
DODD in collaboration with the ODH utilizing ARRA funds: Collected data on how other states have made paradigm shifts in early intervention service delivery Outlined Ohio’s desire for information on how to implement a Part C system that is in line with the OSEP’s Mission and Key Principles for Providing Early Intervention Services in Natural Environments using a team approach Called for an examination of how other states have implemented EBEI practices, and a primary coach or transdisciplinary team approach to providing early intervention services to families Provided a review of the Ohio Part C System and developed recommendations about how Ohio can create a paradigm shift in early intervention in order to implement the Mission and Key Principles for Providing Early Intervention Services in Natural Environments using a team approach United Cerebral Palsy Association of Greater Chicago’s UCP Early Intervention Training Program

12
Challenges identified by the Ohio Part C Early Intervention Study (June 2011) Lack of a common statewide mission/vision and goals that provide a unique identity for the Ohio Part C system Lack of communication and coordination between state and local entities and within early intervention team Inconsistency from county to county related to services, supports, training, technical assistance opportunities and funding.
 Lack of a common statewide mission/vision and goals that provide a unique identity for the Ohio Part C system Lack of communication and coordination between state and local entities and within early intervention team Inconsistency from county to county related to services, supports, training, technical assistance opportunities and funding.")
13
Recommendations identified by the Ohio Part C Early Intervention Study (June 2011) Develop an agreed upon mission and key principles that will provide a unique identity for Ohio’s Part C system. Create regionalized systems of support to provide equitable access to training, technical assistance, monitoring and quality assurance of Ohio’s entire Part C system. Implement a web-based system that is accessible to a broad group of stakeholders and provides a real time record of child/family characteristics, IFSPs, services and billing information as well as a centralized provider database for Ohio’s Part C system. Expand current efforts to deliver Ohio Part C early intervention services utilizing a team approach to service delivery statewide. Explore and access potential sources of state, local, federal and other funding.

14
Ohio Developmental Disabilities EI Demonstration Project Grant and Advisory Council 26 teams trained by Shelden and Rush Relationships strengthened between CBDDs and HMG County Board DDs evaluated their contracts with private therapy providers CCBDDs superintendents provided evaluative and cost data to other superintendents attempting to figure out how to implement the practices or participate in trainings Many counties shifted their practices either significantly or in part-even counties that were not able to shift their entire ‘paradigm’, moved from segregated to inclusive settings or to more of a team approach, or to more functional family assessments and participatory IFSP outcomes 80% of parents strongly agreed that services provided using EBEI increased their competence and confidence in meeting the special needs of their child; 89% of parents reported they agreed or strongly agreed that the one service provider helped them understand their child A ‘leadership team of EI directors emerged and continues to meet regularly Source:

15
This is hard work. Change is not easy, especially when staff believe the current way they practice serves the family and child effectively. Leadership is the key to the successful implementation of the practices with each team. When the leadership was committed and understood the practices, the teams followed. There needs to be a high level of accountability and expectations from the upper level management to implementation of the practices in order for the practices to be continued after the training period is completed (e.g. assuring equal access to any discipline on team as PSP). The teaming through weekly team meetings was a key to the successful implementation of the practices. Even those who resisted the change in practices valued the support from the weekly team meetings. There needs to be a full continuum of technical support to offer teams in the future. The grant didn’t allow for differences in levels of support, despite the varied level of supports needed by county teams. The full continuum of support will be more effective ion affecting real and sustained change for diverse needs across the state. The turning point for staff was when they personally saw the outcomes being met. Source: Plan for Monitoring the Fidelity to Service Delivery Approach for Teams Trained as a Result of the Interagency Agreement and Recruiting Non-CBDD Providers to Participate in Early Intervention Trans-disciplinary Service Delivery in Ohio; September 30, 2011; The Ohio Department of Developmental Disabilities
. The teaming through weekly team meetings was a key to the successful implementation of the practices. Even those who resisted the change in practices valued the support from the weekly team meetings. There needs to be a full continuum of technical support to offer teams in the future. The grant didn’t allow for differences in levels of support, despite the varied level of supports needed by county teams. The full continuum of support will be more effective ion affecting real and sustained change for diverse needs across the state. The turning point for staff was when they personally saw the outcomes being met. Source: Plan for Monitoring the Fidelity to Service Delivery Approach for Teams Trained as a Result of the Interagency Agreement and Recruiting Non-CBDD Providers to Participate in Early Intervention Trans-disciplinary Service Delivery in Ohio; September 30, 2011; The Ohio Department of Developmental Disabilities.")
16
Five-year project funded by the Ohio Developmental Disabilities Council in January 2012, with Ohio Association of County Boards of Developmental Disabilities (OACB) serving as fiscal agent. Major activities: Identify 3 or more areas of the state where EBEI services are not available or accessible and readiness and interest exists. Develop networks of regional support that will facilitate local collaboration of core team provision of EI services in underserved areas. Network and build upon existing TA efforts to provide consistent quality training for sustainability and fidelity. Network with state leadership and TA to do public awareness to reach the medical community, families and community providers. Work with state and local stakeholders to find funding mechanisms that both incentivize and maintain EBEI services. Work in collaboration with FIN of Ohio to establish family supports as a primary function within Ohio’s EBEI service delivery system.

17
To give us a baseline snapshot of Early Intervention across the state from the perspective of all 88 counties in relation to a ) Part C b) The mission & principles of Part C EBEI c) The recommendations from Ohio’s 2010 Part C Workgroup d) The 2011 Part C Study e) Recommendations from Ohio HMG Advisory Council (ICC) f) Ohio County Board Core Team (without service coordinator ) survey & map g) Information from first DD Council grant To identify counties who might be interested in partnering with the project to develop, enhance and sustain EBEI for eligible infants and toddlers and their families.
 Part C b) The mission & principles of Part C EBEI c) The recommendations from Ohio’s 2010 Part C Workgroup d) The 2011 Part C Study e) Recommendations from Ohio HMG Advisory Council (ICC) f) Ohio County Board Core Team (without service coordinator ) survey & map g) Information from first DD Council grant To identify counties who might be interested in partnering with the project to develop, enhance and sustain EBEI for eligible infants and toddlers and their families.")
18
A. Combination of 46 closed and open-ended questions B. Five areas of focus: 1. Is there a full team of professionals available for children and families ? (EQUAL ACCESS) 2. How are services delivered ? (EBEI AND CONSISTENCY) 3. What expertise and TA capacity is available in the area? (WORKFORCE DEVELOPMENT) 4. How is family support addressed? (PART C MISSION) 5. What has happened in the last five years? What about the next five years? (WILLINGNESS AND READINESS TO CHANGE)
 2. How are services delivered . (EBEI AND CONSISTENCY) 3. What expertise and TA capacity is available in the area. (WORKFORCE DEVELOPMENT) 4. How is family support addressed. (PART C MISSION) 5. What has happened in the last five years. What about the next five years. (WILLINGNESS AND READINESS TO CHANGE).")
19
Survey Monkey link, with cover letter from the DD Council, distributed statewide to HMG Project Directors and CBDD Superintendents Follow-up emails and phone calls from project staff Three options for survey completion: 1. Complete online 2. Complete hard copy & fax to project staff 3. Complete over the phone with project staff

20
Survey Monkey data downloaded to Excel spreadsheet Closed-ended questions analyzed via Excel and/or SPSS If more than one response per county: Where possible and appropriate given the question, multiple responses within a county were aggregated/averaged into a single response for the county, i.e., N = X counties Otherwise, N = number of individual responses Open-ended questions analyzed using qualitative methodology Several of the open-ended questions were primarily used to identify potential partners, and will not be reported in this presentation (Questions 6,23, and 29)
")
21
Questions 1 & 2

22
22 GOAL FOR BOTH DD COUNTY BOARDS AND HMG TO PARTICIPATE SHORT TURNAROUND REAL TIME INFORMATION INCLUDE EVERY COUNTY: EVERY MEANT EVERY

23
ALL of Ohio’s 88 counties were represented 101 individuals responded 75 counties had one response Either one person who responded, or 2 or more persons who completed the survey collectively as a group) 13 counties had 2 individual responses “We’ll do whatever it takes to get the info!” Project staff, 2012
 13 counties had 2 individual responses We’ll do whatever it takes to get the info! Project staff, 2012")
24
UNION ASHTABULA BELMONT BUTLER CARROLL CLARK COLUMBIANA COSHOCTON CUYAHOGA DARKE DELAWARE FAIRFIELD FRANKLIN GEAUGA GREENE GUERNSEY HAMILTON HARRISON HOLMES HURON KNOX LAKE LICKING LOGAN LORAIN MAHONING MEDINA MIAMI MONROE MORGAN NOBLE PERRY PORTAGE PREBLE SHELBY STARK SUMMIT TRUMBULL ADAMS ATHENS BROWN CLINTON FAYETTE GALLIA HIGHLAND HOCKING JACKSON LAWRENCE MEIGS PICKAWAY PIKE ROSS SCIOTO VINTON WARREN WASHINGTON WAYNE CLERMONT MONTGOMERY JEFFERSON MADISON RICHLAND ASH- LAND TUSCARAWAS MUSKINGUM FULTON ALLEN CRAWFORD DEFIANCE ERIE HANCOCK HARDIN HENRY MARION OTTAWA PAULDING PUTNAM SANDUSKY SENECA VAN WERT WILLIAMS WOOD WYANDOT LUCAS CHAMPAIGN MORROW AUGLAIZEMERCER 1 response per county 2 responses per county

25
HMG Project Director HMG Supervisor/ Other HMG Position CBDD EI Administrator/ Supervisor CBDD Superintendent Other (e.g., EI Specialist) Number of responses N = 97 participants
 Number of responses N = 97 participants")
26
Questions 3 - 5, 7, 9 - 17

27
Total: 15,612 Min – Max: 14 – 2400 Average: 185.9 * If more than one respondent per county, responses were averaged into single county response. N = 84 counties

28
Total SCs: 345.6 (N = 82 counties) Total Number of Unfilled Positions: 12 (N = 69 counties) Average Caseload: 41.1 (Range: 10 – 75, N = 68 counties) * If more than one respondent per county, responses were averaged into single county response.
 Total Number of Unfilled Positions: 12 (N = 69 counties) Average Caseload: 41.1 (Range: 10 – 75, N = 68 counties) * If more than one respondent per county, responses were averaged into single county response.")
29
* If more than one respondent per county, responses were averaged into single county response. N = 68 counties

30
N = 84 counties

31
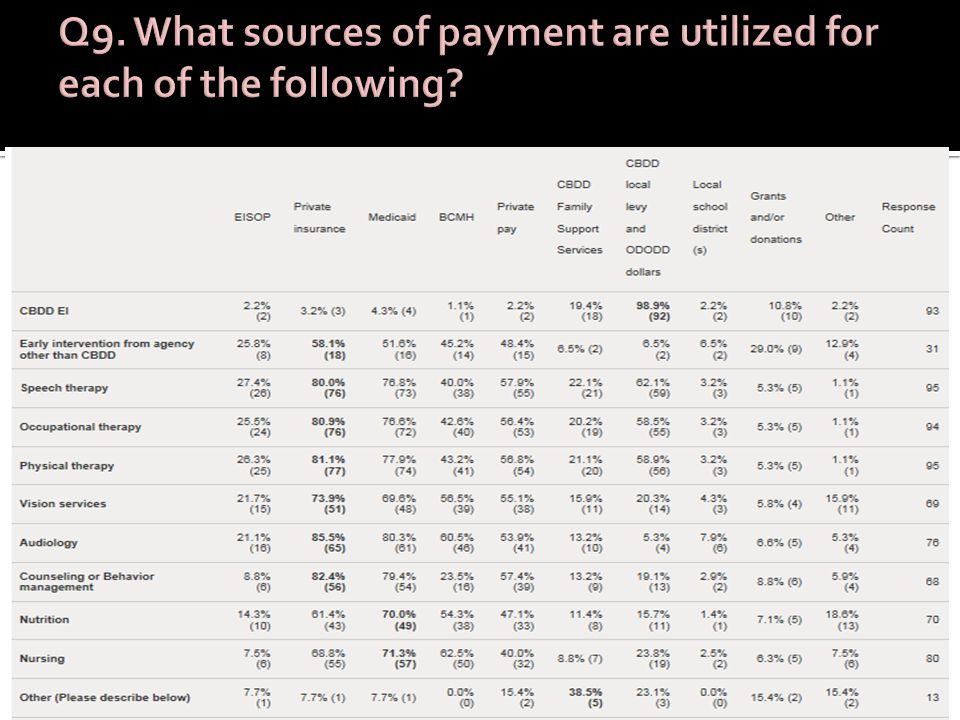
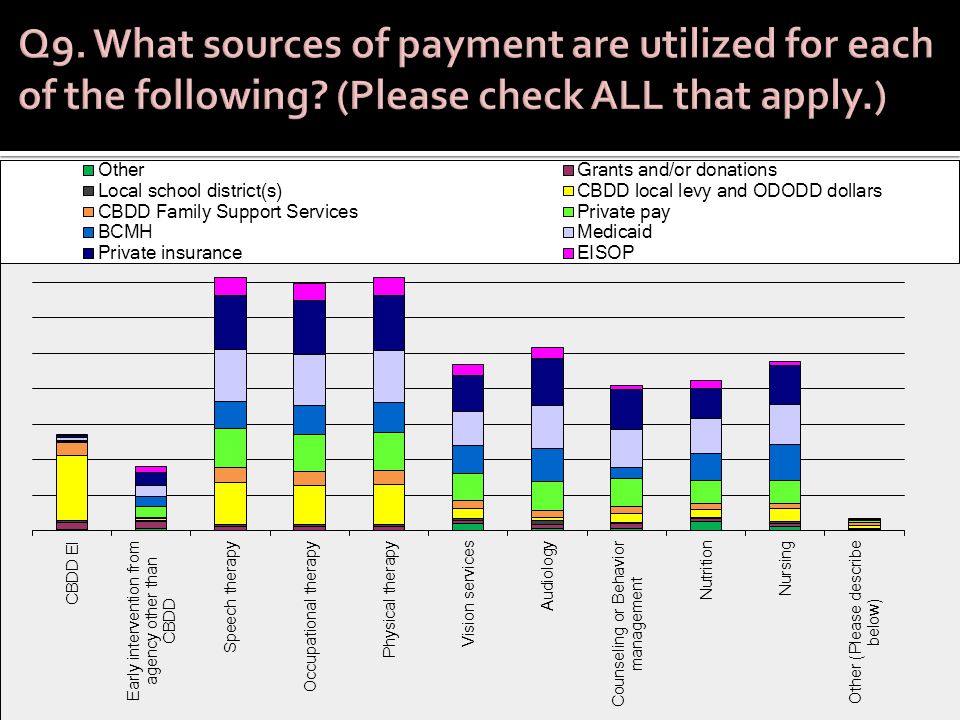
Question 7. Families in your county may go many different places to access services for their child who is eligible for Part C. Some may be in your county; others may be across county lines. Some may use a more traditional medical model framework; others may be using an approach that emphasizes teaching/coaching families instead of working directly with the child. Please describe the options that you've seen families use. Check ALL that apply for each agency/setting. (In other words, we'd like you to work your way across the entire row!)
.")
33
Other? (most to least frequently mentioned) Regional Infant Hearing Program (RIHP) Early Head Start Home Health Services Respite Services Chiropractic Services Medical Support Services
 Regional Infant Hearing Program (RIHP) Early Head Start Home Health Services Respite Services Chiropractic Services Medical Support Services.")
34
Based on total number of responses for each service option Service options accessed by families

35
Based on total number of responses for each service option Locations of service options accessed by families

36
Based on total number of responses for each service option Models of service options accessed by families

38
Examples of “Other”: WIC Waivers Mental health levy dollars

40
Number of responses

42
* If more than one respondent per county, responses were aggregated into single county response. N = 87 counties

43
Total: 11,847 Min – Max: 8 – 1500 Average: 141 * If more than one respondent per county, responses were averaged into single county response. N = 85 counties

44
Percentage of families seeking additional services Number of counties Average across all respondents: 26.44%, but significant variation across counties.

45
N = 94 responses N% Full-time all-year round, with specific mention of flexible hours to accommodate families 4346% Full-time, all-year round, no mention of flexibility 2729% Full-time during “school year” with summer reductions 1213% Part-time: fewer than 37.5 hours or 5 days per week 88% “Unsure” or response was unclear 44%

46
Examples from the continuum of responses: “35 hours a week; 42 weeks a year ” “184 days a year; 5 days a week, and hours are 8:30-4 but flexible to accommodate families” “___BDD offers EI services year round and has flexible hours so we can meet the needs of families being served.” “The ___BDD operates EI services 52 weeks a year. Services are provided at the convenience of the family which means we are often operating 12-15 hours per day. We flex schedules so services are always available. Services have been provided on Saturdays when necessary. So far, we have managed to keep Sundays free of visits. However, if a family needs visits on Sundays we would accommodate them.”

47
People answered this question in many different ways, so it is impossible to analyze in terms of FTEs We are able to report the % of counties who reported that discipline working in their CBDD EI program The counties without a CBDD EI program were removed from the aggregate results Reported as “Other”: Service Coordinator, OTA, PTA, Family Support Specialist, Supervisor

48
* If more than one respondent per county, responses were aggregated into single county response. N = 82 counties

50
N = 95 responses

51
Questions 18 - 28

52
Overall “flow” is similar, but differences in details CBDDs frequently involved in some way The majority of evaluations and assessments take place in the home (unless parent chooses otherwise) Make-up of team varies across counties Some counties: Same team for all families Others: Make-up varies based on needs of family & child
 Make-up of team varies across counties Some counties: Same team for all families Others: Make-up varies based on needs of family & child")
53
Location # of Counties % of all Counties* In the home8596.6% In the community6270.5% In child care settings5663.6% In Early Head Start2225% In the CBDD center4753.4% Other (e.g., HMG site, LEA, other community agency) 66.8% Analysis based on all responses aggregated into 88 counties. Since CBDD EI services are not available in all counties, the percentage can never be 100%.

54
Examples of “Other”: TEACCH, Floortime, Brigance, TouchPoints * If more than one respondent per county, responses were aggregated into single county response. N = 84 counties

55
Number of Curricula Identified

56
Examples from the continuum of responses: “We use a variety of different resources. We identify what the family and child's priorities and needs are and discuss what services and strategies that would be most helpful for them to use within the home during their daily routines.” “I'm not sure what our EIS uses. HMG makes sure that the EIS receives copies of the IFSP, Battelle booklet and Battelle report so she has that information to assist her.” “Strategies and ideas used are sometimes at the suggestion or recommendation of therapists or specialists who work with the child.”

57
Examples from the continuum of responses: “Whatever needs are for child and family depending on the IFSP. Families are involved in the planning. Work on what testing shows child needs. Whatever is necessary for child.” “We use the ELAP for program planning. The strategies and ideas come from discussions with the families and on their needs.” “The ELAP is used for program planning. Strategies and ideas are generated from discussion with the families and based on their needs.” “A curricula is not really appropriate when using coaching.” “Rush and Shelden not really a curriculum but we use their guides as a reference.”

58
e.g., based on need, weekly center/monthly home, once every 60 days N = 95 responses

60
* If more than one respondent per county, responses were aggregated into single county response. N = 88 counties

62
N = 87 responses

63
Responses were coded based on four categories: 1) Child Tools Only: e.g., “Bayley, HELP and recommendations from therapists” 2) Child Tools + Discussion with Family: e.g., “Evaluation results, medical history, therapy reports, and most importantly concerns of the parent” 3) Child Tools + Family Tools + Discussion: e.g., “ We use information from the screenings, assessment, RBI, observations, input from other service providers, and (most importantly) conversations with families about needs, concerns and priorities” 4) No Tools Mentioned: e.g., “Team approach including family members”
 Child Tools Only: e.g., Bayley, HELP and recommendations from therapists 2) Child Tools + Discussion with Family: e.g., Evaluation results, medical history, therapy reports, and most importantly concerns of the parent 3) Child Tools + Family Tools + Discussion: e.g., We use information from the screenings, assessment, RBI, observations, input from other service providers, and (most importantly) conversations with families about needs, concerns and priorities 4) No Tools Mentioned: e.g., Team approach including family members")
64
N = 100 responses Number of responses per category

65
98 people responded Responses were varied in terms of numbers and sources of data used, e.g., One response: “Progress seen by families-tracked by COSFs; Retention/family interest/ motivation; Exiting children when no longer needs services; Parent surveys; Children who are not eligible for Part B services at 3.” Another response: “If they meet their goals, then great, something is working. If they don't and the parent still believes in me, then I feel comfortable in saying that what I am doing is working.” The majority of people described only 1 or 2 sources of info used for program evaluation

66
N = 98 responses

67
Number of times mentioned Data Sources

68
Questions 8, 29 - 36

69
N = 99 responses

70
Yes No * If more than one respondent per county, responses were averaged into single county response. N = 85 counties

71
Frequency Topic Each mentioned 8-10 times PLAY Project, Autism & other Developmental Disorders, Infant/Maternal Mental Health, EBEI, IFSP (specifically functional outcomes) Each mentioned 4-7 times Fetal Alcohol Syndrome/Prenatal Drug Exposure, Feeding, RBI, Sensory Processing Each mentioned 2-3 times Involving/engaging/communicating with families, Safety, Behavior Supports, Vision/Hearing, Child Abuse/Domestic Violence, PAT, Healthy Families America Each mentioned 1 time Responsive Teaching, Music Therapy, Teaming, Poverty, Brain Development, INSITE, DIR, etc.
 Each mentioned 4-7 times Fetal Alcohol Syndrome/Prenatal Drug Exposure, Feeding, RBI, Sensory Processing Each mentioned 2-3 times Involving/engaging/communicating with families, Safety, Behavior Supports, Vision/Hearing, Child Abuse/Domestic Violence, PAT, Healthy Families America Each mentioned 1 time Responsive Teaching, Music Therapy, Teaming, Poverty, Brain Development, INSITE, DIR, etc.")
72
* If more than one respondent per county, responses were aggregated into single county response. N = 86 counties

73
N = 72 responses

74
* If more than one respondent per county, responses were averaged into single county response. N = 86 counties

75
Ideas/responses fell into several categories Sharing the cost of trainings Sharing staff (therapists) for core teams Sharing specialized expertise for low incidence disabilities (e.g., vision specialist, PLAY project) Sharing specific tasks (e.g., developmental evaluations, ADOS) Sharing administration and supervision
 for core teams Sharing specialized expertise for low incidence disabilities (e.g., vision specialist, PLAY project) Sharing specific tasks (e.g., developmental evaluations, ADOS) Sharing administration and supervision")
76
* If more than one respondent per county, responses were averaged into single county response. N = 77-87 counties, depending on answer option.

77
Questions 37-40

78
N = 96 responses Number of times mentioned Category of Support

79
Number of support categories per response

80
Examples from the continuum of responses: “Family support is a section on the IFSP that the current service coordinators do their best to fulfill. We do not employ or contract anyone for family support services.” “We no longer have funding for a Family Support Specialist. The SC's provide as much support as possible for the families. We have also started having monthly play group/parent meetings so families can network among themselves as well.” “Access to and opportunities to interact with other families. We offer peer playgroups, provide families with FIN webinar information and FIN Facts and utilize our FIN Consultant.” “Informally through service coordination. Had to terminate position due to lack of funding.”

81
Examples from the continuum of responses: “We no longer have a formal system of family support services in our county. The only way families in Part C services receive family support services are by attending trainings offered by our Head Start/Early Head Start Programs.” “We define it at parent to parent support. We are working on expanding what we do. Parents have identified parent to parent support as a gap/need.” “We probably need to work on this area- Individual service providers provide support to families as appropriate to their needs.” “Giving families the opportunity to connect and support one another through phone, email, web and/or face-to-face contacts. Our county has an AWESOME Family Support Specialist, supported by FCFC and grant dollars. She hosts 2 support groups and sends out a Parent Pages newsletter to all families in HMG. The Family Information Network has really evolved and offers many great training/information opportunities to parents through their wonderful webinars.”

82
* If more than one respondent per county, responses were averaged into single county response. N = 84 counties

83
N = 48 responses

84
Number of times mentioned N = 50 responses

85
Questions 41-44

86
MAJOR THEME: DOING MORE WITH LESS Funding cuts Increased numbers of Part C children and families Adopting EBEI Moving services to natural environments PSP model with supporting team On the one hand,On the other hand, N = 96 responses

87
Examples from the continuum of responses: “It has not changed.” “Moved from facility based/medical model to home based/primary service provider/evidence based model” “We have completely transitioned from a central based Early Intervention Program with limited parent involvement to an Evidence Based Practice/Primary Service Provider model which focuses on providing services to family in natural environments. Families have been very pleased with this approach.” “We have gone from a complete traditional program with 2 EIS and 1 part time SLP (very minimal services) to a Transdisciplinary model (or moving in the direction of becoming one) and increasing service delivery to families. Over the past 3-5 years, the number of EI children has grown, therefore limiting the amount of time the EIS could spend with families. The Evidenced based model has really opened some doors for us in how we can effectively provide services to families and with the addition of service providers.” “I feel that we are moving away from the traditional medical model. It is so much more important and effective to work with the parents and the child. To teach and support the parents in helping their child develop to the best of their abilities has become our priority. That is the biggest change I have seen...........and probably the most important change for Part C children in Ohio.”
 to a Transdisciplinary model (or moving in the direction of becoming one) and increasing service delivery to families. Over the past 3-5 years, the number of EI children has grown, therefore limiting the amount of time the EIS could spend with families. The Evidenced based model has really opened some doors for us in how we can effectively provide services to families and with the addition of service providers. I feel that we are moving away from the traditional medical model. It is so much more important and effective to work with the parents and the child. To teach and support the parents in helping their child develop to the best of their abilities has become our priority. That is the biggest change I have seen and probably the most important change for Part C children in Ohio. .")
88
TOP DOWNBOTTOM UP Meeting needs of children & families Reading the research Trainings and networking Changes in policies and rules Budget cuts Emphasis on compliance N = 92 responses

89
Examples from the continuum of responses: “Funding/money cuts” “Lack of funding” “Funding cuts have been the main trigger. Program and rule revisions have also played a part.” “Recommendation from Family and Children First Council.” “Sensitivity to families, their lifestyles and their personal concerns and needs.” “Research! Training. Support. Tired of families not being engaged. Tired of families canceling visits. Kids not making progress...... Those are things of the past :)” “The need to be in alignment with federal and state compliance as well as what is best for our county's children and their families.” “We were aware this was the direction early intervention was going in some states. We attended the McWilliam ODH Leadership conference presentation.”
 The need to be in alignment with federal and state compliance as well as what is best for our county s children and their families. We were aware this was the direction early intervention was going in some states. We attended the McWilliam ODH Leadership conference presentation. .")
90
Examples from the continuum of responses: “Changes at the state level and local monitoring visits” “Program policy-rules within DD and HMG, parent concerns and programs working together to change” “Desire to provide the best services we can-strength based and family driven.” “I think the need for these changes has been present for a while. Those at the state level have the vision to see the benefits of revamping the way we provide services to families.” “Hearing about it from other counties, EIS's have always provided services in the natural environment. Staff drove the initiative as they researched and went to some trainings, visited other counties.”

91
People described a kaleidoscope of reactions! Excited Curious Receptive Resistant Adjusting Confused Angry Skeptical Positively ‘Anywhere from very well to not so good!” Pleased N = 91 responses

92
Examples from the continuum of responses: “Response is positive a year later. Initially it was difficult. It would be helpful if PSP training was initially provided for all service coordinators as well as EI, as they are the first point of contact for families. The process was explained, however everyone struggled with the process initially.” “This is a challenging and on-going process. I believe it is becoming more accepted. Try to stress the importance of the parents being the child's best teacher. As stated above, ___BDD contracts with therapists, so don't always have the same people year to year, which makes it difficult, just when you have a good team and everyone is on the same page, things change. Still working on getting some parents recognize their important role.” “Parents recognize the importance of what they do with their children in everyday routines and how small changes make a big difference.”

93
Examples from the continuum of responses: “Change is always hard but families seem to be happy, service coordinators like the new approach but it has been an adjustment; EI staff were very resistant to any change but have very slowly been adjusting.” “I feel that everyone came together and has worked very well together. We are lucky in our county and we do have a wonderful working relationship between HMG and --BDD, as well as the local private therapies/programs.” “HMG service coordinators have many questions. Some have difficulty understanding that the traditional medical model may not be the most effective method. Families are very excited about it. Others are curious and very receptive to the change.”

94
N = 95 responses. Each response was sorted into one of the major categories below.

95
Examples from the continuum of responses: “We continue to support the family’s right to choose a service option that may or not follow the research.” “To be able to provide direct therapy to more children within our community” “We wouldn't change a thing. We have good relationships with families, Help Me Grow and Head Start. We offer a wonderful program for true Part C children of ----------- County and their families.” “Moving more towards the PSP model with teams evaluating and meeting to make recommendations” “Medical community would value services provided in the home versus a medical model of service delivery.” “We would like to see stable funding that allows for all children with delays and disabilities to have access to all services and specialists as needed.”

96
Examples from the continuum of responses: “To be more fully funded in order to meet all required mandates and provide comprehensive quality services.” “We would like EI policies and structure to have more stability and continuity across counties. We would like to have more different services and/or professionals available.” “Five years from today I would like to be able to assemble a core team of professionals (OT, PT, SLP, EIS, SC and others) to review referrals and assign a PSP. I would also like to have a strong family support group that is organized and driven by families, meeting regularly to address needs/concerns of families with children with disabilities. I would like to have full- time EIS and full-time SC....no dual roles.” “I would like to have a transdisciplinary model of services where we have access to OT, PT and speech professionals on our team.”
 to review referrals and assign a PSP. I would also like to have a strong family support group that is organized and driven by families, meeting regularly to address needs/concerns of families with children with disabilities. I would like to have full- time EIS and full-time SC....no dual roles. I would like to have a transdisciplinary model of services where we have access to OT, PT and speech professionals on our team. .")
98
What have we learned about the current Part C EI Landscape in Ohio?

99
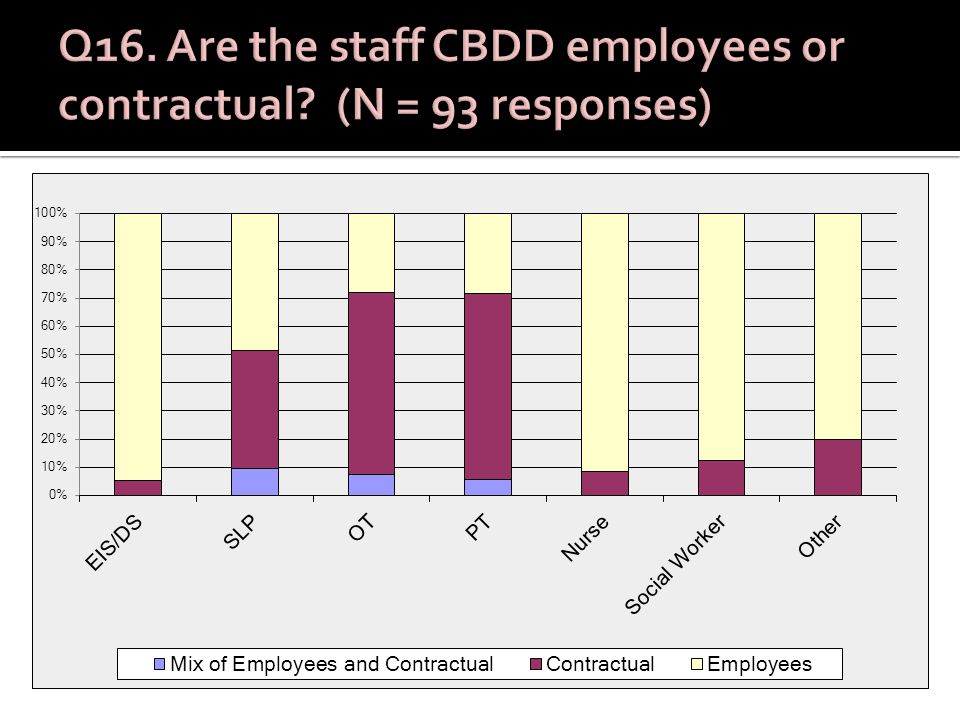
Service coordinator caseloads vary widely from county to county, ranging from 10 to 75 families per Service Coordinator. 30 of 68 counties reported caseloads of 40 families and higher. In some counties, the CBDD EIs play a dual role as both an EI and a SC. Multiple sources of payment are being used, and appear to be complicated and multi-layered. Almost (but only) half of the CBDDs report year-round, flexible access to EI services. More than half of the counties reported access to a full core team as defined in this project (SC, EIS, SLP, OT, and PT). For the CBDDs, OTs and PTs were more likely to be contractual than salaried staff. Some counties mentioned the challenges of turnover and implementation of EBEI when the therapists are contractual. Less than half of the CBDDs are employing a Primary Service Provider model.
 half of the CBDDs report year-round, flexible access to EI services. More than half of the counties reported access to a full core team as defined in this project (SC, EIS, SLP, OT, and PT). For the CBDDs, OTs and PTs were more likely to be contractual than salaried staff. Some counties mentioned the challenges of turnover and implementation of EBEI when the therapists are contractual. Less than half of the CBDDs are employing a Primary Service Provider model..")
100
Counties report that families seek multiple services from multiple agencies. Families are traveling many places for services, in and out of county. Based on the perceptions of the survey respondents, families are receiving services that vary widely in terms of adherence to the principles of EBEI. Families who are accessing multiple services may be experiencing conflicting approaches in service delivery. Multiple sources of payment are used to pay for EI services, and those sources vary from service to service and county to county. CBDDs have the capacity to provide services in natural settings such as the home and community, but this is not yet a consistent practice across all counties. Some comments reflected confusion between the HOW (coaching) and the (WHAT) curriculum. Many “curricula” were mentioned, but over 30% of the counties reported using no or only one curriculum (one size fits all).
 and the (WHAT) curriculum. Many curricula were mentioned, but over 30% of the counties reported using no or only one curriculum (one size fits all)..")
101
What is most consistent across counties? Length of visit (one hour) and frequency (the majority were either weekly or every other week) 78 of 88 counties reported having team meetings. The good news? More than half meet every or every other week, and the most likely persons to be present represent the core team concept. 40% of participants described a process of developing IFSP outcomes that included not only “child tools” and discussion with families, but also “family tools” (e.g., RBI) that are likely to elicit functional outcomes. Counties are inconsistent in terms of how they define, evaluate and measure progress.
 and frequency (the majority were either weekly or every other week) 78 of 88 counties reported having team meetings. The good news. More than half meet every or every other week, and the most likely persons to be present represent the core team concept. 40% of participants described a process of developing IFSP outcomes that included not only child tools and discussion with families, but also family tools (e.g., RBI) that are likely to elicit functional outcomes. Counties are inconsistent in terms of how they define, evaluate and measure progress..")
102
Ohio has an abundance of specialized expertise available across agencies. A majority of counties have identified specific needs for training and additional expertise A majority of counties have thought of partnering with other counties to meet those and other needs. Counties have very different and inconsistent interpretations of key terminology: EBEI, coaching, curriculum, functional outcomes, primary service provider, etc.

103
Family support is not defined consistently across counties. As a result, how family support is offered differs markedly from county to county. Only half of the counties have a Family Support Specialist, and this position was often described as part-time or in combination with another position. The most frequent reference to family support was “what professionals do as part of their job.” The move to natural environments for some counties meant that family to family support disappeared.

104
Counties are struggling to do more with less, in both negative and positive ways. Changes have been triggered not only from the top (cuts in funding, emphasis on compliance) but also from the bottom (people wanting to adopt EBEI). Reactions to change have been mixed, but counties have persevered. The majority of counties want to continue to evolve toward evidence-based practices on behalf of their families.
 but also from the bottom (people wanting to adopt EBEI). Reactions to change have been mixed, but counties have persevered. The majority of counties want to continue to evolve toward evidence-based practices on behalf of their families..")
Similar presentations


![[Imagine School at North Port] Oral Exit Report Quality Assurance Review Team School Accreditation.](/1/271987/big_thumb.jpg "[Imagine School at North Port] Oral Exit Report Quality Assurance Review Team School Accreditation.>")


 The Massachusetts Child Care Resource & Referral.>")


 conducted a stakeholder survey March 22 and April 17, 2013.>")


 Sustainability for Early Childhood Systems Building.>")