Download presentation
Presentation is loading. Please wait.

1
Warm Up: How does the graph of compare to ? Sketch both to confirm.

2
Homework Issues??? From Pages # 2ab, 4ac, 5abd, 10ab, 11, 12c

3
McGraw-Hill Ryerson Pre-Calculus 12 Chapter 1 Function
Transformations

4
1.2 Reflections and Stretches 1
Chapter 1.2 Reflections and Stretches 1 Focus On ... • developing an understanding of the effects of reflections on the graphs of functions and their related equations • developing an understanding of the effects of vertical and horizontal stretches on the graphs of functions and their related equations

10
horizontal

11
Independent Practice:
Page 28 #1, 2 ( f(x) and h(x) only), 3b, 4bc, 5-8
-Heads up: In-Class Assignment Friday September 16

16
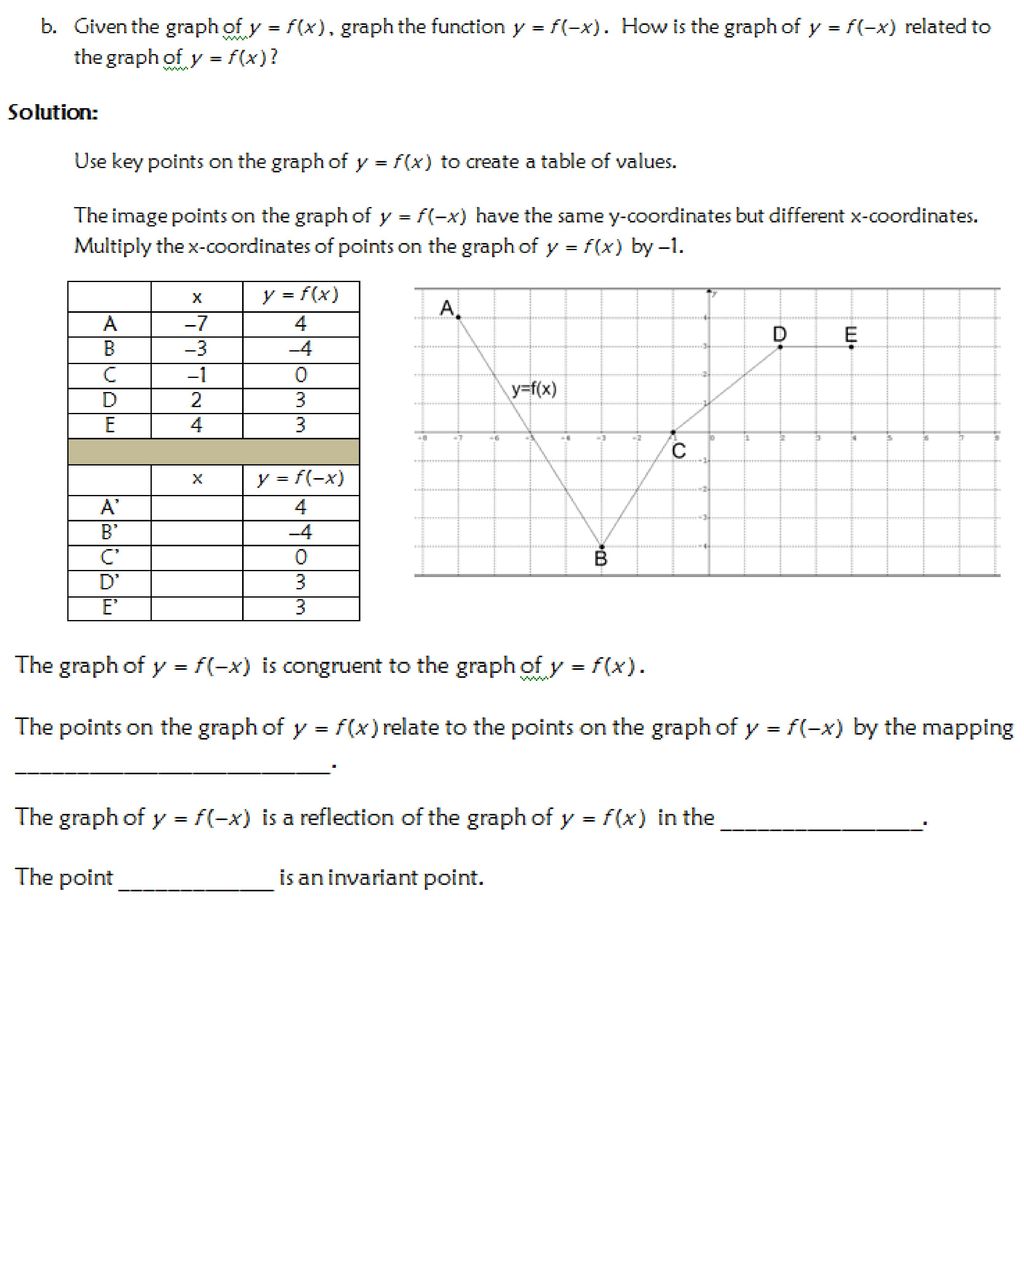
1.2 Compare the Graphs of y = f(x), y = –f(x), and y = f(–x)
Example 1 Compare the Graphs of y = f(x), y = –f(x), and y = f(–x) a) Given the graph of y = f(x), graph the functions y = –f(x) and y = f(–x). b) How are the graphs of y = –f(x) and y = f(–x) related to the graph of y = f(x)? 1 a) Use key points on the graph of y = f(x) to create tables of values. 1 2 The image points on the graph of y = –f(x) have the same x-coordinates but
different y-coordinates. Multiply the y-coordinates of points on the graph of
y = f(x) by –1. 2 Continue Next Page
, y = –f(x), and y = f(–x) a) Given the graph of y = f(x), graph the functions. y = –f(x) and y = f(–x). b) How are the graphs of y = –f(x) and y = f(–x) related to the graph of y = f(x) 1. a) Use key points on the graph of y = f(x) to create tables of values The image points on the graph of y = –f(x) have the same x-coordinates but different y-coordinates. Multiply the y-coordinates of points on the graph of y = f(x) by –1. 2. Continue Next Page.")
17
A B C D E –4 –2 1 3 5 x –4 –2 1 3 5 y = f(x) –3 4 –1(–3) = 3 –1(0) = 0
1.2 Example 1 Continued Compare the Graphs of y = f(x), y = –f(x), and y = f(–x) 3 3 x y = f(x) A –4 –3 B –2 C 1 D 3 4 E 5 Graph Graph Graph 4 x y = –f(x) A' –4 –1(–3) = 3 B' –2 C' 1 –1(0) = 0 D' 3 –1(4) = –4 E' 5 –1(–4) = 4 4 Graph Continue Next Page
, y = –f(x), and y = f(–x) x. y = f(x) A. –4. –3. B. –2. C. 1. D E. 5. Graph. Graph. Graph. 4. x. y = –f(x) A –4. –1(–3) = 3. B –2. C 1. –1(0) = 0. D 3. –1(4) = –4. E 5. –1(–4) = Graph. Continue Next Page.")
18
–4 –2 1 3 5 –3 4 A" –3 B" C" D" 4 E" –4 1.2 x A B C D E x y = f(–x)
Example 1 Continued Compare the Graphs of y =f(x), y = –f(x), and y = f(–x) 5 The image points on the graph of y = f(–x) have the same y-coordinates
but different x-coordinates. Multiply the x-coordinates of points on the
graph of y = f(x) by –1. 5 6 x y = f(x) A –4 –3 B –2 C 1 D 3 4 E 5 6 Graph Graph Graph 7 7 x y = f(–x) A" –1(–4) = 4 –3 B" –1(–2) = 2 C" –1(1) = –1 D" –1(3) = –3 4 E" –1(5) = –5 –4 Graph Continue Next Page
, y = –f(x), and y = f(–x) 5. The image points on the graph of y = f(–x) have the same y-coordinates but different x-coordinates. Multiply the x-coordinates of points on the graph of y = f(x) by – x. y = f(x) A. –4. –3. B. –2. C. 1. D E Graph. Graph. Graph x. y = f(–x) A –1(–4) = 4. –3. B –1(–2) = 2. C –1(1) = –1. D –1(3) = –3. 4. E –1(5) = –5. –4. Graph. Continue Next Page.")
19
1.2 Compare the Graphs of y =f(x), y = –f(x), and y = f(–x)
Example 1 Continued Compare the Graphs of y =f(x), y = –f(x), and y = f(–x) 8 b) The transformed graphs are congruent to the graph of y = f(x). The points on the graph of y = f(x) relate to the points on the graph of y = –f(x) by the mapping (x, y) → (x, –y). The graph of y = –f(x) is a reflection of the graph of y = f(x) in the x-axis. 8 9 Notice that the point C(1, 0) maps to itself, C'(1, 0). This point is an invariant point. 9 The points on the graph of y = f(x) relate to the points on the graph of y = f(–x) by the mapping (x, y) → (–x, y). The graph of y = f(–x) is a reflection of the graph of y = f(x) in the y-axis. 10 10 11 The point (0, –1) is an invariant point. 11
, y = –f(x), and y = f(–x) 8. b) The transformed graphs are congruent to the graph of y = f(x). The points on the graph of y = f(x) relate to the points on the. graph of y = –f(x) by the mapping (x, y) → (x, –y). The graph. of y = –f(x) is a reflection of the graph of y = f(x) in the x-axis Notice that the point C(1, 0) maps to itself, C (1, 0). This point is an invariant point. 9. The points on the graph of y = f(x) relate to the points on the. graph of y = f(–x) by the mapping (x, y) → (–x, y). The graph. of y = f(–x) is a reflection of the graph of y = f(x) in the y-axis The point (0, –1) is an invariant point. 11.")
20
1.2 Example 1: Your Turn a) Given the graph of y = f(x), graph the functions y = –f(x) and y = f(–x). b) Show the mapping of key points on the graph of y = f(x) to image points on the graphs of y = –f(x) and y = f(–x). c) Describe how the graphs of y = –f(x) and y = f(–x) are related to the graph of y = f(x). State any invariant points. Answer c) The functions are mirrors of the original over the x-axis and y-axis. The first function has an invariant point at (–1, 0). The second function has an invariant point at (0, 2). a) b) Example points.
 Show the mapping of key points on the graph of y = f(x) to image. points on the graphs of y = –f(x) and y = f(–x). c) Describe how the graphs of y = –f(x) and y = f(–x) are related to. the graph of y = f(x). State any invariant points. Answer. c) The functions are mirrors of the original. over the x-axis and y-axis. The first function has an invariant point. at (–1, 0). The second function has an. invariant point at (0, 2). a) b) Example points.")
21
x 4 2 1.2 8 –6 –2 5 y = f(x) y = g(x) = 2f(x)
Example 2 Graph y = af(x) Given the graph of y = f(x), • transform the graph of f(x) to sketch the graph of g(x) • describe the transformation • state any invariant points • state the domain and range of the functions a) g(x) = 2f(x) b) 1 a) Use key points on the graph of y = f(x) to create a table of values. 1 2 2 The image points on the graph of g(x) = 2f(x) have the same x-coordinates but different y-coordinates. Multiply the y-coordinates of points on the graph of y = f(x) by 2. y = g(x) y = f(x) 3 3 x y = f(x) y = g(x) = 2f(x) –6 4 8 –2 2 5 y = f(x) y = g(x) Continue Next Page
 Given the graph of y = f(x), • transform the graph of f(x) to sketch. the graph of g(x) • describe the transformation. • state any invariant points. • state the domain and range of the. functions. a) g(x) = 2f(x) b) 1. a) Use key points on the graph of y = f(x) to create a table of values The image points on the graph of g(x) = 2f(x) have the same. x-coordinates but different y-coordinates. Multiply the y-coordinates. of points on the graph of y = f(x) by 2. y = g(x) y = f(x) x. y = f(x) y = g(x) = 2f(x) – – y = f(x) y = g(x) Continue Next Page.")
22
1.2 Example 2 Continued Graph y = af(x) a) g(x) = 2f(x) 4 Since a = 2, the points on the graph of y = g(x) relate to the points on the graph of y = f(x) by the mapping (x, y) → (x, 2y). Therefore, each point on the graph of g(x) is twice as far from the x-axis as the corresponding point on the graph of f(x). The graph of g(x) = 2f(x) is a vertical stretch of the graph of y = f(x) about the x-axis by a factor of 2. 4 5 The invariant points are (–2, 0) and (2, 0). 5 6 For f(x), the domain is {x | –6 ≤ x ≤ 6, x ∈ R}, or [–6, 6], and the range is {y | 0 ≤ y ≤ 4, y ∈ R}, or [0, 4]. 6 For g(x), the domain is {x | –6 ≤ x ≤ 6, x ∈ R}, or [–6, 6], and the range is {y | 0 ≤ y ≤ 8, y ∈ R}, or [0, 8]. 7 7 7 Continue Next Page
 by the mapping (x, y) → (x, 2y). Therefore, each point on the graph of g(x) is twice as far from the x-axis as the. corresponding point on the graph of f(x). The graph of g(x) = 2f(x) is. a vertical stretch of the graph of y = f(x) about the x-axis by a factor. of The invariant points are (–2, 0) and (2, 0) For f(x), the domain is {x | –6 ≤ x ≤ 6, x ∈ R}, or [–6, 6], and the range is {y | 0 ≤ y ≤ 4, y ∈ R}, or [0, 4]. 6. For g(x), the domain is {x | –6 ≤ x ≤ 6, x ∈ R}, or [–6, 6], and the range is {y | 0 ≤ y ≤ 8, y ∈ R}, or [0, 8] Continue Next Page.")
23
x –6 –2 5 y = f(x) 4 1.2 y = g(x) = f(x) 2 1 b)
Example 2 Continued 8 b) The image points on the graph of have the same . of points on the graph of y = f (x) by x-coordinates but different y-coordinates. Multiply the y-coordinates Graph y = af(x) b) 8 9 9 x y = f(x) y = g(x) = f(x) –6 4 2 –2 1 5 1 y = g(x) y = f(x) 2 y = f(x) y = g(x) Continue Next Page
 The image points on the graph of have the same. . of points on the graph of y = f (x) by . x-coordinates but different y-coordinates. Multiply the y-coordinates. Graph y = af(x) b) x. y = f(x) y = g(x) = f(x) – – y = g(x) y = f(x) 2. y = f(x) y = g(x) Continue Next Page.")
24
1.2 Example 2 Continued Since a = , the points on the graph of y = g(x) relate to the points on the graph of y = f(x) by the mapping (x, y) → (x, y). Therefore, each point on the graph of g(x) is one half as far from the x-axis as the corresponding point on the graph of f(x). The graph of g(x) = f(x) is a vertical stretch of the graph of y = f(x) about the x-axis by a factor of . 10 Graph y = af(x) a) 10 11 The invariant points are (–2, 0) and (2, 0). 11 11 12 For f(x), the domain is {x | –6 ≤ x ≤ 6, x ∈ R}, or [–6, 6], and the range is {y | 0 ≤ y ≤ 4, y ∈ R}, or [0, 4]. 12 For g(x), the domain is {x | –6 ≤ x ≤ 6, x ∈ R}, or [–6, 6], and the range is {y | 0 ≤ y ≤ 2, y ∈ R}, or [0, 2]. 13 13 13
 by the mapping (x, y) → (x, y). Therefore, each point on the graph of g(x) is one half as far from the x-axis as the. corresponding point on the graph of f(x). The graph of g(x) = f(x) is. a vertical stretch of the graph of y = f(x) about the x-axis by a factor. of Graph y = af(x) a) The invariant points are (–2, 0) and (2, 0) For f(x), the domain is {x | –6 ≤ x ≤ 6, x ∈ R}, or [–6, 6], and the range is {y | 0 ≤ y ≤ 4, y ∈ R}, or [0, 4]. 12. For g(x), the domain is {x | –6 ≤ x ≤ 6, x ∈ R}, or [–6, 6], and the range is {y | 0 ≤ y ≤ 2, y ∈ R}, or [0, 2]")
25
Example 2: Your Turn 1.2 Given the function f(x) = x2,
Answer a) a) The transformation is a vertical stretch
of 4. The domain is {x | x ∈ R}. The
range is {y | y ≥ 0, y ∈ R}. There is an
invariant point at the origin. Example 2: Your Turn Given the function f(x) = x2, • transform the graph of f(x) to sketch the graph of g(x) • describe the transformation • state any invariant points • state the domain and range of the functions a) g(x) = 4f(x) b) g(x) = f(x) Answer b) b) The transformation is a vertical stretch
of . The domain is {x | x ∈ R}. The
range is {y | y ≥ 0, y ∈ R}. There is an
invariant point at the vertex (0, 0).
 a) The transformation is a vertical stretch of 4. The domain is {x | x ∈ R}. The range is {y | y ≥ 0, y ∈ R}. There is an invariant point at the origin. Example 2: Your Turn. Given the function f(x) = x2, • transform the graph of f(x) to sketch the graph of g(x) • describe the transformation. • state any invariant points. • state the domain and range of the functions. a) g(x) = 4f(x) b) g(x) = f(x) Answer b) b) The transformation is a vertical stretch of . The domain is {x | x ∈ R}. The range is {y | y ≥ 0, y ∈ R}. There is an invariant point at the vertex (0, 0).")
26
1.2 Graph y = f(bx) Given the graph of y = f(x),
Example 3 Graph y = f(bx) Given the graph of y = f(x), • transform the graph of f(x) to sketch the graph of g(x) • describe the transformation • state any invariant points • state the domain and range of the functions a) g(x) = f(2x) b) g(x) = f( x) 2 1 1 a) Use key points on the graph of y = f(x) to create a table of values. 1 2 The image points on the graph of g(x) = f(2x) have the same y-coordinates but different x-coordinates. Multiply the x-coordinates of points on the graph of y = f(x) by . . 2 Continue Next Page
 Given the graph of y = f(x), • transform the graph of f(x) to sketch. the graph of g(x) • describe the transformation. • state any invariant points. • state the domain and range. of the functions. a) g(x) = f(2x) b) g(x) = f( x) a) Use key points on the graph of y = f(x) to create a table of values The image points on the graph of g(x) = f(2x) have the same. y-coordinates but different x-coordinates. Multiply the x-coordinates. of points on the graph of y = f(x) by Continue Next Page.")
27
x –4 –2 x –2 –1 1 y = f(x) 4 2 y = f(2x) 4 2 1.2 Graph y = f (bx)
Example 3 Continued Graph y = f (bx) a) g(x) = f(2x) 3 3 x y = f(x) –4 4 –2 2 y = f(x) y = f(x) y =g(x) 4 4 x y = f(2x) –2 4 –1 2 1 y =g(x) Continue Next Page
 a) g(x) = f(2x) x. y = f(x) –4. 4. –2. 2. y = f(x) y = f(x) y =g(x) x. y = f(2x) –2. 4. – y =g(x) Continue Next Page.")
28
1.2 Example 3 Continued Since b = 2, the points on the graph of y = g(x) relate to the points on the graph of y = f(x) by the mapping (x, y) → ( x, y). Therefore, each point on the graph of g(x) is one half as far from the y-axis as the corresponding point on the graph of f(x). The graph of g(x) = f(2x) is a horizontal stretch of the graph of y = f(x) about the y-axis by a factor of . 5 Graph y = f(bx) a) g(x) = f(2x) 5 The invariant point is (0, 2). 6 6 7 For f(x), the domain is {x | –4 ≤ x ≤ 4, x ∈ R}, or [–4, 4], and the range is {y | 0 ≤ y ≤ 4, y ∈ R}, or [0, 4]. 7 For g(x), the domain is {x | –2 ≤ x ≤ 2, x ∈ R}, or [–2, 2], and the range is {y | 0 ≤ y ≤ 4, y ∈ R}, or [0, 4]. 4 8 4 8 Continue Next Page
 by the mapping (x, y) → ( x, y). Therefore, each point on the graph of g(x) is one half as far from the y-axis as the. corresponding point on the graph of f(x). The graph of g(x) = f(2x) is. a horizontal stretch of the graph of y = f(x) about the y-axis by a factor. of . 5. Graph y = f(bx) a) g(x) = f(2x) 5. The invariant point is (0, 2) For f(x), the domain is {x | –4 ≤ x ≤ 4, x ∈ R}, or [–4, 4], and the range is {y | 0 ≤ y ≤ 4, y ∈ R}, or [0, 4]. 7. For g(x), the domain is {x | –2 ≤ x ≤ 2, x ∈ R}, or [–2, 2], and the range is {y | 0 ≤ y ≤ 4, y ∈ R}, or [0, 4] Continue Next Page.")
29
b) 1.2 Example 3 Continued b) The image points on the graph of have the same . y-coordinates but different x-coordinates. Multiply the x-coordinates of points on the graph of y = f(x) by 2. 9 Graph y = af(x) 9 y = g(x) y = f(x) 10 10 x y = f(x) –6 4 –2 2 5 2 1 y = g(x) = f( x) y = f(x) y = g(x) Continue Next Page
 by Graph y = af(x) 9. y = g(x) y = f(x) x. y = f(x) –6. 4. – y = g(x) = f( x) y = f(x) y = g(x) Continue Next Page.")
30
1.2 Graph y = f(bx) a) g(x) = f( x)
Example 3 Continued Graph y = f(bx) a) g(x) = f( x) 2 1 Since b = ½, the points on the graph of y = g(x) relate to the points on the graph of y = f(x) by the mapping (x, y) → (2x, y). Therefore, each point on the graph of g(x) is twice as far from the y-axis as the corresponding point on the graph of f(x). The graph of g(x) = f(½x) is a horizontal stretch of the graph of y = f(x) about the y-axis by a factor of 2. 11 11 The invariant point is (0, 2). 12 12 For f(x), the domain is {x | –4 ≤ x ≤ 4, x ∈ R}, or [–4, 4], and the range is {y | 0 ≤ y ≤ 4, y ∈ R}, or [0, 4]. 13 13 14 For g(x), the domain is {x | –8 ≤ x ≤ 8, x ∈ R}, or [–8, 8], and the range is {y | 0 ≤ y ≤ 4, y ∈ R}, or [0, 4]. 14
 a) g(x) = f( x) Since b = ½, the points on the graph of y = g(x) relate to the points. on the graph of y = f(x) by the mapping (x, y) → (2x, y). Therefore, each point on the graph of g(x) is twice as far from the y-axis as the. corresponding point on the graph of f(x). The graph of g(x) = f(½x) is. a horizontal stretch of the graph of y = f(x) about the y-axis by a factor. of The invariant point is (0, 2) For f(x), the domain is {x | –4 ≤ x ≤ 4, x ∈ R}, or [–4, 4], and the range is {y | 0 ≤ y ≤ 4, y ∈ R}, or [0, 4] For g(x), the domain is {x | –8 ≤ x ≤ 8, x ∈ R}, or [–8, 8], and the range is {y | 0 ≤ y ≤ 4, y ∈ R}, or [0, 4]. 14.")
31
Example 3: Your Turn 1.2 Given the function f(x) = x2,
Answer a) stretch of . The domain is {x | x ∈ R}. 3 1 The range is {y | y ≥ 0, y ∈ R}. The transformation is a horizontal a) Example 3: Your Turn Given the function f(x) = x2, • transform the graph of f(x) to sketch the graph of g(x) • describe the transformation • state any invariant points • state the domain and range of the functions a) g(x) = f(3x) b) g(x) = f( x) 4 1 Answer b) The transformation is a horizontal
stretch of 4. The domain is {x | x ∈ R}.
The range is {y | y ≥ 0, y ∈ R}. b)
 stretch of . The domain is {x | x ∈ R} The range is {y | y ≥ 0, y ∈ R}. The transformation is a horizontal. a) Example 3: Your Turn. Given the function f(x) = x2, • transform the graph of f(x) to sketch the graph of g(x) • describe the transformation. • state any invariant points. • state the domain and range of the functions. a) g(x) = f(3x) b) g(x) = f( x) Answer b) The transformation is a horizontal stretch of 4. The domain is {x | x ∈ R}. The range is {y | y ≥ 0, y ∈ R}. b)")
32
1.2 Write the Equation of a Transformed Function
Example 4 Write the Equation of a Transformed Function The graph of the function y = f(x) has been transformed by either a stretch or a reflection. Write the equation of the transformed graph, g(x). 1 a) Notice that the V-shape has changed, so the graph has been transformed by a stretch. Since the original function is f(x) = |x|, a stretch can be described in two ways. 1 Choose key points on the graph of y = f(x) and determine their image points on the graph of the transformed function, g(x). 2 2 Continue Next Page
 has been transformed by either a. stretch or a reflection. Write the equation of the transformed graph, g(x). 1. a) Notice that the V-shape has changed, so the graph has been. transformed by a stretch. Since the original function is f(x) = |x|, a stretch can be. described in two ways. 1. Choose key points on the graph of y = f(x) and determine their. image points on the graph of the transformed function, g(x) Continue Next Page.")
33
1.2 Example 4 Continued 3 3 3 3 Case 1 Check for a pattern in the y-coordinates. x y = f(x) y = g(x) –6 6 18 –4 4 12 –2 2 The transformation can be described by the mapping (x, y) → (x, 3y). This is of the form y = af(x), indicating that there is a vertical stretch about the x-axis by a factor of 3. The equation of the transformed function is g(x) = 3f(x) or g(x) = 3|x|. 4 4 Continue Next Page
 – – –2. 2. The transformation can be described by the mapping (x, y) → (x, 3y). This is of the form y = af(x), indicating that there is a vertical stretch. about the x-axis by a factor of 3. The equation of the transformed. function is g(x) = 3f(x) or g(x) = 3|x| Continue Next Page.")
34
1.2 Example 4 Continued Case 2 Check for a pattern in the x-coordinates. 5 5 5 6 6 x y = f(x) –12 12 –6 6 x y = g(x) –4 12 –2 6 2 4 7 The transformation can be described by the mapping (x, y) → ( x, y) . This is of the form y = f(bx), indicating that there is a horizontal stretch about the y-axis by a factor of . The equation of the transformed function is g(x) = f(3x) or g(x) = |3x|. 7 Continue Next Page
 – –6. 6. x. y = g(x) – – The transformation can be described by the mapping (x, y) → ( x, y) . This is of the form y = f(bx), indicating that there is a horizontal. stretch about the y-axis by a factor of . The equation of the. transformed function is g(x) = f(3x) or g(x) = |3x|. 7. Continue Next Page.")
35
1.2 Example 4 Continued b) Notice that the shape of the graph has not changed, so the graph has been transformed by a reflection. Choose key points on the graph of f(x) = |x| and determine their image points on the graph of the transformed function, g(x). 8 8 9 9 x y = f(x) y = g(x) –4 4 –2 2 The transformation can be described by the mapping (x, y) → (x, –y). This is of the form y = –f(x), indicating a reflection in the x-axis. The equation of the transformed function is g(x) = –|x|. 10 10
 = |x| and determine their. image points on the graph of the transformed function, g(x) x. y = f(x) y = g(x) –4. 4. –2. 2. The transformation can be described by the mapping (x, y) → (x, –y). This is of the form y = –f(x), indicating a reflection in the x-axis. The. equation of the transformed function is g(x) = –|x|")
36
Example 4: Your Turn 1.2 g(x) = 4x2 or g(x) = (2x)2
The graph of the function y = f(x) has been transformed. Write the equation of the transformed graph, g(x). Answer g(x) = 4x2 or g(x) = (2x)2
 has been transformed. Write the equation of the transformed graph, g(x). Answer. g(x) = 4x2 or g(x) = (2x)2.")
Similar presentations


 Vertical Stretches about an Axis.>")


 2 + k vertex (h, k) a describes the steepness.>")

 x 2 + 14x + 49 2) x 2 – 22x + 121 3) x 2 – 12x - 64 Solve each equation. 4) d 2 – 100 = 0 5) z 2 – 2z + 1 = 0 6) t 2 + 16.>")


>")


 is the graph of f(x) translated… up 3 units left 3 units down 3 units right 3 units.>")
