Download presentation
Presentation is loading. Please wait.

1
Aim: What are the graphs for one and two variables data?
Do Now: Use the STAT function on your calculator, enter L L HW: p.604 # 10,12, p.645 # 4,6,8,10,12,14

3
L1: L2:

4
In the pervious lessons, we only dealt with one variable
In the pervious lessons, we only dealt with one variable. That means we only measure one variable at a time. The above example involves two variables that being measured at a time. The graphs are called scatter plots We can examine the linear relationship among those points. On the first graph, the points can almost form a line but not quite yet. In this case we say they have pretty strong linear relationship. On the 2nd graph, the points do not have as strong linear relationship as #1 does.

5
How do we determine the level of linear relationship for a set of points?
We use the correlation coefficient (r) to determine the linear relationship. ,when r is closer to -1 or 1 means there is a stronger linear relationship and closer to 0 means having weaker linear relationship. Notice that -1 and 1 just mean the direction of the points. By our previous knowledge, -1 and 1 mean the negative and positive slopes.
 to determine the linear relationship. ,when r is closer to -1 or 1 means there is a stronger linear relationship and closer to 0 means having weaker linear relationship. Notice that -1 and 1 just mean the direction of the points. By our previous knowledge, -1 and 1 mean the negative and positive slopes.")
6
Which of the following correlation coefficient represents the strongest linear relationship?
a) r = b) r = .2 c) r = d) r = -0.3 Which of the following correlation coefficient represents the weakest linear relationship? a) r = b) r = .7 c) r = d) r = -1
 r = -0.9 b) r = .2 c) r = 0.85 d) r = Which of the following correlation coefficient represents the weakest linear relationship a) r = -0.5 b) r = .7 c) r = -0.1 d) r = -1.")
7
Which of the following graph has the strongest linear relationship?
b c d

8
The heights and shoe sizes for a male gym class are:
(68,11)(60,8)(64,10)(78,13)(78,14)(74,11) (60,7)(70,10)(64,9)(72,11)(74,13)(72,12) (76,13)(70,11)(68,10) a) Draw a scatter plots b) Find r
(60,8)(64,10)(78,13)(78,14)(74,11) (60,7)(70,10)(64,9)(72,11)(74,13)(72,12) (76,13)(70,11)(68,10) a) Draw a scatter plots. b) Find r.")
9
Scatter plot is based on two variables data set
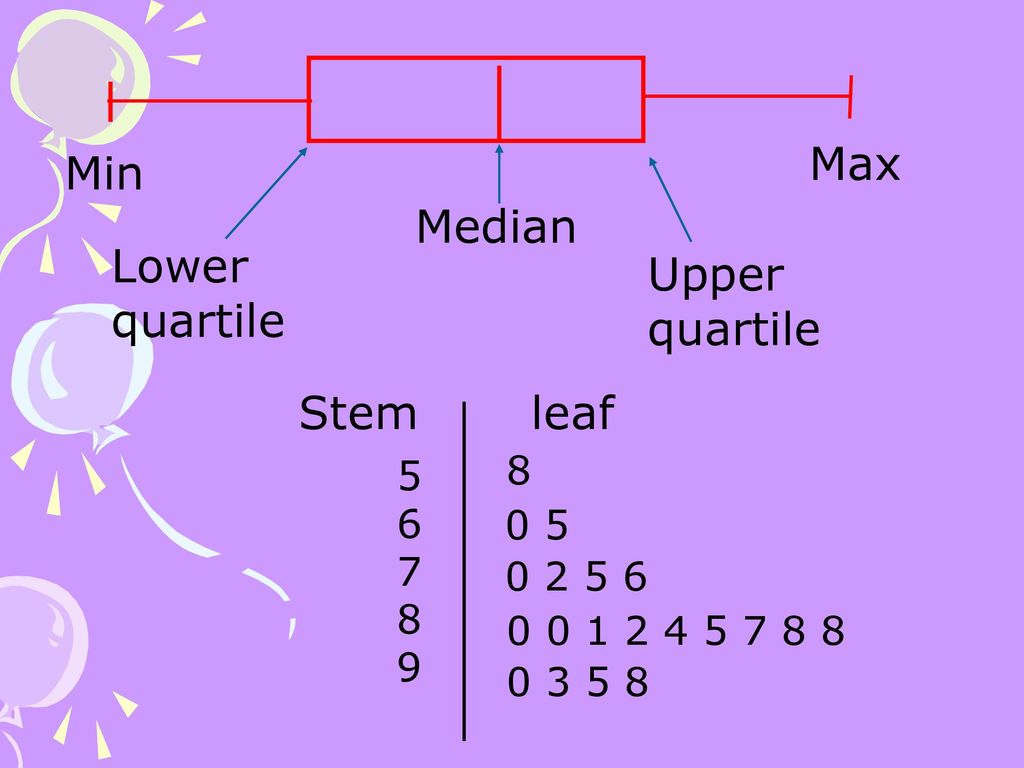
To organize and present one variable data set, we can use stem-and-leaf diagram or box-and-whisker plot. When a set of data is listed in numerical order, the median separates the data into two equal parts. The quartiles separate the data into four equal parts. To find the quartiles, we first separate the data into two equal parts and then separate each of these parts into two equal parts.

10
The median is between 81 and 83, then is equals 82
For example: A set of data The median is between 81 and 83, then is equals 82 The first quartile (or lower quartile) is 73.5 The third quartile (or upper quartile) is 88 Notice that the second quartile is the same as the mean The difference between the first and third quartile values is the interquartile range
 is The third quartile (or upper quartile) is 88. Notice that the second quartile is the same as the mean. The difference between the first and third quartile values is the interquartile range.")
11
Max Min Median Lower quartile Upper quartile Stem leaf 8 5 6 7 0 5 8 9
Similar presentations


>")


