Download presentation
Presentation is loading. Please wait.

1
Tymoczko • Berg • Stryer © 2015 W. H. Freeman and Company
Biochemistry: A Short Course Third Edition CHAPTER 5 Techniques in Protein Biochemistry © 2015 W. H. Freeman and Company

2
The amino acid sequence of tenecteplase, a fibrinolytic agent for the acute treatment of myocardial infarction. [After X. Rabasseda, Drugs Today 37(11):749, 2001.]
:749, 2001.].")
3
Chapter 5 Outline

4
The proteome is the entire set of proteins expressed and modified by a cell under a particular set of biochemical conditions. Unlike the genome, the proteome is not an unvarying characteristic of the cell.

5
Protein purification requires a test, or assay, that determines whether the protein of interest is present.

6
An assay for the enzyme lactate dehydrogenase is based on the fact that a product of the reaction, NADH, can be detected spectrophotometrically.

7
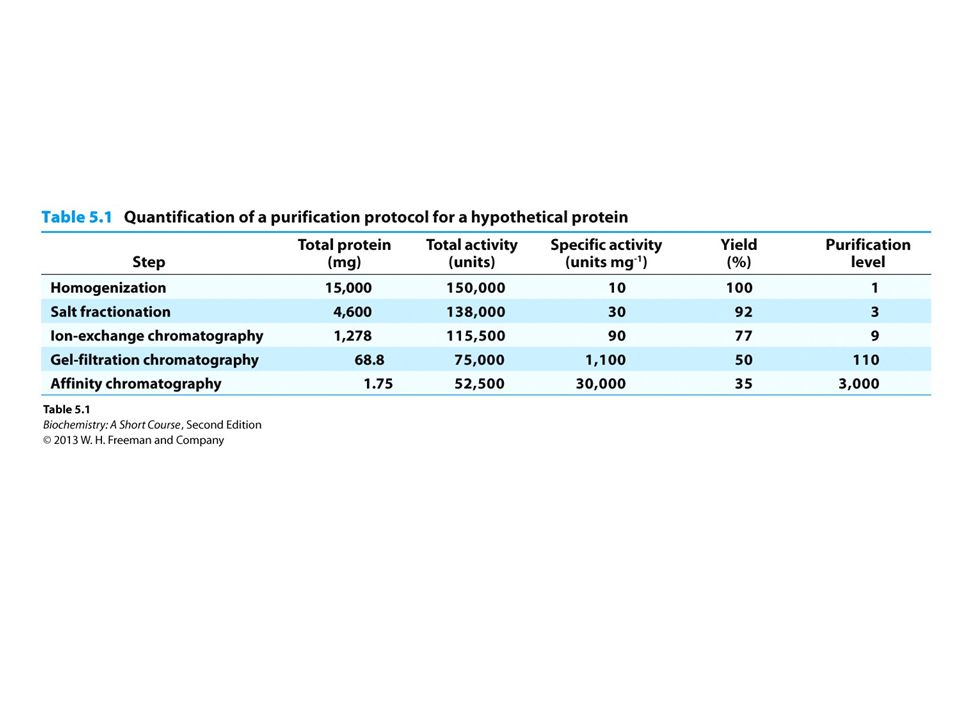
Protein purifications are monitored in part by determining the specific activity of the protein being purified. In the case of an enzyme purification, specific activity is the ratio of enzyme activity to protein concentration. Specific activity should increase with each step of the purification procedure.

9
Cells are disrupted to form a homogenate, which is a mixture of all of the components of the cell, but no intact cells. The homogenate is then centrifuged at low speed to yield a pellet consisting of nuclei and a supernatant. This supernatant is then centrifuged at a higher centrifugal force to yield another pellet and supernatant. This process, called differential centrifugation, is repeated several more times to yield a series of pellets enriched in various cellular materials and a final supernatant called the cytosol.

10
Figure 5. 1 Differential centrifugation
Figure 5.1 Differential centrifugation. Cells are disrupted in a homogenizer and the resulting mixture, called the homogenate, is centrifuged in a step-by-step fashion of increasing centrifugal force. The denser material will form a pellet at lower centrifugal force than will the less-dense material. The isolated fractions can be used for further purification. [Photographs courtesy of Dr. S. Fleischer and Dr. B. Fleischer.]

11
Salting out takes advantage of the fact that the solubility of proteins varies with the salt concentration. Most proteins require some salt to dissolve in water, a process called salting in. As the salt concentration is increased, different proteins will precipitate at different salt concentrations, a process called salting out.

12
Figure 5. 2 The dependency of protein solubility on salt concentration
Figure 5.2 The dependency of protein solubility on salt concentration. The graph shows how altering the salt concentration affects the solubility of a hypothetical protein. Different proteins will display different curves.

13
The salt can be removed from a protein solution by dialysis
The salt can be removed from a protein solution by dialysis. The protein solution is placed in a cellophane bag with pores too small to allow the protein to diffuse, but big enough to allow the salt to equilibrate with the solution surround the dialysis bag.

14
Figure 5.3 Dialysis. Protein molecules (red) are retained within the dialysis bag, whereas small molecules (blue) diffuse into the surrounding medium.
 are retained within the dialysis bag, whereas small molecules (blue) diffuse into the surrounding medium..")
15
Molecular exclusion chromatography (gel filtration chromatography) allows the separation of proteins on the basis of size. A glass column is filled with porous beads. When a protein solution is passed over the beads, large proteins cannot enter the beads and exit the column first. Small proteins can enter the beads and thus have a longer path and exit the column last.

16
Figure 5. 4 Gel-filtration chromatography
Figure 5.4 Gel-filtration chromatography. A mixture of proteins in a small volume is applied to a column filled with porous beads. Because large proteins cannot enter the internal volume of the beads, they emerge sooner than do small ones.

17
Ion exchange chromatography allows separation of proteins on the basis of charge. The beads in the column are made so as to have a charge. When a mixture of proteins are passed through the column, proteins with the same charge as on the column will exit the column quickly. Proteins with the opposite charge will bind to the beads, and are subsequently released by increasing the salt concentration or adjusting the pH of the buffer that is passed through the column.

18
Figure 5. 5 Ion-exchange chromatography
Figure 5.5 Ion-exchange chromatography. This technique separates proteins mainly according to their net charge.

19
Affinity chromatography takes advantage of the fact that some proteins have a high affinity for specific chemicals or chemical groups. Beads are made with the specific chemical attached. A protein mixture is passed through the column. Only protein with affinity for the attached group will be retained. The bound protein is then released by passing a solution enriched in the chemical to which the protein is bound.

20
Figure 5. 6 Affinity chromatography
Figure 5.6 Affinity chromatography. Affinity chromatography of concanavalin A (shown in yellow) on a solid support containing covalently attached glucose residues (G).
 on a solid support containing covalently attached glucose residues (G).")
21
The resolving power of any chromatographic technique is related to the number of potential sites of interaction between the protein and the column beads. Very fine beads allow more interactions and thus greater resolving power, but flow rates through such columns are too slow. High-pressure liquid chromatography (HPLC) uses very fine beads in metal columns and high-pressure pumps to move the liquid through the column. Because of the increased number of interaction sites, the resolving power of HPLC is greater than normal columns.
 uses very fine beads in metal columns and high-pressure pumps to move the liquid through the column. Because of the increased number of interaction sites, the resolving power of HPLC is greater than normal columns.")
22
Figure 5. 7 High-pressure liquid chromatography (HPLC)
Figure 5.7 High-pressure liquid chromatography (HPLC). Gel filtration by HPLC clearly defines the individual proteins because of its greater resolving power. Proteins are detected by their absorbance of 220-nm light waves: (1) thyroglobulin (669 kDa), (2) catalase (232 kDa), (3) bovine serum albumin (67 kDa), (4) ovalbumin (43 kDa), and (5) ribonuclease (13.4 kDa). [After K. J. Wilson and T. D. Schlabach. In Current Protocols in Molecular Biology, vol. 2, suppl. 41, F. M. Ausubel, R. Brent, R. E. Kingston, D. D. Moore, J. G. Seidman, J. A. Smith, and K. Struhl, Eds. (Wiley, 1998), p ]
. Gel filtration by HPLC clearly defines the individual proteins because of its greater resolving power. Proteins are detected by their absorbance of 220-nm light waves: (1) thyroglobulin (669 kDa), (2) catalase (232 kDa), (3) bovine serum albumin (67 kDa), (4) ovalbumin (43 kDa), and (5) ribonuclease (13.4 kDa). [After K. J. Wilson and T. D. Schlabach. In Current Protocols in Molecular Biology, vol. 2, suppl. 41, F. M. Ausubel, R. Brent, R. E. Kingston, D. D. Moore, J. G. Seidman, J. A. Smith, and K. Struhl, Eds. (Wiley, 1998), p ]")
23
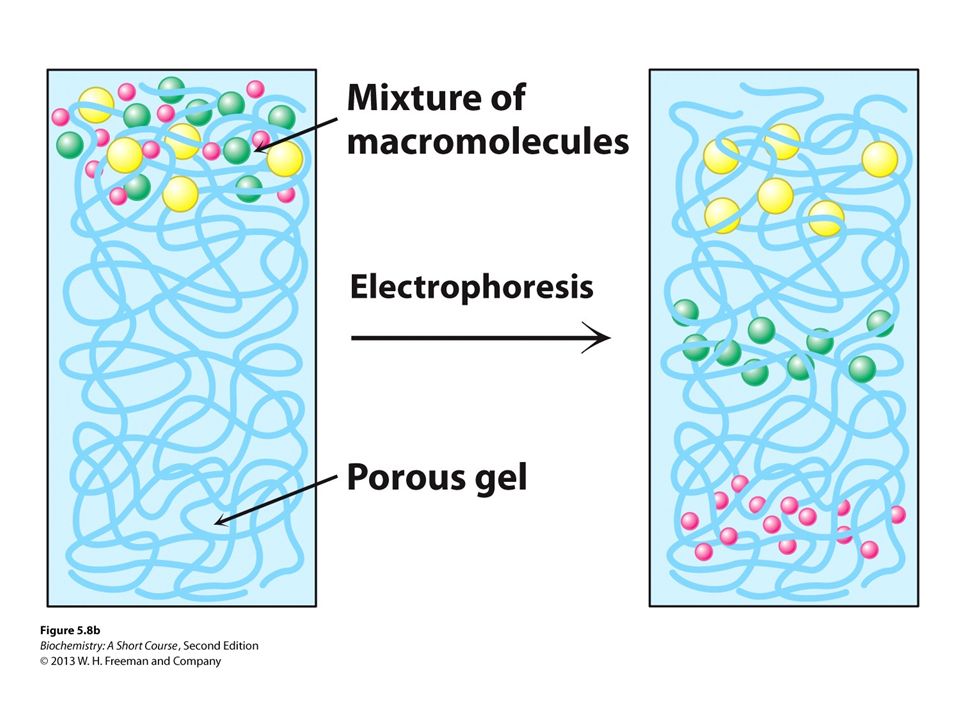
Proteins will migrate in an electrical field because they are charged
Proteins will migrate in an electrical field because they are charged. When the migration occurs in a gel, the process is called gel electrophoresis. Sodium dodecyl sulfate-polyacrylamide gel electrophoresis (SDS-PAGE) allows accurate determination of mass. SDS denatures proteins and, for most proteins, 1 molecule of SDS binds for every two amino acids. Thus, proteins have the same charge-to-mass ratio and migrate in the gel on the basis of mass only.
 allows accurate determination of mass. SDS denatures proteins and, for most proteins, 1 molecule of SDS binds for every two amino acids. Thus, proteins have the same charge-to-mass ratio and migrate in the gel on the basis of mass only.")
24
Figure 5. 8 Polyacrylamide-gel electrophoresis
Figure 5.8 Polyacrylamide-gel electrophoresis. (A) Gel-electrophoresis apparatus. Typically, several samples undergo electrophoresis on one flat polyacrylamide gel. A microliter pipette is used to place solutions of proteins in the wells of the slab. A cover is then placed over the gel chamber and voltage is applied. The negatively charged SDS (sodium dodecyl sulfate)–protein complexes migrate in the direction of the anode, at the bottom of the gel. (B) The sieving action of a porous polyacrylamide gel separates proteins according to size, with the smallest moving most rapidly.
 Gel-electrophoresis apparatus. Typically, several samples undergo electrophoresis on one flat polyacrylamide gel. A microliter pipette is used to place solutions of proteins in the wells of the slab. A cover is then placed over the gel chamber and voltage is applied. The negatively charged SDS (sodium dodecyl sulfate)–protein complexes migrate in the direction of the anode, at the bottom of the gel. (B) The sieving action of a porous polyacrylamide gel separates proteins according to size, with the smallest moving most rapidly.")
26
Proteins separated by SDS-PAGE are visualized by staining the gel with dyes such as Coomassie blue.

27
Figure 5. 9 The staining of proteins after electrophoresis
Figure 5.9 The staining of proteins after electrophoresis. Proteins subjected to electrophoresis on an SDS–polyacrylamide gel can be visualized by staining with Coomassie blue. The lane on the left is a set of marker proteins of known molecular weight. These marker proteins have been separated on the basis of size, with the smaller proteins moving farther into the gel than the larger proteins. Two different protein mixtures are in the remaining lanes. [Wellcome Photo Library.]

28
Isoelectric focusing allows separation of proteins in a gel on the basis of their relative amounts of acidic and basic amino acids. If a mixture of proteins is placed in a gel with a pH gradient and an electrical field is applied, proteins will migrate until they reach their isoelectric point (pI), the pH at which they have no net charge.
, the pH at which they have no net charge..")
29
Figure 5. 10 The principle of isoelectric focusing
Figure 5.10 The principle of isoelectric focusing. A pH gradient is established in a gel before the sample has been loaded. (A) The sample is loaded and voltage is applied. The proteins will migrate to their isoelectric pH, the location at which they have no net charge. (B) The proteins form bands that can be excised and used for further experimentation.
 The sample is loaded and voltage is applied. The proteins will migrate to their isoelectric pH, the location at which they have no net charge. (B) The proteins form bands that can be excised and used for further experimentation.")
30
In two-dimensional gel electrophoresis, proteins are separated in one direction by isoelectric focusing. This gel is then attached to an SDS-PAGE gel and electrophoresis is performed at a 90 angle to the direction of the isoelectric focusing separation.

31
Figure 5. 11 Two-dimensional gel electrophoresis
Figure 5.11 Two-dimensional gel electrophoresis. (A) A protein sample is initially fractionated in one direction by isoelectric focusing as described in Figure 5.10.The isoelectric-focusing gel is then attached to an SDS-polyacrylamide gel, and electrophoresis is performed in the second direction, perpendicular to the original separation. Proteins with the same pI value are now separated on the basis of mass.
 A protein sample is initially fractionated in one direction by isoelectric focusing as described in Figure 5.10.The isoelectric-focusing gel is then attached to an SDS-polyacrylamide gel, and electrophoresis is performed in the second direction, perpendicular to the original separation. Proteins with the same pI value are now separated on the basis of mass.")
32
Figure 5. 11 Two-dimensional gel electrophoresis. B) Proteins from E
Figure 5.11 Two-dimensional gel electrophoresis. B) Proteins from E. coli were separated by two-dimensional gel electrophoresis, resolving more than a thousand different proteins. The proteins were first separated according to their isoelectric pH in the horizontal direction and then by their apparent mass in the vertical direction. [(B) Courtesy of Dr. Patrick H. O’Farrell.]
 Proteins from E. coli were separated by two-dimensional gel electrophoresis, resolving more than a thousand different proteins. The proteins were first separated according to their isoelectric pH in the horizontal direction and then by their apparent mass in the vertical direction. [(B) Courtesy of Dr. Patrick H. O’Farrell.]")
33
Figure 5.12 Alterations in protein levels detected by two-dimensional gel electrophoresis. Samples of (A) normal colon mucosa and (B) colorectal tumor tissue from the same person were analyzed by two-dimensional gel electrophoresis. In the gel section shown, changes in the intensity of several spots are evident, including a dramatic increase in levels of the protein indicated by the arrow, corresponding to the enzyme glyceraldehyde-3-phosphate dehydrogenase. [Courtesy of Lin Quinsong © 2010, The American Society for Biochemistry and Molecular Biology.]
 normal colon mucosa and (B) colorectal tumor tissue from the same person were analyzed by two-dimensional gel electrophoresis. In the gel section shown, changes in the intensity of several spots are evident, including a dramatic increase in levels of the protein indicated by the arrow, corresponding to the enzyme glyceraldehyde-3-phosphate dehydrogenase. [Courtesy of Lin Quinsong © 2010, The American Society for Biochemistry and Molecular Biology.].")
34
The effectiveness of a purification scheme is measured by calculating the specific activity after each separation technique. SDS-PAGE allows a visual evaluation of the purification scheme.

36
Figure 5. 13 Electrophoretic analysis of a protein purification
Figure 5.13 Electrophoretic analysis of a protein purification. The purification scheme in Table 5.1 was analyzed by SDS-PAGE. Each lane contained 50 μg of sample. The effectiveness of the purification can be seen as the band for the protein of interest becomes more prominent relative to other bands.

38
The estrogen receptor binds the steroid hormone estradiol tightly and with great specificity.
The estrogen receptor has no enzymatic activity, but can be purified by immunological techniques and the use of gradient centrifugation.

39
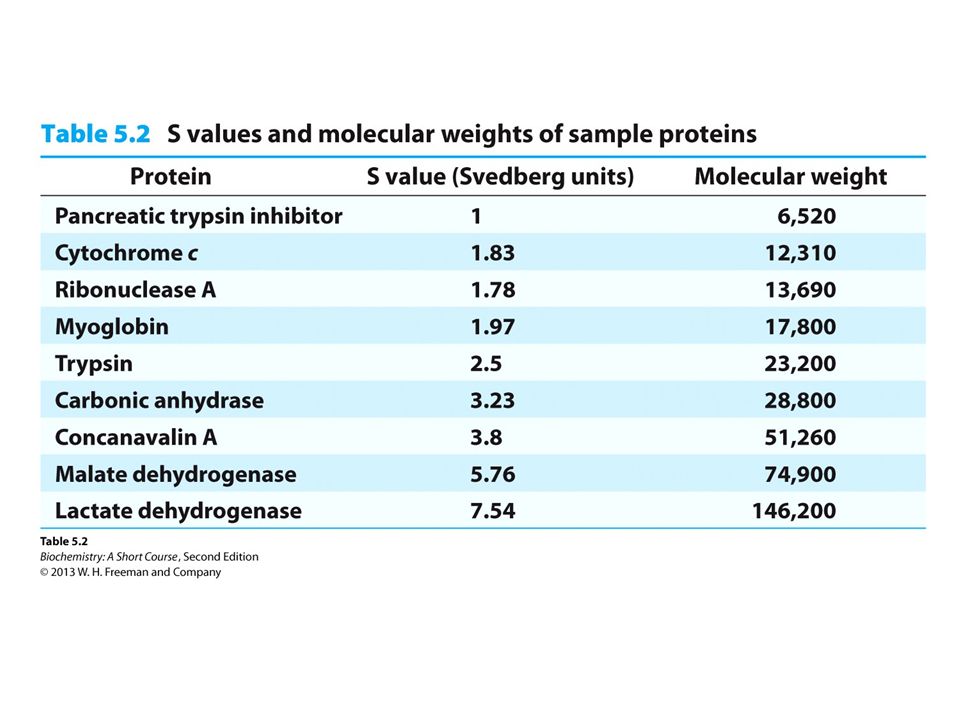
Ultracentrifugation can be used to examine proteins
Ultracentrifugation can be used to examine proteins. When subjected to a centrifugal force, the rate of movement of the particle is defined by the sedimentation coefficient, s. Where m = mass, = the partial specific volume (the reciprocal of the particle density), ρ =density of the medium, and = the frictional coefficient of the particle.
, ρ =density of the medium, and = the frictional coefficient of the particle.")
40
5.3 Immunological Techniques Are Used to Purify and Characterize Proteins
Sedimentation coefficients are usually expressed as Svedberg units (S) equal to s. The smaller the S value, the slower the protein moves in a centrifugal field.
 equal to s. The smaller the S value, the slower the protein moves in a centrifugal field.")
Similar presentations


 Electrical force is another way we can cause macromolecules to move – Macromolecules tend to have.>")


![Salting in and Salting out of proteins and Dialysis (Isolation Of Lactate Dehydrogenase Enzyme ) BCH 333 [practical]](/16/4880701/big_thumb.jpg "Salting in and Salting out of proteins and Dialysis (Isolation Of Lactate Dehydrogenase Enzyme ) BCH 333 [practical]>")


