Download presentation
Presentation is loading. Please wait.

1
Data Analysis

2
Qualitative vs. Quantitative Data collection methods can be roughly divided into two groups. It is essential to understand the difference between them…Data collection methods can be roughly divided into two groups. It is essential to understand the difference between them… Quantitative – Research conducted with the aim of generating measurable numerical data. It assumes that variables can be identified and the relationships between them measured using statistics, with the aim of inferring cause-effect relationships. The hypothesis is tested using numerical data – i.e. statistical significanceQuantitative – Research conducted with the aim of generating measurable numerical data. It assumes that variables can be identified and the relationships between them measured using statistics, with the aim of inferring cause-effect relationships. The hypothesis is tested using numerical data – i.e. statistical significance Eg. Experiments; correlational studies; numerical surveysEg. Experiments; correlational studies; numerical surveys

3
Qualitative Qualitative – Research conducted with the aim of generating subjective, descriptive data. Rather than testing a theory with a hypothesis, qualitative research tries to construct these theories.Qualitative – Research conducted with the aim of generating subjective, descriptive data. Rather than testing a theory with a hypothesis, qualitative research tries to construct these theories. Eg. Interviews, case studies, observationsEg. Interviews, case studies, observations The emphasis of this research is not on reliability and validity but on the detail and coherence of the designThe emphasis of this research is not on reliability and validity but on the detail and coherence of the design

4
Triangulation The use of combinations of methodologies and approaches to corroborate results is referred to as triangulationThe use of combinations of methodologies and approaches to corroborate results is referred to as triangulation In order to increase the reliability and validity of an experiment. Researchers will use BOTH qualitative and quantitative methods in a single study and compare the results.In order to increase the reliability and validity of an experiment. Researchers will use BOTH qualitative and quantitative methods in a single study and compare the results.

5
Does the data support the hypothesis? Once the appropriate inquiry method has been selected and the data gathered. The last and most important step is to determine what the data is telling you. They key method of data analysis is statistics.

6
Data analysis Statistics – the use of mathematics to organize, summarize, and interpret numerical data. There are two kinds: Descriptive statistics – used to organize and summarize data. Inferential statistics – used to interpret data and draw conclusions.

7
Descriptive statistics Statistics can be used to organize data so it clearly describes what has occurred. There are three main descriptive statistics: Central tendency Variability Coefficient of correlation

8
Central tendency Central tendency – patterns of frequency, predictability, or typical results in a set of numerical data. There are three measures… Mean – the arithmetic average of the scores in a distribution. Median – is the score that falls exactly in the center of a distribution of scores. Mode – the most frequent score in a distribution.

9
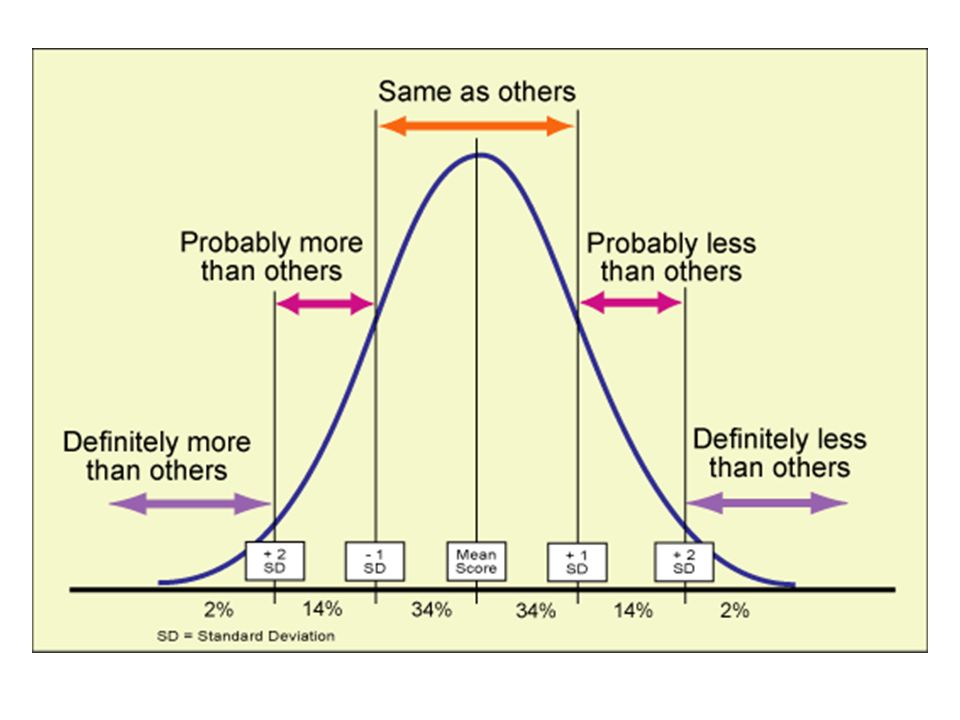
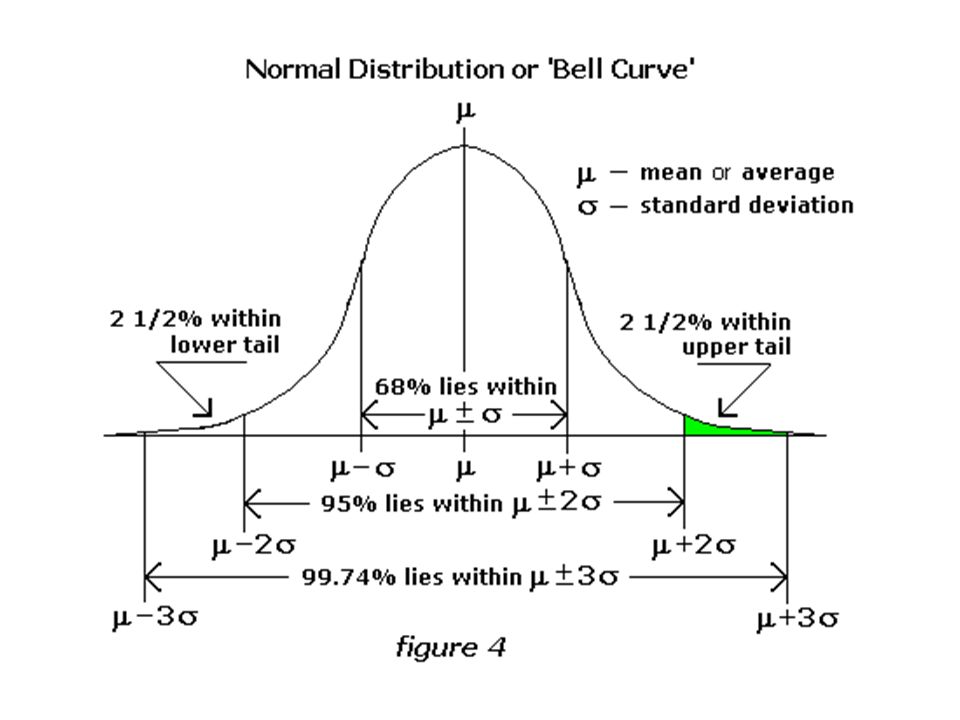
Variability Is what you have recorded accurate? Does it support your hypothesis? Variability – how much the scores in a data set vary from each other and from the mean. Standard deviation – an index of the amount of variability in a data set. When the standard deviation is large, the variability is great, if it is small,then the variability is small as well.

12
Correlation Is there a relationship between two variables? If there is, how reliable is it and can I make certain predictions with this data? Correlation – when two variables are related to each other. They can be positive in the same direction, or negative in the opposite direction, and weak or strong. Scatterplot – data table with one variable represented on the the X axis and the independent variable on the Y axis. Individual results are plotted to observe a correlation.

13
Positive correlation – a high value of variable X means a high value of Y.

14
Negative correlation – a high value of X means a low value of Y.

15
Correlation coefficient – a numerical index of the degree of relationship between two variables. It indicates which direction (positive or negative) the relationship works and how strongly (.0 to 1.0) the two variables are related.
 the relationship works and how strongly (.0 to 1.0) the two variables are related..")
16
Causal fallacy Causation – where one variable causes a change in another. Even though two variables are strongly correlated, we do not know HOW they are related, they may not have a causal relationship.

17
Chance…. Statistical significance – is said to exist when the probability that the observed findings are due to chance is very low. For psychological findings, the threshold of 5% or.05 is considered statistically significant. That is, 5 chance results in 100.

18
Testing the hypothesis Null hypothesis (H) – the statement of a zero (or null) difference that is statistically tested. The negative version of the original claim of a study. Alternative hypothesis (H 1 ) – the statement we must accept if the statistical test of the null hypothesis is false.
 – the statement we must accept if the statistical test of the null hypothesis is false..")
19
Error Type I error – the mistake of rejecting the null hypothesis when it is true (symbol – α) Type II error – the mistake of failing to reject the null hypothesis when it is false (symbol – β) To decrease α or β we should increase the sample size We also use this error judgement to determine our acceptable error levels (.01,.05) We should form claims so that the most serious error is the type 1 error The condition of equality should become the Ho Null hypothesis is true Null hypothesis is false We decide to reject the null Type 1 errorRight! We decide to accept the null Right!Type 2 error

20
Confirm the null hypothesis Test statistic – a computed sample value based on the sample data that is used to make the final determination confirming or rejecting the null hypothesis Critical region – the set of all values of the test statistic that would cause us to reject the null hypothesis Critical values – the value or values that separates the critical region from the values of the test statistic that would lead us to reject the null hypothesis, this will depend on –the type of hypothesis (one or two tailed) –the sampling distribution (normal or skewed) –the level of significance (type of possible error and consequence) t,p,z α σ – determined error value
 –the sampling distribution (normal or skewed) –the level of significance (type of possible error and consequence) t,p,z α σ – determined error value")
21
Test statistic z – calculation: t – calculation: The difference between both is the size of the sample or population under investigation

22
Degrees of freedom Based on the size of the sample Affects the height of the distribution Along with the type of hypothesis, used to calculate the critical region Df = N-1

23
Is our experiment statically significant? What we need: N – number of subjects X – mean SD – standard deviation (or s² - variance) Step 1 – find the standard deviation of the sample set Step 2 – calculate the difference in variance Step 3 – calculate the t-value Step 4 - Using an error =.01 and a one-tailed t-test, the value of t found in the t-tables would be:
 Step 1 – find the standard deviation of the sample set Step 2 – calculate the difference in variance Step 3 – calculate the t-value Step 4 - Using an error =.01 and a one-tailed t-test, the value of t found in the t-tables would be:.")
24
Apply these principles to the Memory study… Is there a correlation between the time of the morning and short term memory performance? What are some uncontrolled variables that should have been considered? What should be done about our results?

Similar presentations