Download presentation
Presentation is loading. Please wait.

1
Biological Network Analysis
Kimberly Glass BIO508 April 9, 2014

2
Outline Network models Network properties Network paths Network motifs
Information flow Graph clustering Biological networks Relational networks Correlative networks Causative/regulatory networks Applications Biological data integration Function prediction Resources and tools

3
Outline Network models Network properties Network paths Network motifs
Information flow Graph clustering Biological networks Relational networks Correlative networks Causative/regulatory networks Applications Biological data integration Function prediction Resources and tools

4
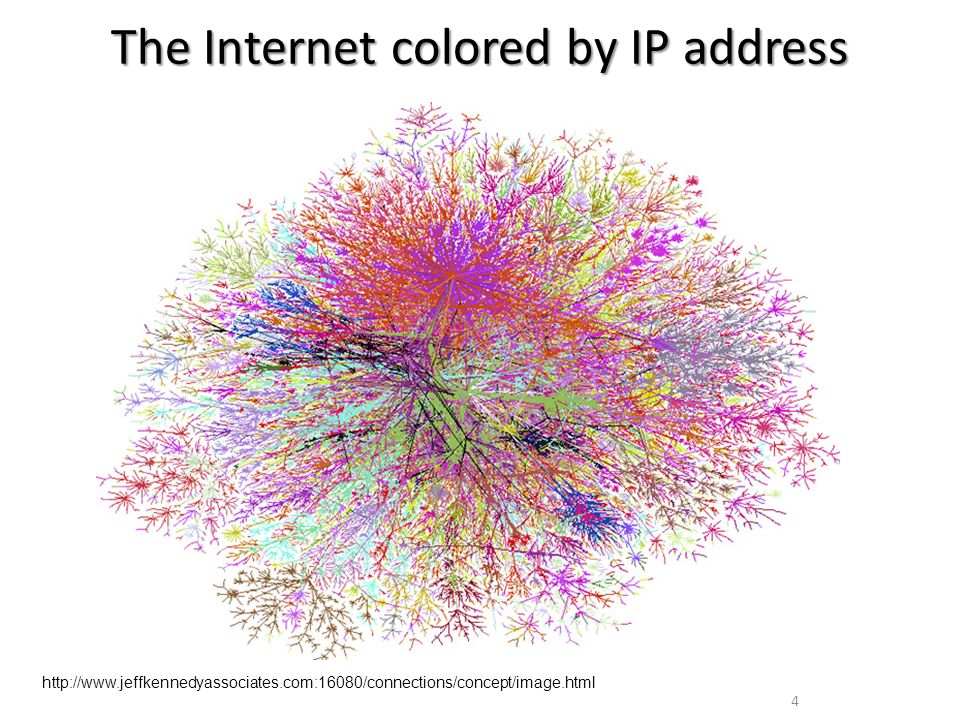
The Internet colored by IP address
5
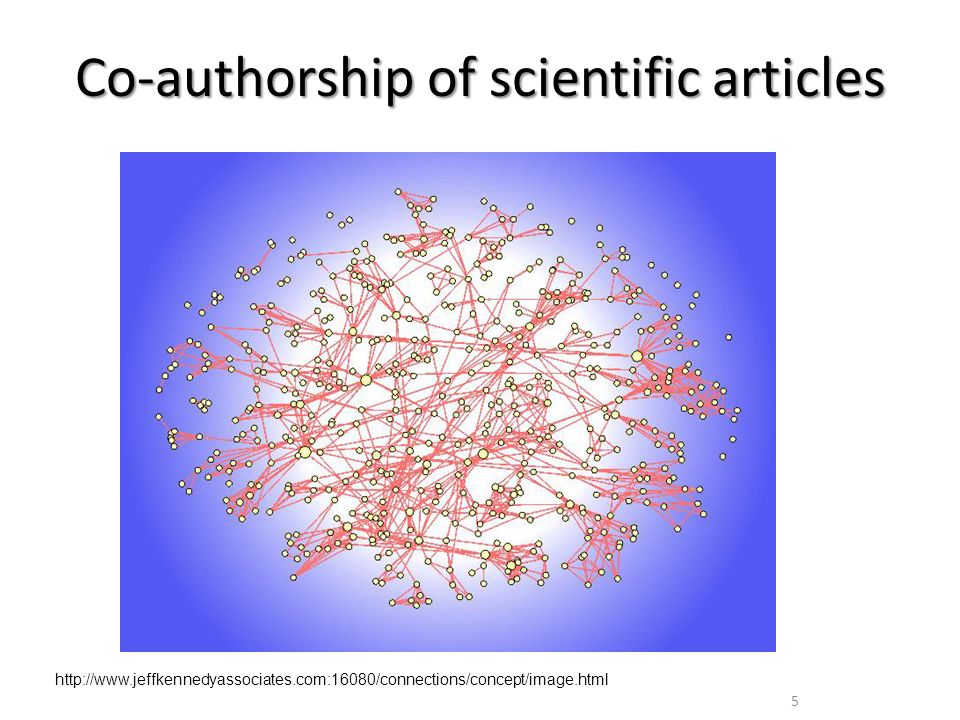
Co-authorship of scientific articles
6
Networks in Molecular Biology
Protein-Protein interactions Protein-DNA interactions Genetic interactions Metabolic reactions Co-expression interactions Text mining interactions Association Networks Etc. Barabasi & Oltvai, Nature Reviews, 2004

7
Graphs Graph G=(V,E) is a set of vertices V and edges E
V = {v1, v2, v3, v4, v5} E = {(v1, v2), (v1, v3), (v2, v4), (v2, v5) , (v3, v5)} A subgraph G’ of G is induced by some V’ V and E’ E For example, V’ = {v1, v2, v3} and E’ = {(v1, v2), (v1, v3)} Graph properties: Directed vs. undirected Weighted vs. unweighted Cyclic vs. acyclic Connectivity (node degree, paths) v2 v5 v3 v1 v2 v3
, (v1, v3), (v2, v4), (v2, v5) , (v3, v5)} A subgraph G’ of G is induced by some V’ V and E’ E. For example, V’ = {v1, v2, v3} and E’ = {(v1, v2), (v1, v3)} Graph properties: Directed vs. undirected. Weighted vs. unweighted. Cyclic vs. acyclic. Connectivity (node degree, paths) v2. v5. v3. v1. v2. v3.")
8
Networks and Graphs: Terminology
Formally, a network is a graph is… G = (V, E), an ordered tuple of two sets V = {v1, …, vn}, a set of unique nodes, and E = {(vi, vj), …}, a set of (un)ordered node tuples Bipartite Cyclic Multigraph Acyclic (DAG) Weighted 0.5 1.2 6 -2 Loops (Self-connections) Undirected Directed
, an ordered tuple of two sets. V = {v1, …, vn}, a set of unique nodes, and. E = {(vi, vj), …}, a set of (un)ordered node tuples. Bipartite. Cyclic. Multigraph. Acyclic. (DAG) Weighted Loops (Self-connections) Undirected. Directed.")
9
Sparse vs Dense G(V, E) where |V|=n, |E|=m the number of vertices and edges Graph is sparse if m~n Graph is dense if m~n2 Complete graph when m=n2

10
Connected Components G(V,E) |V| = 69 |E| = 71
 |V| = 69 |E| = 71")
11
Connected Components G(V,E) |V| = 69 |E| = 71 6 connected components
 |V| = 69 |E| = 71 6 connected components")
12
Paths A path is a sequence {x1, x2,…, xn} such that (x1,x2), (x2,x3), …, (xn-1,xn) are edges of the graph. A closed path xn=x1 on a graph is called a graph cycle or circuit.

13
Shortest-Path between nodes

14
Shortest-Path between nodes

15
Longest Shortest-Path

16
Network paths and diameter
Shortest path: Connect two nodes by as few edges as possible Network diameter: The longest shortest path in the network The network diameter is often very short: ‘Small world network’

17
Network Motifs: Simple Building Blocks
of Complex Networks Milo, Alon, et. al. Science Oct 25;298(5594):824-7
:")
18
Network Motifs Feedback Positive auto-regulation
Negative auto-regulation memory delay speed + stability Coherent feed-forward Bi-fan filter Incoherent feed-forward Whole Genome Duplication and evolvability pulse

19
Network Motifs: Simple Building Blocks
of Complex Networks Milo, Alon, et. al. Science Oct 25;298(5594):824-7
:")
20
Network Motifs: Simple Building Blocks
of Complex Networks Shen-Orr, Alon et.al. Nature Genetics, 2002 May;31(1):64-8.
:64-8.")
21
Degree or connectivity

22
Random vs scale-free networks
P(k) is probability of each degree k, i.e fraction of nodes having that degree. For random networks, P(k) is normally distributed. For real networks the distribution is often a power-law: P(k) ~ k-g Such networks are said to be scale-free
 is probability of each degree k, i.e fraction of nodes having that degree. For random networks, P(k) is normally distributed. For real networks the distribution is often a power-law: P(k) ~ k-g. Such networks are said to be scale-free.")
23
Knock-out lethality and connectivity

24
Clustering coefficient
The density of the network surrounding node I, characterized as the number of triangles through I. Related to network modularity k: neighbors of I nI: edges between node I’s neighbors The center node has 8 (grey) neighbors There are 4 edges between the neighbors C = 2*4 /(8*(8-1)) = 8/56 = 1/7
 neighbors. There are 4 edges between the neighbors. C = 2*4 /(8*(8-1)) = 8/56 = 1/7.")
25
Mixing Properties of Networks
Assortative Network Nodes tend to connect to other nodes of similar degree Disassortative Network Nodes tend to connect to other nodes of dissimilar degree

26
Network Structure: Hubs, Bottlenecks, and Information Flow
26

27
Network Structure: Cliques and Clusters
Clique: fully connected subgraph Quasi-clique: near-miss k-clique: clique of size exactly k Maximal clique: largest clique in graph

28
Outline Networks as a model Network properties Network paths
Network motifs Information flow Graph clustering Biological networks Relational networks Correlative networks Causative/regulatory networks Applications Biological data integration Function prediction Resources and tools

29
How is biological data represented in networks?
High Correlation Low Gene expression Physical PPIs Genetic interactions Colocalization Sequence Protein domains Regulatory binding sites … + =

30
Building and Interpreting Biological Networks
How we build a biological network depends on what data we have AND what we want the edges in the network to represent. The meaning of the edges in a biological network depend on the method used to generate those edges. Influences how we interpret the interactions in a network. node: an object in the network (e.g. genes) edge: indicates relationship between two nodes
 edge: indicates relationship between two nodes.")
31
Interpreting the “edges” in Biological Networks
Relational Networks Generally Undirected (non-causal relationships) Nodes all of same “type” Generally no “signs” on edges Example: Protein A is a dimerization partner with protein B. A B Correlation Network Undirected (non-causal relationships) Nodes all of same “type” Edges can have “signs” Example: When the expression of Gene A changes, so does the expression for Gene B. A B *Correlation is not causation. Regulatory Network Directed Network (causal relationships) Can have “types” of nodes Edges can have “signs” Example: TF A regulates Gene B. A B
 Nodes all of same type Generally no signs on edges. Example: Protein A is a dimerization partner with protein B. A. B. Correlation Network. Undirected (non-causal relationships) Nodes all of same type Edges can have signs Example: When the expression of Gene A changes, so does the expression for Gene B. A. B. *Correlation is not causation. Regulatory Network. Directed Network (causal relationships) Can have types of nodes. Edges can have signs Example: TF A regulates. Gene B. A. B.")
32
Types of Protein Interactions
Physical Protein Interactions Edge between proteins if they physically interact Wild Type Viable Cell Death X Synthetic Lethality Edge between proteins if mutating both causes lethality

33
Functional Associations Between Processes
Edges Associations between processes Very Strong Moderately Gene Ontology: structured as a directed acyclic graph (DAG) Ashburger et al. Gene Ontology: tool for the unification of biology. Nature Genetics 2000.
 Ashburger et al. Gene Ontology: tool for the unification of biology. Nature Genetics")
34
Functional Associations Between Genes
Level of shared function between genes Edge between two genes if they are involved in many of the same biological processes

35
Interpreting the “edges” in Biological Networks
Relational Networks Generally Undirected (non-causal relationships) Nodes all of same “type” Generally no “signs” on edges Example: Protein A is a dimerization partner with protein B. A B Correlation Network Undirected (non-causal relationships) Nodes all of same “type” Edges can have “signs” Example: When the expression of Gene A changes, so does the expression for Gene B. A B *Correlation is not causation. Regulatory Network Directed Network (causal relationships) Can have “types” of nodes Edges can have “signs” Example: TF A regulates Gene B. A B
 Nodes all of same type Generally no signs on edges. Example: Protein A is a dimerization partner with protein B. A. B. Correlation Network. Undirected (non-causal relationships) Nodes all of same type Edges can have signs Example: When the expression of Gene A changes, so does the expression for Gene B. A. B. *Correlation is not causation. Regulatory Network. Directed Network (causal relationships) Can have types of nodes. Edges can have signs Example: TF A regulates. Gene B. A. B.")
36
Network inference from expression data
Margolin and Califano, Ann. N.Y. Acad. Sci. 1115: 51–72 (2007). Differential equations Boolean Networks Linear Regression Bayesian networks Information theoretic models Latent variable networks conditions genes Focusing on gene expression is a simplification. But let’s us to put our hand on it.
. Differential equations. Boolean Networks. Linear Regression. Bayesian networks. Information theoretic models. Latent variable networks. conditions. genes. Focusing on gene expression is a simplification. But let’s us to put our hand on it.")
37
Correlation is the simplest metric for co-expression
genes genes conditions genes

38
Mutual Information is a Measure of Non-linear Correlation
Pearson correlation value Source:

39
Mutual Information (MI)
Definition Properties Measures how much knowing one of these variables reduces uncertainty about the other Positive and symmetric Invariant under nonlinear transformation Network Reconstruction Algorithms that use MI: ARACNE CLR

40
(Algorithm for the Reconstruction of Accurate Cellular Networks)
ARACNe (Algorithm for the Reconstruction of Accurate Cellular Networks) Margolin, Califano et al. BMC Bioinformatics Mar 20;7 Suppl 1:S7.
 Margolin, Califano et al. BMC Bioinformatics Mar 20;7 Suppl 1:S7.")
41
(Algorithm for the Reconstruction of Accurate Cellular Networks)
ARACNe (Algorithm for the Reconstruction of Accurate Cellular Networks) Margolin, Califano et al. BMC Bioinformatics Mar 20;7 Suppl 1:S7. Key Idea: Remove indirect relationships.
 Margolin, Califano et al. BMC Bioinformatics Mar 20;7 Suppl 1:S7. Key Idea: Remove indirect relationships.")
42
CLR (Context Likelihood of Relatedness)
Faith, Gardner et al. PLoS Biol Jan;5(1):e8.
:e8.")
43
CLR (Context Likelihood of Relatedness)
Faith, Gardner et al. PLoS Biol Jan;5(1):e8. Key Idea: Normalize the MI for each gene pair against its corresponding background.
:e8. Key Idea: Normalize the MI for each gene pair against its corresponding background.")
44
Interpreting the “edges” in Biological Networks
Relational Networks Generally Undirected (non-causal relationships) Nodes all of same “type” Generally no “signs” on edges Example: Protein A is a dimerization partner with protein B. A B Correlation Network Undirected (non-causal relationships) Nodes all of same “type” Edges can have “signs” Example: When the expression of Gene A changes, so does the expression for Gene B. A B *Correlation is not causation. Regulatory Network Directed Network (causal relationships) Can have “types” of nodes Edges can have “signs” Example: TF A regulates Gene B. A B
 Nodes all of same type Generally no signs on edges. Example: Protein A is a dimerization partner with protein B. A. B. Correlation Network. Undirected (non-causal relationships) Nodes all of same type Edges can have signs Example: When the expression of Gene A changes, so does the expression for Gene B. A. B. *Correlation is not causation. Regulatory Network. Directed Network (causal relationships) Can have types of nodes. Edges can have signs Example: TF A regulates. Gene B. A. B.")
45
Thinking of Gene Regulation As a Network
Nodes are genes, edges indicate causal relationships between genes (“TF A regulates gene B”) Networks are directed, from transcription factors to target genes (some of which are also transcription factors) Edges in gene regulatory networks can have signs corresponding to target gene activation (increased transcription) and gene repression (prevention of transcription) note that edge signs are hard to measure in practice. Transcription Factor Target Gene TF A activates gene B Transcription Factor Target Gene TF A represses gene B
 Networks are directed, from transcription factors to target genes (some of which are also transcription factors) Edges in gene regulatory networks can have signs corresponding to target gene activation (increased transcription) and gene repression (prevention of transcription) note that edge signs are hard to measure in practice. Transcription Factor. Target Gene. TF A activates gene B. Transcription Factor. Target Gene. TF A represses gene B.")
46
How Can We Model GRNs in Human Systems? TF1 TF2 TF3
TF-Gene Regulation Data Two main ways to produce this type of network: G1 TF1 Experimentally Computationally Technique: ChIP-chip Technique: DNA sequence scan for TF binding sites Limitations: very expensive, limited number of ChIP antibodies Limitations: only know recognitions sequences for 10-20% of TFs, prone to false positives, not environment-specific Strength: High quality, environment-specific Strengths: cheap G2 G3 TF2 G4 G5 TF3 TF4 G6

47
Outline Networks as a model Network properties Network paths
Network motifs Information flow Graph clustering Biological networks Relational networks Correlative networks Causative/regulatory networks Applications Biological data integration Function prediction Resources and tools

48
Incorporating Epigenetic Information With TF Sequence-motif Data
All potential interactions Motif found within gene’s promoter Interactions with Epigenetic Evidence Motif found in gene’s promoter and located in region of open chromatin Epigenetic data motif TF1 Gene1 Gene1 Gene2 Gene3 Gene4 Open Chromatin (DNase hypersensitivity site)
")
49
Relationship between Expression Information and Gene Regulation
Experimental (ChIP-chip) Computational (motif) Gene Expression Limited antibodies (sparse) Quality of PWM Large amount of data Environment specific Not environment specific Non-functional targets Non-functional sequences Correlation is not causation “Good quality, sparse, expensive” “Poor quality, dense, cheap” Regulatory Network combination
 Computational (motif) Gene Expression. Limited antibodies (sparse) Quality of PWM. Large amount of data. Environment specific. Not environment specific. Non-functional targets. Non-functional sequences. Correlation is not causation. Good quality, sparse, expensive Poor quality, dense, cheap Regulatory Network. combination.")
50
Relationship between Expression Information and Gene Regulation
Correlation of expression might occur when: One gene regulates another Two genes are regulated by the same TF. Gene Expression Large amount of data Environment specific Correlation is not causation TF TF is expressed Sometime later….. genes are expressed Correlation in two genes’ expression patterns is actually more often a measure of co-regulation

51
Relationship between Expression Information and Gene Regulation
? TF1 G2 G1 Correlated expression Example: G2 The expression of G1 and G2 is highly correlated Since TF1 targets G1, there is a higher possibility that TF1 also regulated G2.

52
Protein Interaction Is Related to Regulation
Some transcription factors don’t bind a particular DNA sequence. TFs can regulate a gene: Through direct interaction with the control (promoter) region of that gene. By forming a complex with other TFs which directly interact with the promoter region of that gene. We can model protein interactions as a network.
 region of that gene. By forming a complex with other TFs which directly interact with the promoter region of that gene. We can model protein interactions as a network.")
53
Protein-Protein Interaction Data TF-Gene Regulation Data
Relationship between Protein Interaction Information and Gene Regulation Protein-Protein Interaction Data TF-Gene Regulation Data G1 TF1 TF1 TF4 G2 G3 TF5 TF2 TF2 G4 G5 TF3 TF3 TF4 Know recognition sequence

54
Protein-Protein Interaction Data TF-Gene Regulation Data
Relationship between Protein Interaction Information and Gene Regulation Protein-Protein Interaction Data TF-Gene Regulation Data G1 TF1 TF1 TF4 G2 G3 TF5 TF2 TF2 G4 G5 TF3 TF3 TF4

55
Relationship between Protein Interaction Information and Gene Regulation
Integrated Network Example: G3 TF1 and TF2 are potential regulators. Since TF5 interacts with both TF1 and TF2, there is higher possibility that TF5 is also involved in the regulation of G3. G1 TF1 G2 G3 TF5 TF2 G4 G5 TF3 TF4 TF-Gene Regulation Protein-Protein Interaction

56
Outline Networks as a model Network properties Network paths
Network motifs Information flow Graph clustering Biological networks Relational networks Correlative networks Causative/regulatory networks Applications Biological data integration Function prediction Resources and tools

57
Functional mapping: mining biological networks
Predicted relationships between genes High Confidence Low The strength of these relationships indicates how cohesive a process is. Cell cycle genes

58
Functional mapping: mining biological networks
Predicted relationships between genes High Confidence Low Cell cycle genes

59
Functional mapping: mining biological networks
Predicted relationships between genes High Confidence Low The strength of these relationships indicates how associated two processes are. Cell cycle genes DNA replication genes

60
Predicting gene function
Predicted relationships between genes High Confidence Low Cell cycle genes

61
Predicting gene function
Predicted relationships between genes High Confidence Low Cell cycle genes

62
Predicting gene function
Predicted relationships between genes High Confidence Low These edges provide a measure of how likely a gene is to specifically participate in the process of interest. Cell cycle genes

63
Outline Networks as a model Network properties Network paths
Network motifs Information flow Graph clustering Biological networks Relational networks Correlative networks Causative/regulatory networks Applications Biological data integration Function prediction Resources and tools

64
Known Gene Regulatory Network: E. coli
E. coli is a single-celled organism with a circular DNA structure encoding approximately 4000 genes (about 2500 “operons”) Probably has with most complete experimentally-constructed gene regulatory network. Used for many early investigations into GRN structure.
 Probably has with most complete experimentally-constructed gene regulatory network. Used for many early investigations into GRN structure.")
65
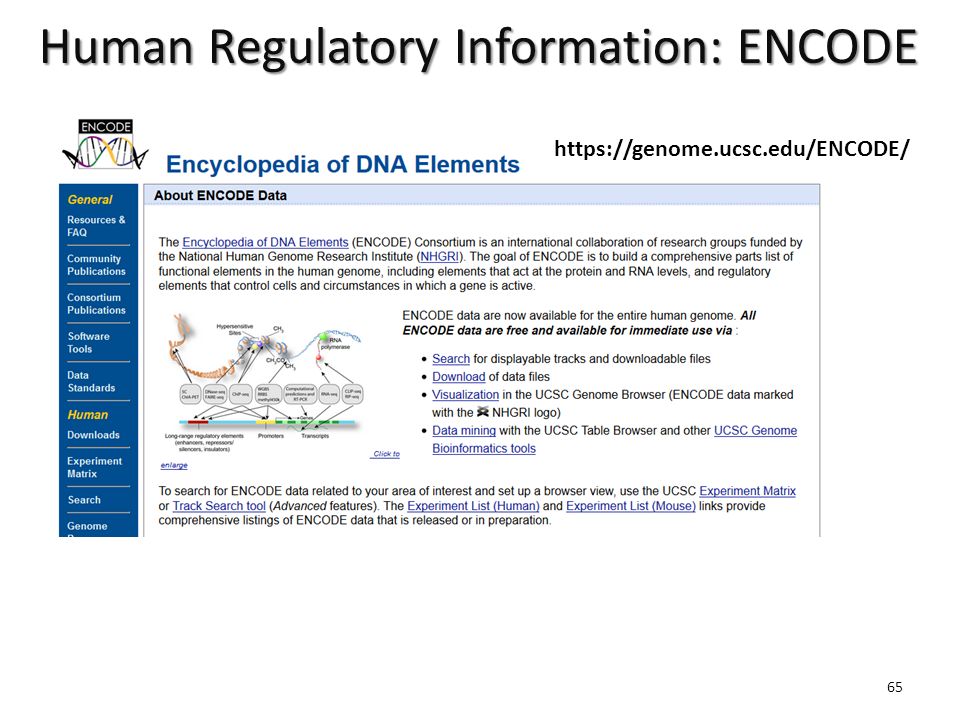
Human Regulatory Information: ENCODE
66
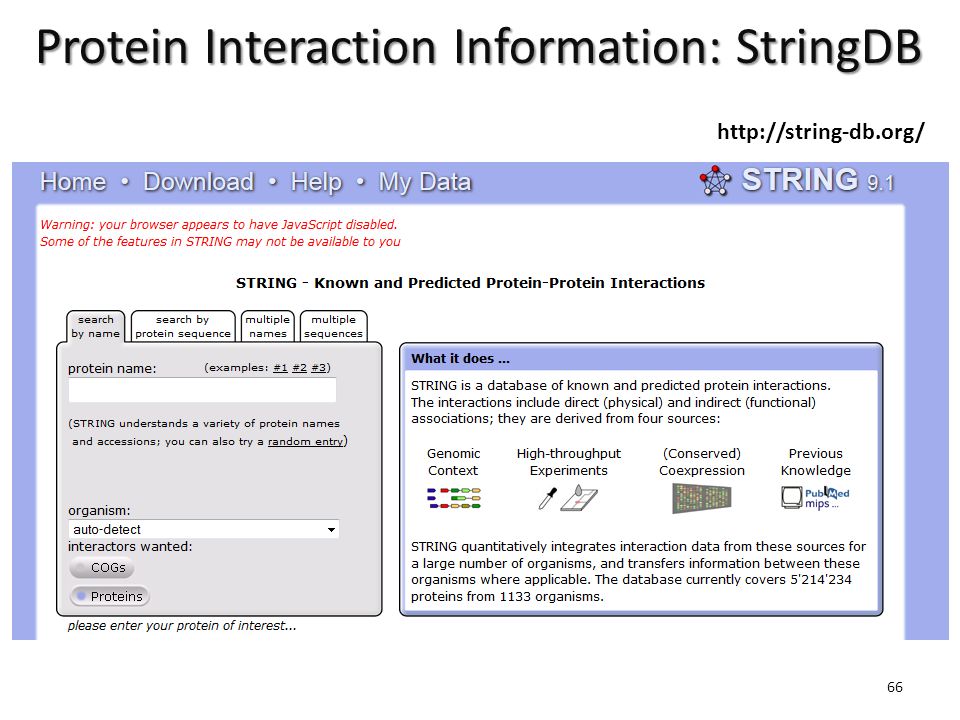
Protein Interaction Information: StringDB
67
Pathway Information http://www.biocarta.com/
68
Network Analysis and Visualization
Similar presentations


 11/05/07. Methods Linear –PCA (Raychaudhuri et al. 2000) –NIR (Gardner et al. 2003) Nonlinear –Bayesian network (Friedman.>")


 Y. Lahini.>")