Download presentation
Presentation is loading. Please wait.

1
Semmelweis University Publication Database Semmelweis University Publication Database László Hunyady MD, PhD, DSc Department of Physiology Semmelweis University, Budapest

3
Comparing economic and scientific wealth Source: www.mta.hu

4
GDP and R&D in the European Union 1 *Source: Essential Science Indicators, 2006

5
GDP and R&D in the European Union 2 *Source: Essential Science Indicators, 2006

6
GDP and R&D in the European Union 3 *Source: Essential Science Indicators, 2006

7
GDP and R&D in the European Union 4 *Source: Essential Science Indicators, 2006

9
Source: www.mta.hu Biomedical research in Hungarian institutions

10
Semmelweis University Publication Database 1. ResearchersDepartmentsFacultiesUniversity

11
Semmelweis University Publication Database 2. 1.Bibliography (including impact factors) !! 2.Abstracts !! 3.Publication types 4.Affiliations !! 5.Citations (incl. independent) ? 6.Articles in PDF ?
 . 6.Articles in PDF .")
12
Semmelweis University Publication Database 3. Possible sources of information: 1.PubMed (Medline) 2.Web of Science 3.Scopus
 2.Web of Science 3.Scopus.")
13
Semmelweis publications (1996-2005):
:")
14
Semmelweis University Publication Database 4. Strategy: 1.Password protection (Neptun) 2.Clear institutional structure (Neptun) 3.Initial data should be provided by the University 4.Data refinement by authors/departments 5.Control provided by the Central Library 6.Bibliographic information should be available publicly
 2.Clear institutional structure (Neptun) 3.Initial data should be provided by the University 4.Data refinement by authors/departments 5.Control provided by the Central Library 6.Bibliographic information should be available publicly.")
15
In 1969 the University was named after Ignac Semmelweis (1818 – 1865)
")
16
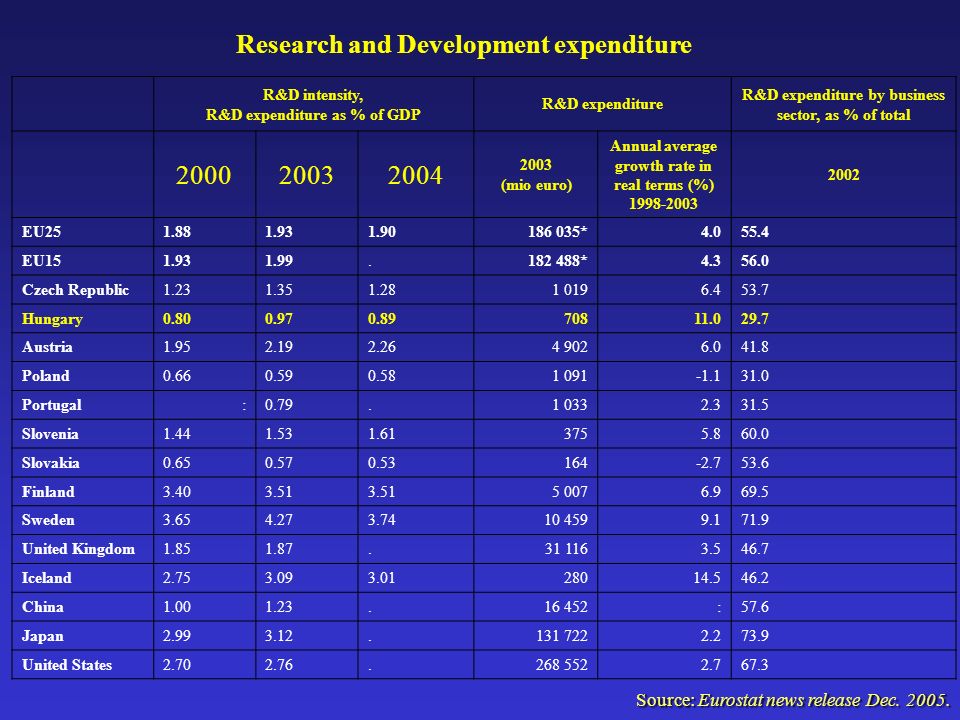
Research and Development expenditure R&D intensity, R&D expenditure as % of GDP R&D expenditure R&D expenditure by business sector, as % of total 200020032004 2003 (mio euro) Annual average growth rate in real terms (%) 1998-2003 2002 EU25 1.881.931.90186 035* 4.055.4 EU15 1.931.99.182 488* 4.356.0 Czech Republic 1.231.351.281 019 6.453.7 Hungary 0.800.970.89708 11.029.7 Austria 1.952.192.264 902 6.041.8 Poland 0.660.590.581 091 -1.131.0 Portugal :0.79.1 033 2.331.5 Slovenia 1.441.531.61375 5.860.0 Slovakia 0.650.570.53164 -2.753.6 Finland 3.403.51 5 007 6.969.5 Sweden 3.654.273.7410 459 9.171.9 United Kingdom 1.851.87.31 116 3.546.7 Iceland 2.753.093.01280 14.546.2 China 1.001.23.16 452 :57.6 Japan 2.993.12.131 722 2.273.9 United States 2.702.76.268 552 2.767.3 Source: Eurostat news release Dec. 2005.
17
rankcountries population thousands GDP per capita citations 2004. year's data 1USA284 322,141,336 571,232 2UK59 612,635,68 919,129 3Germany82 636,332,77 242,783 4Japan127 738,136,56 090,783 5France59 978,833,64 997,969 6Canada31 931,731,14 049,185 7Italy58 250,528,83 245,707 8Netherlands16 274,435,52 572,057 9Australia20 014,630,82 189,849 10Switzerland7 316,248,92 096,082 11Spain40 748,424,31 964,621 12Sweden8 971,038,61 894,248 15Belgium10 393,133,81 163,521 16Denmark5 404,244,81015,224 18Russia142 411,24,1986,746 19Finland5 213,035,7862,800 21Austria8 104,936,0765,959 25Poland38 588,96,3574,744 26Norway4 581,754,6532,650 28Greece10 645,719,2339,425 29Hungary10 097,49,9302,779 32Czech Republic10 199,310,5275,988 33Ireland3 972,945,7274,524 37Portugal10 445,316,1239,747

Similar presentations


, 2004 EU-15 and other West European countries Hungary Czech Republic Malta Slovenia Cyprus Portugal Greece Spain.>")


>")


