Download presentation
Presentation is loading. Please wait.

1
ICD and morbidity statistics in Australia 1 July 2011

2
Overview History of ICD for morbidity statistics in Australia Major uses of ICD for morbidity statistics Importance of ICD revisions for morbidity statistics

3
History of ICD and morbidity statistics in Australia Hospitals coded diagnosis data in Australia Australian Institute of Health established 1987 –by the 1980s most S&T using a version of ICD-9-CM –variation between states for coding hospitals data –rising tide of government interest in consolidated set of national hospital data for policy and funding purposes 1993-94 national reporting of morbidity data using ICD-9- CM (various US versions) AIHW published Australian hospital statistics 1993-95: an overview
 AIHW published Australian hospital statistics : an overview")
4
History of ICD and morbidity statistics in Australia National Coding Centre established in 1994 –Major driver Casemix interests but also policy, hospital management and clinical interests –aim to standardise and refine codes and coding practice for these purposes 1995-96 all national reporting using the first Australian edition of ICD-9-CM 1999-00 all S&T reported nationally using ICD-10-AM Currently all S&T reporting using ICD-10-AM 7 th edition

5
Importance of ICD for morbidity statistics The Productivity Commission undertook a study comparing performance of public and private hospitals using coded hospitals data in a number of analyses – Public and Private Hospitals, Productivity Commission Research Report 2009. This report highlighted the importance of the coded hospitals data in the current health environment in Australia.

6
Importance of ICD for morbidity statistics - Policy settings and uses National Healthcare Agreement (2008) –Performance indicators and benchmarks National Partnership Agreements Heads of Agreement - National Health Reform (2011) –work in partnership to improve health outcomes and system sustainability –Performance and accountability framework, with information requirements and performance indicators
 –Performance indicators and benchmarks National Partnership Agreements Heads of Agreement - National Health Reform (2011) –work in partnership to improve health outcomes and system sustainability –Performance and accountability framework, with information requirements and performance indicators")
7
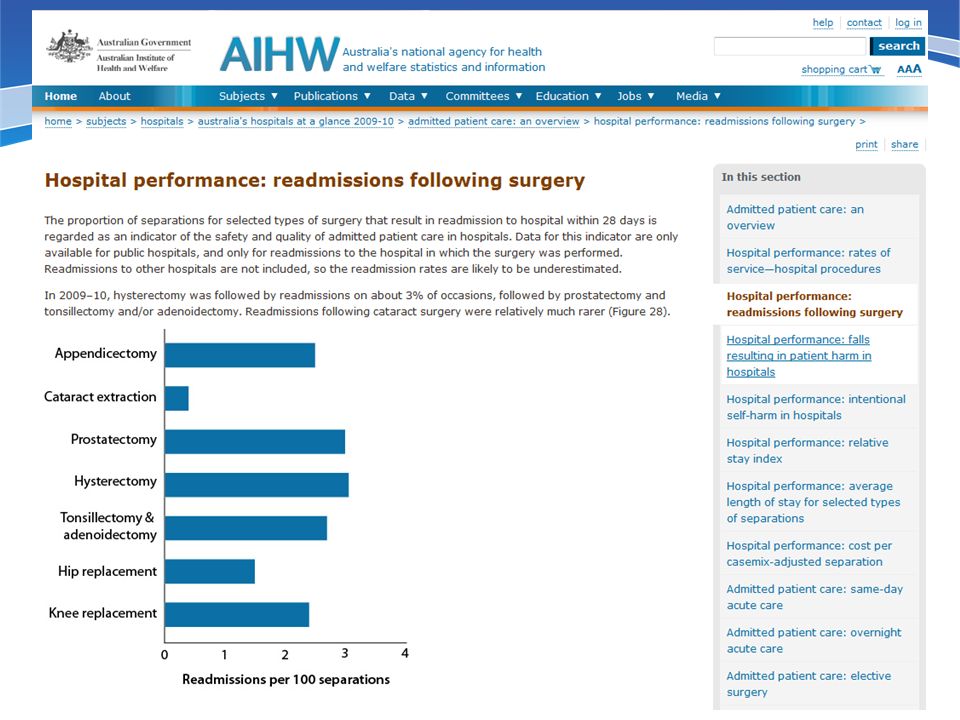
Importance of ICD for morbidity statistics –NHA Performance Indicators (PIs) using coded hospitals data ›Selected potentially preventable hospitalisations ›Falls resulting in harm in hospitals ›Unplanned/unexpected readmissions ›Intentional self-harm in hospitals ›Hospitalisations for injury and poisoning ›Cost per casemix adjusted separation
 using coded hospitals data ›Selected potentially preventable hospitalisations ›Falls resulting in harm in hospitals ›Unplanned/unexpected readmissions ›Intentional self-harm in hospitals ›Hospitalisations for injury and poisoning ›Cost per casemix adjusted separation")
8
Falls resulting in patient harm in hospitals (NHA), 2007-08 Per 1,000 hospitalisations Socio-economic group
, Per 1,000 hospitalisations Socio-economic group")
10
Potentially preventable hospitalisations: a measure of non-hospital care

11
Importance of ICD for morbidity statistics - current major uses nationally AIHW reports –Australia’s Health – international, national, state and territory –Australian Hospital Statistics - state and territory, hospital peer groups, public and private

12
Importance of ICD for morbidity statistics - other national reports Council of Australian Governments Reform Council annual performance reports Report on Government Services, produced by a multi- jurisdictional officials committee

13
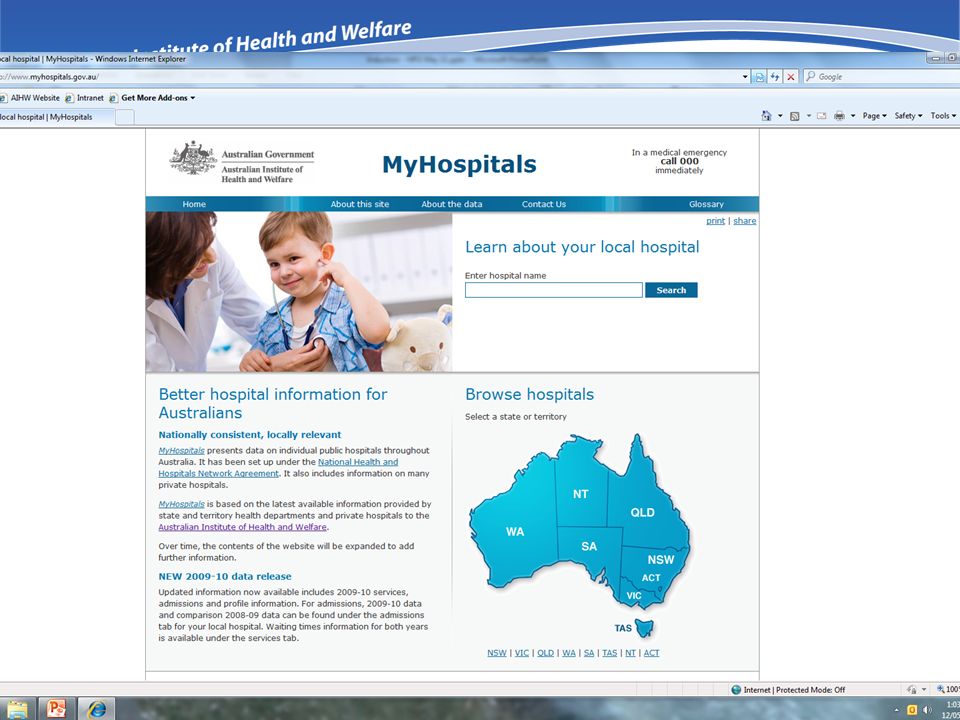
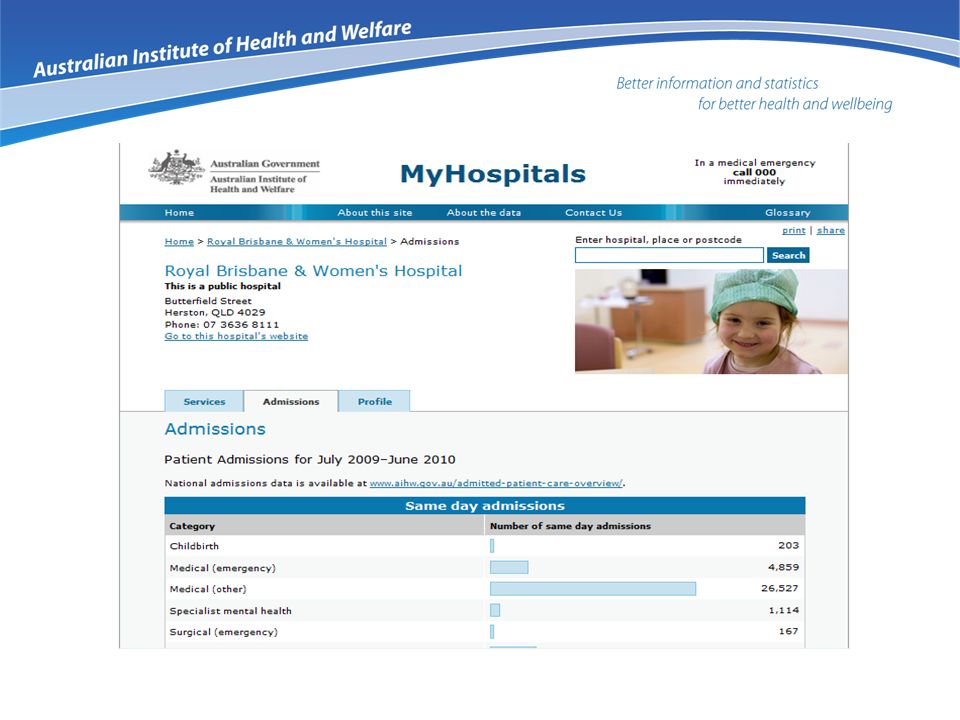
Importance of ICD for morbidity statistics MyHospitals website – information about individual hospitals

16
Importance of ICD for morbidity statistics o ACSQHC Core hospital-based outcome indicators - being designed for use at hospital level to support quality and safety activities Hospital Standardised Mortality Ratio Death in low-mortality Diagnosis Related Groups In-hospital mortality for heart failure, stroke, fractured neck of femur, pneumonia Unplanned re-admissions of patients discharged following management of: acute myocardial infarction heart failure knee and hip replacements depression schizophrenia paediatric tonsillectomy and adenoidectomy

17
ICD revisions and morbidity statistics The 10 th revision - a major revision which allowed collection of more contemporary and relevant statistical information –~8,000 categories compared with ~4,000 categories –introduction of activity codes V01-Y34 to indicate the activity of the injured person at the time the event occurred –Code changes e.g. chronic renal failure paraplegia austosomal deletion syndromes congenital pneumonia

18
ICD revisions and morbidity statistics Congenital pneumonia –ICD-9 770.0 congenital pneumonia –ICD-10 P23-Congenital pneumonia

19
ICD revisions and morbidity statistics Examples Chronic renal failure –ICD-9 585.1 chronic renal impairment and 585.9 chronic renal failure –ICD-10 N18 Chronic kidney disease – N18.1Chronic kidney disease, stage 1 – N18.2Chronic kidney disease, stage 2 – N18.3Chronic kidney disease, stage 3 – N18.4Chronic kidney disease, stage 4 – N18.5Chronic kidney disease, stage 5 – N18.9Chronic kidney disease, unspecified

20
ICD-10 edition changes Examples of new codes U04 Severe acute respiratory syndrome [SARS] J09Influenza due to identified avian influenza virus Examples of planned changes to be implemented Jan 2013 I48 Atrial fibrillation and flutter –I48.0 Paroxysmal atrial fibrillation –I48.1 Persistent atrial fibrillation –I48.2 Chronic atrial fibrillation –I48.3 Typical atrial flutter -Type I atrial flutter –I48.4 Atypical atrial flutter - Type II atrial flutter –I48.9 Atrial fibrillation and atrial flutter, unspecified
![ICD-10 edition changes Examples of new codes U04 Severe acute respiratory syndrome [SARS] J09Influenza due to identified avian influenza virus Examples of planned changes to be implemented Jan 2013 I48 Atrial fibrillation and flutter –I48.0 Paroxysmal atrial fibrillation –I48.1 Persistent atrial fibrillation –I48.2 Chronic atrial fibrillation –I48.3 Typical atrial flutter -Type I atrial flutter –I48.4 Atypical atrial flutter - Type II atrial flutter –I48.9 Atrial fibrillation and atrial flutter, unspecified](http://images.slideplayer.com/34/10231779/slides/slide_20.jpg "ICD-10 edition changes Examples of new codes U04 Severe acute respiratory syndrome [SARS] J09Influenza due to identified avian influenza virus Examples of planned changes to be implemented Jan 2013 I48 Atrial fibrillation and flutter –I48.0 Paroxysmal atrial fibrillation –I48.1 Persistent atrial fibrillation –I48.2 Chronic atrial fibrillation –I48.3 Typical atrial flutter -Type I atrial flutter –I48.4 Atypical atrial flutter - Type II atrial flutter –I48.9 Atrial fibrillation and atrial flutter, unspecified")
21
ICD-10 edition changes - cont W17 Fall from one level to another –Includes: fall from or into: cherry picker hole lifting device mobile elevated work platform [MEWP] pit sky lift
![ICD-10 edition changes - cont W17 Fall from one level to another –Includes: fall from or into: cherry picker hole lifting device mobile elevated work platform [MEWP] pit sky lift](http://images.slideplayer.com/34/10231779/slides/slide_21.jpg "ICD-10 edition changes - cont W17 Fall from one level to another –Includes: fall from or into: cherry picker hole lifting device mobile elevated work platform [MEWP] pit sky lift")
22
In summary Revisions to the classifications are important for morbidity statistics to ensure: –advances in medical science and diagnostic terminology are reflected –public health utility of the classification is maintained or improved

Similar presentations


>")


 versus Service (CPT) ICD codes are diagnosis codes –Describe new and established diagnoses –Also include symptom codes.>")


 Data: A Researcher’s Perspective Judith H. Lichtman, PhD MPH Associate.>")