Download presentation
Presentation is loading. Please wait.

1
Preserving The Upper San Pedro River Basin Presented to: The Upper San Pedro Partnership Executive Committee October 7, 2009

2
Border Environment Cooperation Commission (BECC) North American Development Bank (NADB) “Preserve, protect, and enhance US-MEX border region by identifying, developing, implementing and overseeing environmental infrastructure projects” The NADB finances the construction of projects certified by BECC. A project that will “prevent, control or reduce environmental pollutants or contaminants, improve the drinking water supply, or protect flora and fauna so as to improve human health, promote sustainable development, or contribute to a higher quality of life” 2

3
Board of Directors Representative of the border states (Baja California) Public member who is resident of the border region (Nuevo Leon) Representative of the border states (New Mexico) Public member who is resident of the border region (Texas) A unique and innovating structure among binational organisms, where the civil society is represented within its Board of Directors.
 Public member who is resident of the border region (Nuevo Leon) Representative of the border states (New Mexico) Public member who is resident of the border region (Texas) A unique and innovating structure among binational organisms, where the civil society is represented within its Board of Directors.")
4
Coverage & Sectors 100 km on the U.S. side of border 300 km on the Mexico side Covers 1.2 million km 2 23.8M residents BASIC SECTORS Water Sewage systems Wastewater treatment Water Reuse Storm Water Systems Solid Waste EXPANDED SECTORS Water Conservation Air Quality Public Transportation Clean and Efficient Energy Hazardous Waste Solid Waste Reduction& Recycling Municipal Planning

5
129 161 $3.46 $982.9 CERTIFIED PROJECTS TOTAL INVESTMENT (BD) NADB FINANCED PROJECTS* NADB FINANCING* (MD) 12.6 POPULATION BENEFITED (M) MX 83 US 78 MX 62% US 38% 5 *Only contracted agreements are included, not total approvals.
 NADB FINANCED PROJECTS* NADB FINANCING* (MD) 12.6 POPULATION BENEFITED (M) MX 83 US 78 MX 62% US 38% 5 *Only contracted agreements are included, not total approvals.")
6
California 12 $ 184.02 Arizona 13 $ 146.10 New Mexico 8 $ 58.92 Texas 45 $ 818.15 78 in USA $ 1,207.19 78 in USA $ 1,207.19 83 in Mexico $ 2,256.57 83 in Mexico $ 2,256.57 Sonora, 20 $ 149.35 Chihuahua, 18 $ 261.51 Coahuila 3 $ 156.60 Nuevo Leon, 4 $ 67.53 161 Projects with an investment of $3,463 million dollars Baja California 23 $ 997.78 Tamaulipas, 15 $ 623.80 Certified Projects ( Cost in million dollars)
")
7
California $2,086,065 Arizona $4,140,816 New Mexico $3,653,109 Texas $13,078,300 USA $22,958,290 USA $22,958,290 Mexico $14,198,247 Mexico $14,198,247 Sonora,$3,563,404Chihuahua,$2,881,644Coahuila$1,370,136 Nuevo Leon, $438,009 Total of Technical Assistance: $37.16 million dollares Baja California $2,183,014 Tamaulipas,$3,762,040 Technical Assistance

8
17 Solid Waste Management: 2.9 million residents with improved waste collection and disposal services, resulting in the capacity to properly dispose of 1,550 tons of waste per day 25 Water Conservation: Estimated annual water savings of 330 million gallons per day. As a comparison, this quantity is sufficient to serve the average drinking water demands of 4 million people. 83 Water and Wastewater: Providing improved drinking water treatment/distribution as well as wastewater collection/ treatment for the benefit of more than 12 million border residents, most significantly impacted by new capacity to eliminate 300MGD of untreated or inadequately treated sewage 8 11 Air Quality Projects: 6.7 million residents benefited from reduced exposure to air pollution from vehicular traffic on unpaved streets. Approximately 100,000 tons per year of PM 10 anticipated to be eliminated. 2 Energy : Offset demands of traditional fossil-fuel based energy production, avoiding 630 tons of CO 2 per year. Measuring Results: Social and Environmental Benefits

9
State Number of Projects in BECC’s Pipeline (SEPTEMBER-09) Solid Waste Air Quality Clean Energy Water /Wastewater TOTAL Estimated Cost (MD) Non-BEIFBEIF California001157$73.20 Arizona000033$20.77 New México000033$48.80 Texas40311018$445.78 Total US40422131$588.55 Baja California01201114$69.48 Sonora2300813$70.25 Chihuahua0211711$222.44 Coahuila310116$9.84 Nuevo León230016$18.76 Tamaulipas12721021$5,050.87 Total MX8121043771$5,441.64 Total Projects12 14757 102 Estimated Cost (MD) $25.31$161.41$4,816.65$685.23$341.59 $6,030.19
 Solid Waste Air Quality Clean Energy Water /Wastewater TOTAL Estimated Cost (MD) Non-BEIFBEIF California001157$73.20 Arizona000033$20.77 New México000033$48.80 Texas $ Total US $ Baja California $69.48 Sonora $70.25 Chihuahua $ Coahuila310116$9.84 Nuevo León230016$18.76 Tamaulipas $5, Total MX $5, Total Projects Estimated Cost (MD) $25.31$161.41$4,816.65$685.23$ $6,030.19")
10
September 2009 Solicitation for 2009 applications was held 155 applications received Evaluation to be completed by October 2009

11
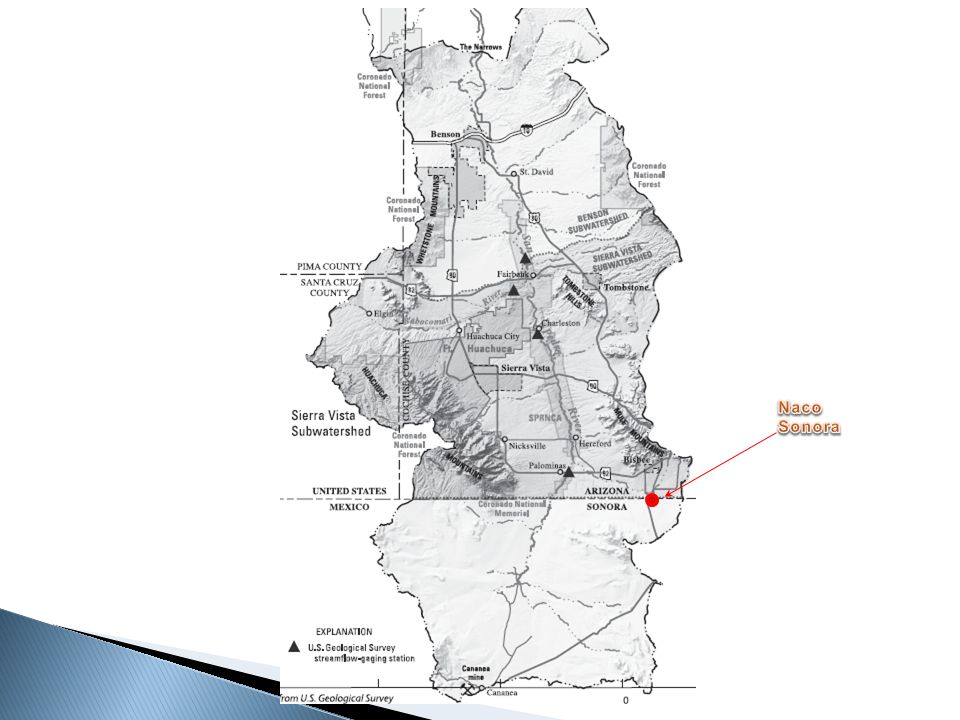
To meet this goal ENRD has partnered with BECC to search for a solution to continue with the Upper San Pedro River Basin groundwater resource protection. The Upper San Pedro River (USPR) Basin is one of the most diverse well-known avian habitats (Arias et al. 1999). >400 avian species in the basin (Krueper 1999), and ~1 to 4 million neotropical migratory birds annually during migration in the riparian corridor (Arias et al. 1999). Fort Huachuca’s Environmental and Natural Resources Division (ENRD) is responsible for the USPR Basin protection and improvement. ENDR understands that changes in the depth of the water table, and river surface flow can greatly impact riparian vegetation and the animal species in the region. ENDR is currently looking forward meeting groundwater pumping marks by 2016. GOAL: Achieve approximately an additional 1,000 acre-feet per year (AFY).
 Basin is one of the most diverse well-known avian habitats (Arias et al. 1999). >400 avian species in the basin (Krueper 1999), and ~1 to 4 million neotropical migratory birds annually during migration in the riparian corridor (Arias et al. 1999). Fort Huachuca’s Environmental and Natural Resources Division (ENRD) is responsible for the USPR Basin protection and improvement. ENDR understands that changes in the depth of the water table, and river surface flow can greatly impact riparian vegetation and the animal species in the region. ENDR is currently looking forward meeting groundwater pumping marks by GOAL: Achieve approximately an additional 1,000 acre-feet per year (AFY)..")
12
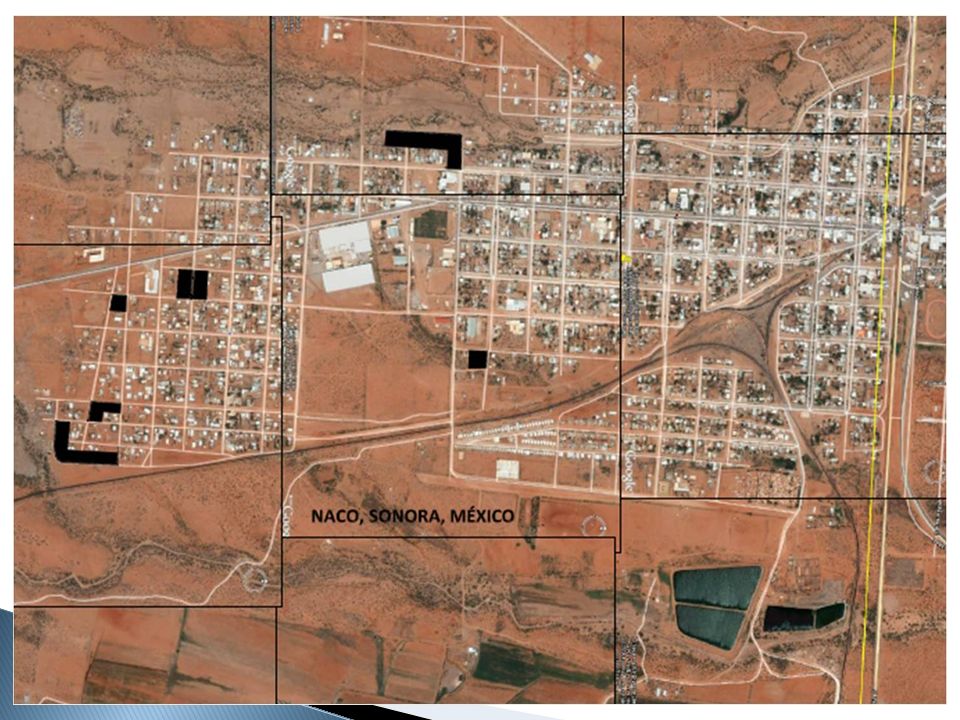
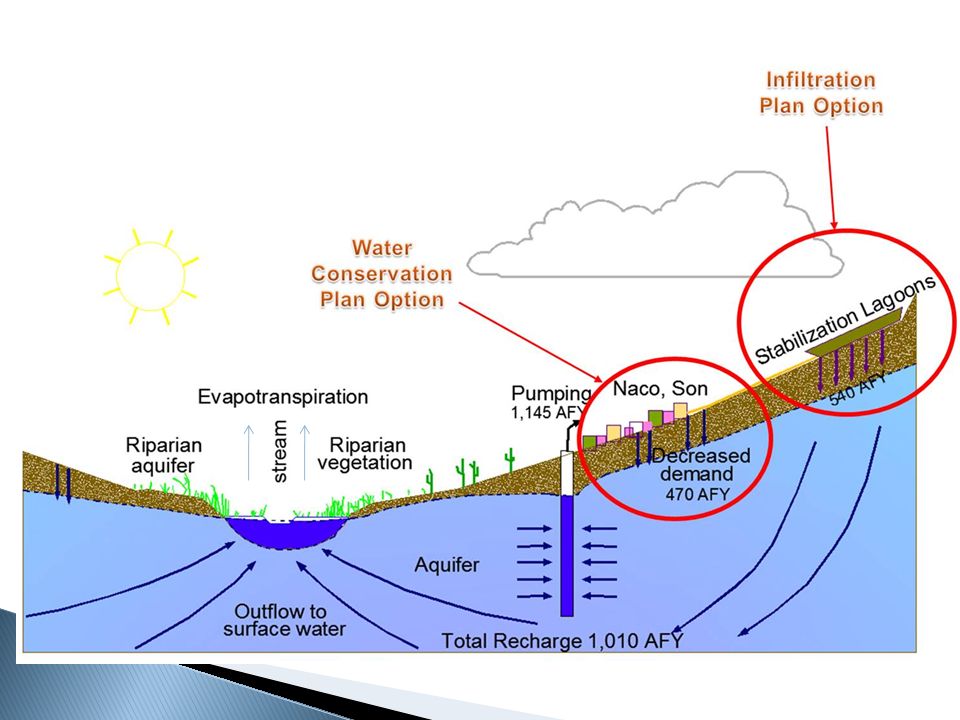
Recharging treated wastewater to store in the USPR aquifer. Decreasing underground pumping from USPR aquifer. Finding a potential alternative for protecting the shared USPR watershed. Focus Community is Naco, Sonora ◦ Reduction of water demands ◦ implementation of water conservation, micrometering ◦ Treated/Reclaimed WW infiltration

13
Direct Impact to the USPR. Water supply source is the USPR watershed. High extraction and consumption rates. Over 57% losses in current water distribution system. Non-existent water conservation programs. Currently looking for a wastewater treatment solution. Represents a win-win project.

17
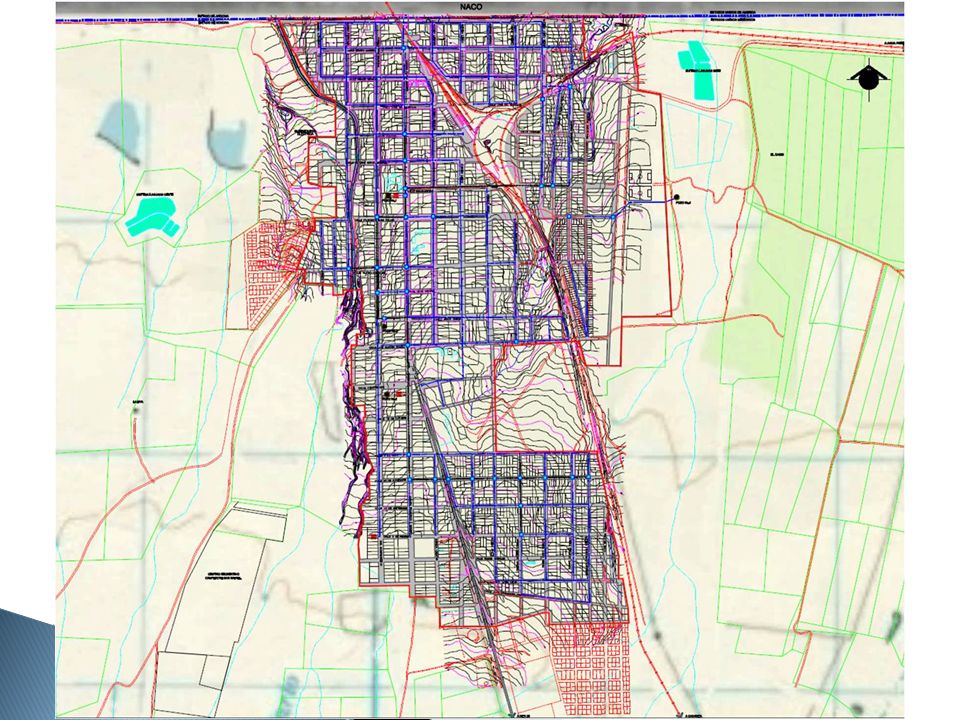
Water Supply: 172.5 gpcpd. Extraction Rate: 1.02 MGDs (1,142 AFY) DW Service Coverage: nearly 100%. Number of Connections: 1,872. Household Connections: 1,810. Water Losses: 57% of water supply. Micrometering Coverage: 50%. Fixed rate for household usage.
 DW Service Coverage: nearly 100%. Number of Connections: 1,872. Household Connections: 1,810. Water Losses: 57% of water supply. Micrometering Coverage: 50%. Fixed rate for household usage..")
18
Wastewater Collection Service Coverage: 92%. WW discharge: 0.80 MGD (894.5 AFY). WWT lagoon Capacity: 1.14 MGD (1,277 AFY). Have selected the best alternative to find a point of discharge. Currently reviewing proposals to develop EA.
. Have selected the best alternative to find a point of discharge. Currently reviewing proposals to develop EA..")
19
Wastewater Treatment Improvement in Naco, Sonora (PDAP Funds) ◦ To provide treated wastewater discharge infrastructure at the east lagoons and thereby prevent untreated wastewater bypasses that result in an average of 4 l/s of raw sewage spilling into Naco, Arizona. ◦ Completed an Alternative Analysis, currently developing the EA for the NEPA process. Drinking Water System Improvements in Naco, Sonora (PDAP Funds) ◦ Construction of a drinking water storage tank (40,000 gal) and drinking water distribution infrastructure rehabilitation, to serve 600 existing connections. ◦ Currently developing Pre-design, to determine type of storage tank required
 ◦ Construction of a drinking water storage tank (40,000 gal) and drinking water distribution infrastructure rehabilitation, to serve 600 existing connections. ◦ Currently developing Pre-design, to determine type of storage tank required.")
20
Water metering incremental from 50 to 100 percent. Base rate fee on actual usage. Water loss detection and repair strategy plan. Installation of water conservation mechanisms in each household: in toilets, showers, and faucets. Treated Wastewater Infiltration lagoon

22
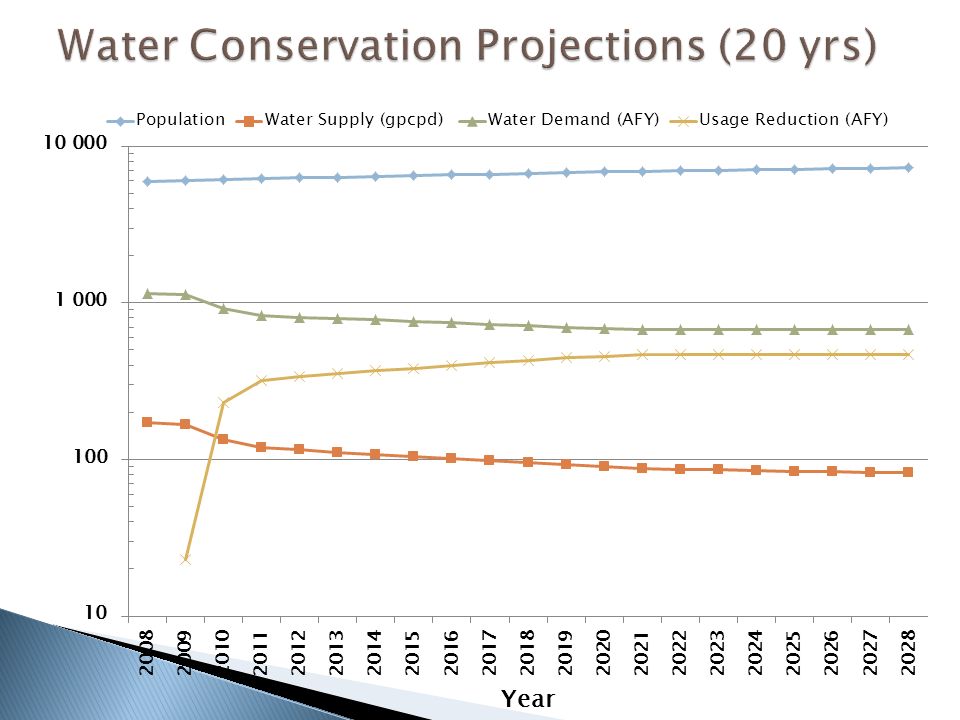
20082028Percent Change Population5,9267,28123% Water Supply (gpcpd) 1738352% Water Demand (AFY) 1,14567541% Usage Reduction (AFY) 0470470%
 % Water Demand (AFY) 1, % Usage Reduction (AFY) %")
23
Proposed dam location as discharge point Existing force main Objective: To pump treated wastewater flow from the effluent in lagoons to dam and re- use for irrigation activities. Distance from international U.S.- Mexico Border to dam: 2 mi Dam Capacity: 8 MG Additional pipeline length required, approximately 350 ft

24
Available land for the infiltration lagoon: 5 acres Storage Capacity: 20 days

25
Existing Dam Existing pipeline Non- existent Segment Stabilization Lagoons

27
ConceptCost (US Dollars) NEPA Process50,000 Pre Design50,000 907 meter installation (reaching 100 percent water metering) 155,042 Water loss detection and repair312,184 Household Water Conservation Device Installation 57,778 Infiltration Lagoon Option (Final Design and Construction) 852,800 Total1,477,804
 NEPA Process50,000 Pre Design50, meter installation (reaching 100 percent water metering) 155,042 Water loss detection and repair312,184 Household Water Conservation Device Installation 57,778 Infiltration Lagoon Option (Final Design and Construction) 852,800 Total1,477,804")
28
Infiltration Lagoon Option: ◦ Hydraulic Study and planning ◦ Environmental Clearances – EA under development ◦ Final Design ◦ Construction Water Conservation: ◦ Pre Design, planning ◦ Environmental Clearances – EA and MIA ◦ Final Design ◦ Construction

29
Investigate Policy Issues/requirements with State of Sonora Water Commission(CEA) and National Water Commission of Mexico (CONAGUA). Involving ADWR and ADEQ. Initiate meetings with International Boundary and Water Commission (IBWC).
..")
30
Questions or comments

Similar presentations


 Public Meetings June 10-11 & 13, 2013.>")


