Download presentation
Presentation is loading. Please wait.

1
Presented by Gerald A. Bange Chairperson, World Agricultural Outlook Board United State Department of Agriculture http://www.usda.gov/oce/speeches/index.htm Commodity Situation and Outlook Terrapinn Agriculture Investment Summit The Marine’s Memorial Club, San Francisco, CA October 24 – 25, 2012

2
USDA’S Monthly WASDE Report 2

3
Progression of Drought 3 July 17, 2012 May 29, 2012 June 26, 2012 August 7, 2012

4
Wheat Situation & Outlook 2012/13 4 U.S. wheat supply and demand outlook Rebound in acreage Record yields Larger supplies and higher usage Prices rise with corn Global wheat supply and demand outlook World production down Weather reduced crops in EU-27 and FSU-12 2008/09 and 2009/10 production supports stocks World stocks well above levels in 2007/08

5
U.S. Wheat Supply and Demand 5

6
6

7
7

8
World Wheat Production 8

9
9 World Wheat Production & Consumption

10
World Wheat Ending Stocks 10

11
Corn Situation & Outlook 2012/13 11 U.S. corn supply and demand outlook Early planting and large acreage Devastating June and July drought and heat Sharply lower yields and production Tight supplies, record prices, and reduced usage Global corn supply and demand outlook Rising foreign corn consumption Rising foreign production World production falling below consumption

12
U.S. Corn Planted Area 12

13
U.S. Corn Production 13

14
U.S. Drought Monitor 14

15
Days Greater Than 100 degrees F, Jun. 1 – Aug. 4, 2012 15

16
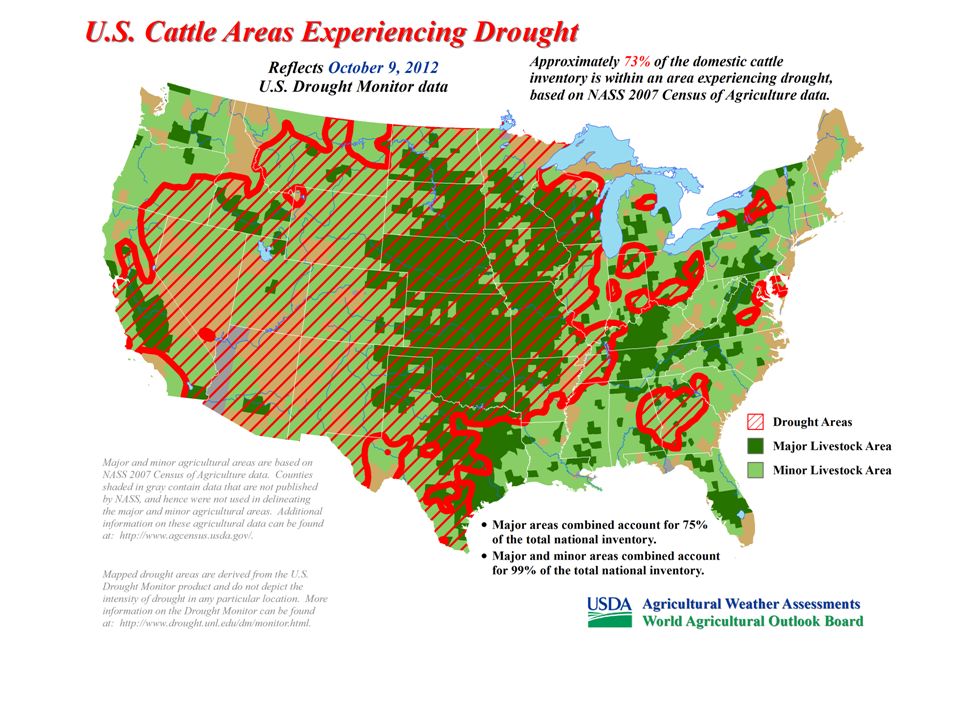
United States Corn Areas in Drought

17
U.S. Corn Supply and Demand 17

18
U.S. Corn Feed & Residual Disappearance 18

19
U.S. Corn Exports 19

20
U.S. Corn Ending Stocks and Stocks-to-Use 20

21
U.S. Farm Prices for Corn 21

22
U.S. Farm Prices for Wheat 22

23
Renewable Fuel Standard 23 Source: Energy Independence and Security Act of 2007.

24
U.S. Corn Use for Ethanol Production 24

25
Ethanol and Gasoline Prices 25 Note: Ethanol prices based on CBOT nearby futures. RBOB (Reformulated Gasoline Blend Stock) based on NYME nearby futures. Reformulate Gasoline Blend Stock (RBOB) Ethanol $.48 10/15/12
 based on NYME nearby futures. Reformulate Gasoline Blend Stock (RBOB) Ethanol $.48 10/15/12.")
26
World Grain Area Used for U.S. Ethanol, 2012/13P 26 Note: Share of world coarse grain, wheat, and rice harvested area used for U.S. ethanol..

27
World Corn Production 27

28
Rest-of-world Corn Production 28

29
U.S. Corn Yields vs. Rest-of-World Yields 29

30
World Corn Consumption 30

31
31 World Corn Production & Consumption

32
World Corn and Wheat Stocks Relative to Use 32

33
Soybean Situation & Outlook 2012/13 33 U.S. soybean supply and demand outlook Early planting and large acreage June and July drought and heat Lower yields and production Tight supplies, record prices, and reduced usage Global supply and demand outlook Strong import demand led by China Limited South American supplies until Spring 2013 Record South American area planted fall 2012 World ending stocks rebuild slowly in 2013

34
U.S. Soybean Supply and Demand 34

35
World Soybean Production 35

36
Global Soybean Imports Billion Bushels 2.2 1.2 1.5 0.8 36

37
Soybean Prices 2000 - 2012 Dollars per bushel 37

38
Soybean Meal Prices 2000 - 2012 Dollars per ton 38

39
Feed Cost Outlook Higher feed prices for most of year –Corn: $7.10-$8.50/bu in 2012/13 $6.22 in 2011/12 $5.18 in 2010/2011 –Soybean meal: $470-$500 ton in 2012/13 $394 in 2011/12 $345 in 2010/2011 Feed prices should moderate moving into 2013/14 crop year 39

40
201120122013 2012-13* % Change Cattle, $/cwt 114.73121.72122-1324.5 Hogs, $/cwt (live equiv.) 66.1160.9862-675.4 12-City Broilers, ¢/lb 798485-914.5 Turkey, $/lb 1.021071.02-1.10-0.7 Livestock & Poultry Price Outlook* * Midpoint of October 11 WASDE 40
 City Broilers, ¢/lb Turkey, $/lb Livestock & Poultry Price Outlook* * Midpoint of October 11 WASDE 40")
42
Total Meat Production Lower* Billion pounds 201120122013 2012-13 % Change Beef 26.19525.59324.630-3.8 Pork 22.75823.29723.000-1.3 Broiler Meat 37.20136.71736.415-0.8 Turkey 5.7915.9765.790-3.1 Total Red Meat And Poultry 92.74592.38790.628-1.9 *October 11 WASDE 42

43
U.S. Milk Supply and Demand 43

44
44 USDA Data Links World Agricultural Supply and Demand Estimates: www.usda.gov/oce/commodity/wasde/index.htm Weekly Weather and Crop Bulletin www.usda.gov/oce/weather/pubs/Weekly/Wwcb/index.htm Economic Research Service: www.ers.usda.gov/ Foreign Agricultural Service: www.fas.usda.gov/ National Agricultural Statistics Service: www.nass.usda.gov

45
END 45

Similar presentations


 National Turkey Federation Westin Hotel, Washington, DC October 24, 2011>")


 257-2996>")


