Download presentation
Presentation is loading. Please wait.

1
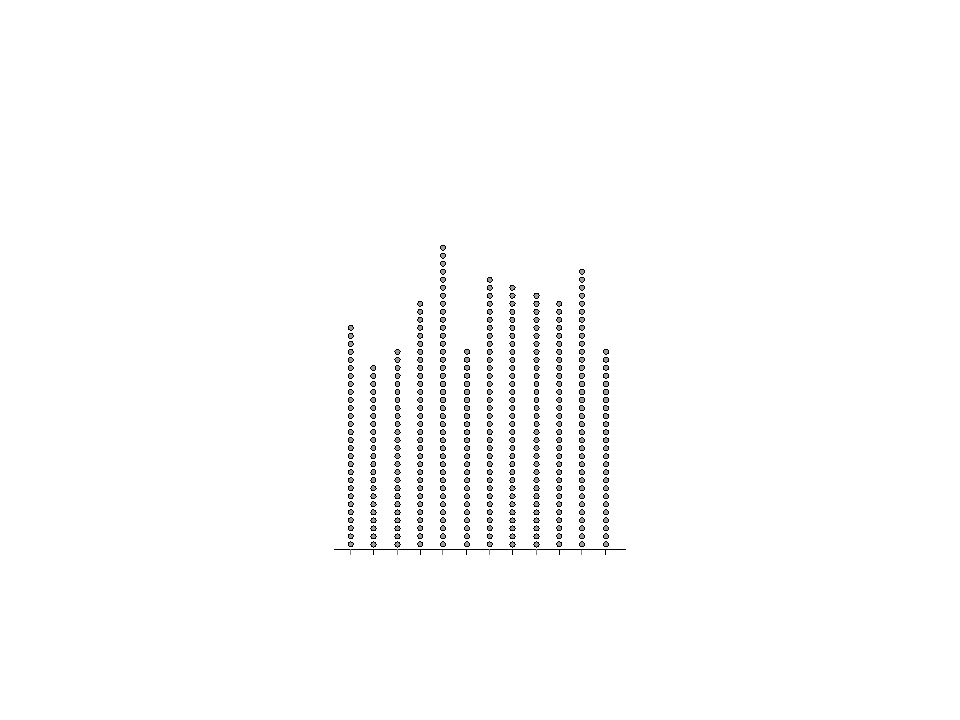
Sketching shapes

20
Reflection: Seeing shape What did you look for when catching a glimpse of the plot? Are your plots similar to your neighbours? 20

21
Describing shape Choose one plot and with your neighbour discuss how your Year 10 students would describe the shape – What sort of language would they use? 21

22
Normal (Bell-curved) Symmetric Uniform Unimodal Bimodal Trimodal Skew Right, Positively Skewed, Long Upper Tail Skew Left, Negatively Skewed, Long Lower Tail Outliers, Extreme Values 22 Giving students statistical language for shapes
 Symmetric Uniform Unimodal Bimodal Trimodal Skew Right, Positively Skewed, Long Upper Tail Skew Left, Negatively Skewed, Long Lower Tail Outliers, Extreme Values 22 Giving students statistical language for shapes")
23
ModesSkew Other shapes Describe these distributions.... 23

24
24

25
Connecting shape and context In pairs, match each context with its graph – contexts given at bottom of page unfold Feedback from teachers – why did you pick and rationalise (2-3) 25
 25")
26
Contexts - variables graphed 1.Number of skips in 30 seconds 2.Birth month 3.Reaction time (secs) 4.Kiwi weight (kg) 5.Attendance (half days) 6.Foot length (cm) 7.Hours worked weekly 8.Household debt 9.Hair length (cm) 26
 4.Kiwi weight (kg) 5.Attendance (half days) 6.Foot length (cm) 7.Hours worked weekly 8.Household debt 9.Hair length (cm) 26")
27
In 3's or 4's discuss, then sketch what you would expect. Justify your graphs. Times to get to school (C@S)? Neck Circumferences from (C@S)? Incomes of Auckland households? Auckland house prices? Heights of people on a Year 2 class trip to the beach? Reaction times (C@S)? Car prices on Trademe? Heights of Kiwis (Kiwi Data) Year of Manufacture of currently registered vehicles in NZ? Ages of everyone at our school today? 27 What shape would you expect for:
 Year of Manufacture of currently registered vehicles in NZ. Ages of everyone at our school today. 27 What shape would you expect for:.")
28
Connecting context and shape In pairs, discuss the shape of the distribution for each variable Sketch your predicted distribution – Give some idea of x-values Justify the sketch of your predicted distribution Students can present their sketch and justification to the rest of the class Show and discuss with the class the actual distributions from some collected data 28

29
Engaging with shape One of the keys for unlocking the story behind the data – Develops the skill of what to look at and what to look for Using their imagination, they start to notice what is interesting, unusual or unexpected. What are the data trying to tell us? 29

Similar presentations


.>")


>")


 TO PREDICT (Statistical Inference)>")
