Download presentation
Presentation is loading. Please wait.

2
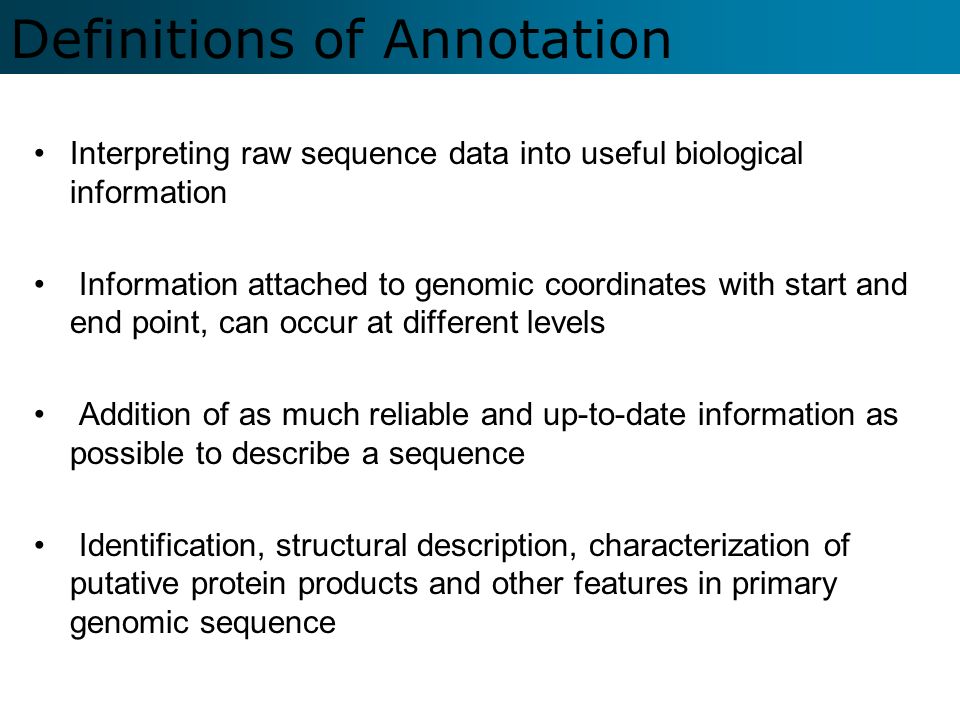
Definitions of Annotation Interpreting raw sequence data into useful biological information Information attached to genomic coordinates with start and end point, can occur at different levels Addition of as much reliable and up-to-date information as possible to describe a sequence Identification, structural description, characterization of putative protein products and other features in primary genomic sequence

3
Genome annotation Two main levels: 1.Structural annotation = Nucleotide-Protein level annotation – Finding genes and other biologically relevant sites thus building up a model of genome as objects with specific locations 2.Functional annotation – Objects are used in database searches (and experiments) aim is attributing biologically relevant information to whole sequence and individual objects Large-scale genome analysis projects Rate-limiting step is annotation
 aim is attributing biologically relevant information to whole sequence and individual objects Large-scale genome analysis projects Rate-limiting step is annotation")
4
Structural annotation: Gene prediction This step consist in identifying the coding genes in the DNA sequence. Properties of coding genes that can be used for to detect them on a genomic sequence are numerous.

5
Gene Prediction Programs Factors based Compositional bias found in protein-coding regions Similarity with known sequences But not accurate enough, without cDNA sequence data Prediction = highly hypothetical

7
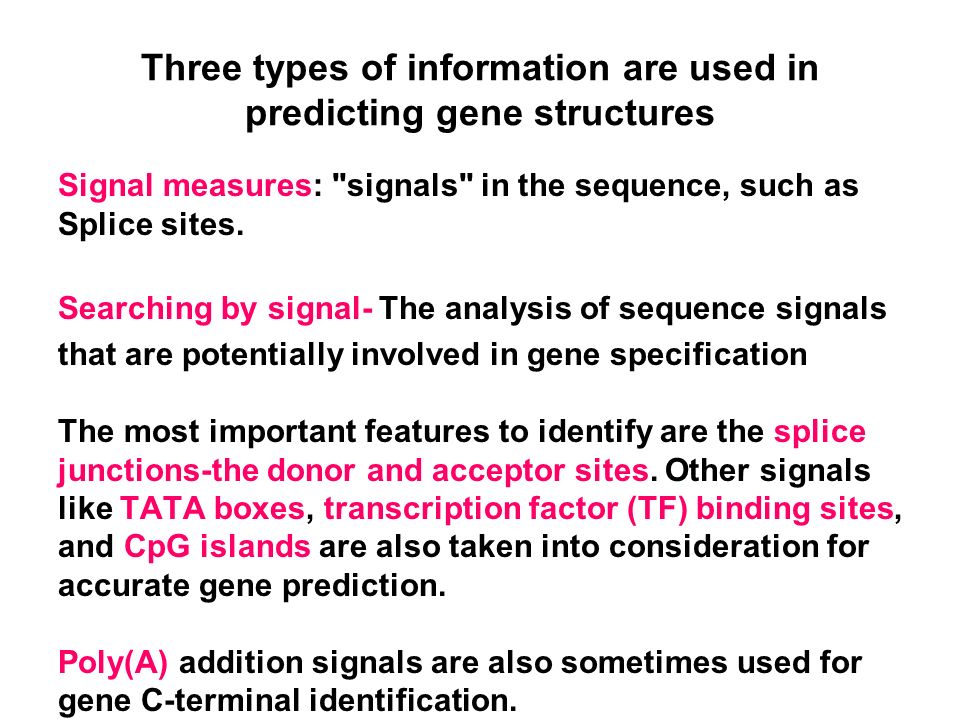
Three types of information are used in predicting gene structures Signal measures: "signals" in the sequence, such as Splice sites. Searching by signal- The analysis of sequence signals that are potentially involved in gene specification The most important features to identify are the splice junctions-the donor and acceptor sites. Other signals like TATA boxes, transcription factor (TF) binding sites, and CpG islands are also taken into consideration for accurate gene prediction. Poly(A) addition signals are also sometimes used for gene C-terminal identification.
 binding sites, and CpG islands are also taken into consideration for accurate gene prediction. Poly(A) addition signals are also sometimes used for gene C-terminal identification..")
8
b) Content measures: "content" statistics, such as codon bias. -"Content" statistics help to distinguish coding from noncoding regions. -Searching by content-The analysis of regions showing compositional bias that has been correlated with coding regions c) Similarity measures: similarity to known genes. -A region of genomic DNA that is significantly similar to a known sequence will usually have the same, or very similar, function. - Methods based on the comparison of the genomic sequence with known coding sequences BLASTx (Gish & States 1993) - ORFs in prokaryotic genomes: useful
 Similarity measures: similarity to known genes. -A region of genomic DNA that is significantly similar to a known sequence will usually have the same, or very similar, function. - Methods based on the comparison of the genomic sequence with known coding sequences BLASTx (Gish & States 1993) - ORFs in prokaryotic genomes: useful.")
9
d) Homolog-based gene prediction Comparing sequences of interest against known coding sequences e) Comparative gene prediction Comparing sequences of interest anonymous genomic sequences Example Extrinsic or look-up gene prediction Gene structure is predicted through comparison with other sequences whose characteristics are already known
 Homolog-based gene prediction Comparing sequences of interest against known coding sequences e) Comparative gene prediction Comparing sequences of interest anonymous genomic sequences Example Extrinsic or look-up gene prediction Gene structure is predicted through comparison with other sequences whose characteristics are already known")
10
Prokaryotic genes By single open reading frames (ORFs) Usually found adjacent to one another Eukaryotic genes Coding sequences (the exons) are interrupted by large, noncoding introns
 Usually found adjacent to one another Eukaryotic genes Coding sequences (the exons) are interrupted by large, noncoding introns")
11
Algorithms for gene prediction Most of the gene prediction programs use statistics based measures for identifying protein-coding regions. However these programs generate enormous models of gene structure for even a short DNA sequence. This problem has been resolved through the use of Dynamic Programming to generate the highest possible gene model without examining all possible ones. HMM (Hidden Markov Model) based are becoming more popular lately due to many reasons. The models have an intuitive analogy to the things that are being modelled-in this case, gene structures. They have A consistent mathematical formalism that allows for rigorous analysis.
 based are becoming more popular lately due to many reasons. The models have an intuitive analogy to the things that are being modelled-in this case, gene structures. They have A consistent mathematical formalism that allows for rigorous analysis..")
12
Basic steps followed in gene prediction methods

13
Gene Prediction in Eukaryotes 1.Identifying and scoring suitable Splice sites, start & stop signals along the query sequence 2. Predicting candidate exons As deduced through the detection of these signals 3. Scoring these exons as a function of both The signals used to detect the exons, as well as on Coding statistics computed on the putative exon sequence itself. In homology-based & comparative methods-Exon scores factor in the quality of the alignment between the query sequence and either known coding sequences or anonymous genomic sequences 4. Assembling a subset of these candidates into a predicted gene structure- To maximize a particular scoring function Dependent on the score of each of the individual exon candidates that comprise the overall predicted gene structure

14
Prediction of Genes Through 1. Coding Statistics 2. Statistics-based (ab initio) Methods 3. Homology-based Methods 4. Combination Tools 5. Comparative Approaches
 Methods 3. Homology-based Methods 4. Combination Tools 5. Comparative Approaches.")
15
Coding statistics Coding regions of the sequence have different properties than non-coding regions: non random properties of coding regions. – GC content – Codon bias (CODON FREQUENCY). – Third base composition (every third base in a coding region tends to be the same one much more often than by chance alone) (TESTCODE).
. – Third base composition (every third base in a coding region tends to be the same one much more often than by chance alone) (TESTCODE)..")
16
Hidden Marko Model: Neural Networks: Decision Tree: Integration of Various Statistical Approaches: GenScan, Genie, Genemark, Veil, HMMgene, GeneID Grail II, GrailEXP_Perceval FGENESH MZEF, MZEF-SPC Statistics-based (ab initio) Methods Ab initio (from the beginning) approach predict genes directly using the computational properties of exons, introns, and other features in the genomic sequences without the reference of the experimental data.
 Methods Ab initio (from the beginning) approach predict genes directly using the computational properties of exons, introns, and other features in the genomic sequences without the reference of the experimental data.")
17
Ab initio Gene Prediction Good at predicting coding nucleotides (> 90%) Moderately good at finding exon boundaries (70-75% correct per exon (< initial & final exons)) Poor at predicting complete gene structures <50% predicted genes correspond to actual genes Difficulty is location of intron-exon boundaries Easier for simpler organisms (prokaryotes) Improve accuracy by combining methods Different methods often predict different elements of an actual gene Could complement each other yielding better prediction
 Moderately good at finding exon boundaries (70-75% correct per exon (< initial & final exons)) Poor at predicting complete gene structures <50% predicted genes correspond to actual genes Difficulty is location of intron-exon boundaries Easier for simpler organisms (prokaryotes) Improve accuracy by combining methods Different methods often predict different elements of an actual gene Could complement each other yielding better prediction")
18
GenScan (J. Mol. Biol., 268, 78-94, 1997) exons, introns, promoter and poly- adenylation vertebrate, nematode (experimental), maize and Arabidopsis GENSCAN is a program designed to predict complete gene structures, including exons, introns, promoter and poly- adenylation signals, in genomic sequences. It differs from the majority of existing gene finding algorithms in that it allows for partial genes as well as complete genes and for the occurrence of multiple genes in a single sequence, on either or both DNA strands. Program versions suitable for vertebrate, nematode (experimental), maize and Arabidopsis sequences are currently available. The vertebrate version also works fairly well for Drosophila sequences. (http://genes.mit.edu/GENSCAN.html) (http://bioweb.pasteur.fr/seqanal/interfaces/genscan.html)
 exons, introns, promoter and poly- adenylation vertebrate, nematode (experimental), maize and Arabidopsis GENSCAN is a program designed to predict complete gene structures, including exons, introns, promoter and poly- adenylation signals, in genomic sequences. It differs from the majority of existing gene finding algorithms in that it allows for partial genes as well as complete genes and for the occurrence of multiple genes in a single sequence, on either or both DNA strands. Program versions suitable for vertebrate, nematode (experimental), maize and Arabidopsis sequences are currently available. The vertebrate version also works fairly well for Drosophila sequences. ( (")
19
GenScan (J. Mol. Biol., 268, 78-94, 1997) GenScan is substantially more general in the earlier tools (e.g., Genemark) Single as well as multi-exon genes Promoters, polyadenylation signals, and intergenic sequences Genes occurring on either or both strands
 GenScan is substantially more general in the earlier tools (e.g., Genemark) Single as well as multi-exon genes Promoters, polyadenylation signals, and intergenic sequences Genes occurring on either or both strands.")
20
GenScan (J. Mol. Biol., 268, 78-94, 1997) Limitations of GenScan Greatly high level of overprediction (~50%) Without the capacity of alternative splicing detection Organism: Human/vertebrates (more accurate) Internal exons are predicted more accurately than initial or terminal exons, exons are predicted more accurately than polyadenylation or promoter signals.
 Limitations of GenScan Greatly high level of overprediction (~50%) Without the capacity of alternative splicing detection Organism: Human/vertebrates (more accurate) Internal exons are predicted more accurately than initial or terminal exons, exons are predicted more accurately than polyadenylation or promoter signals..")
21
GRAIL Gene finder for human, mouse, arabidopsis, drosophila, E. coli Based on neural networks Masks human and mouse repetetive elements Incorporates pattern-based searches for several types of promoters and simple repeats Accuracy in 75-95% range

23
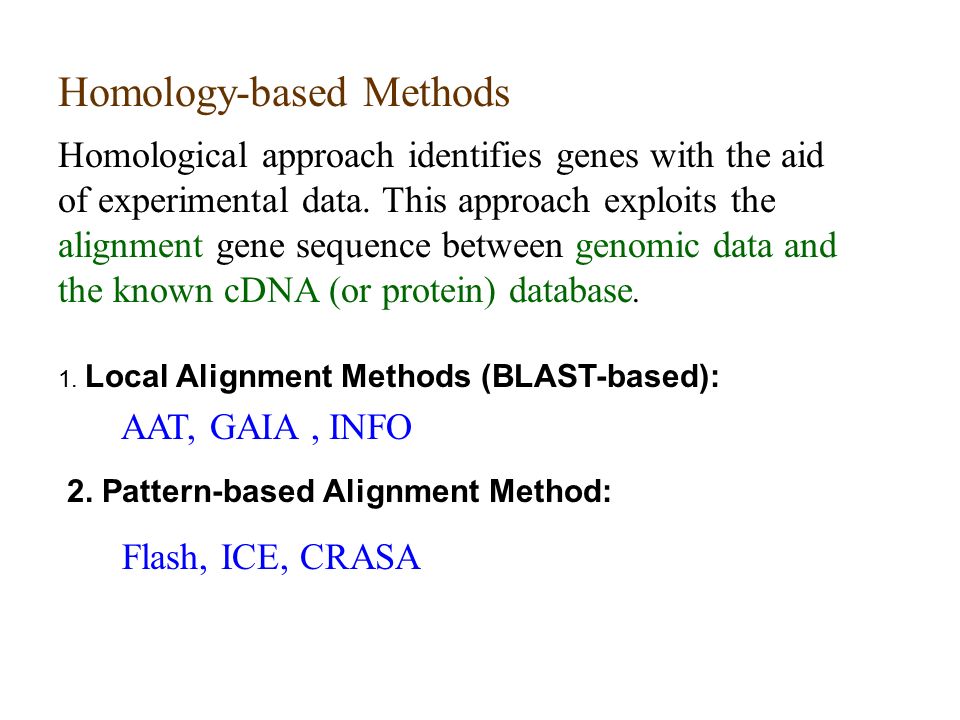
Homology-based Methods Homological approach identifies genes with the aid of experimental data. This approach exploits the alignment gene sequence between genomic data and the known cDNA (or protein) database. 1. Local Alignment Methods (BLAST-based): 2. Pattern-based Alignment Method: AAT, GAIA, INFO Flash, ICE, CRASA
 database. 1. Local Alignment Methods (BLAST-based): 2. Pattern-based Alignment Method: AAT, GAIA, INFO Flash, ICE, CRASA.")
24
Time Consuming (CPU time) Storage Noise Removing Exon Boundaries Difficulties of Homology-based Methods
 Storage Noise Removing Exon Boundaries Difficulties of Homology-based Methods")
25
Combination Tools These tools combine both sequence similarity and ab initio gene finding approaches. They predict genes by producing a splicing alignment between a genomic sequence and a candidate amino acid sequence. 1. Procrustes 2. GeneWise 3. GenomeScan 4. FGENESH+ & FGENESH++ 5. GrailEXP_Gawain and _GALAHAD

26
1. Procrustes 2. GeneWise 3. GenomeScan 4. FGENESH+ & FGENESH++ 5. AAT (+GSA2) Genomic Seq. Protein or cDNA DB Blast alignment Predicted genes Target protein ab initio prediction Combination Tools
 Genomic Seq. Protein or cDNA DB Blast alignment Predicted genes Target protein ab initio prediction Combination Tools.")
27
All difficulties of homology-based methods Time Consuming (CPU time) Storage Noise Removing Exon Boundaries Difficulties of Combination Tools Drawback: Not every BLAST hit presents true homology (maybe BLAST false positive or pseudogene) A set of thresholds
 Storage Noise Removing Exon Boundaries Difficulties of Combination Tools Drawback: Not every BLAST hit presents true homology (maybe BLAST false positive or pseudogene) A set of thresholds")
28
Comparative Approaches These tools predict that the conserved genomic sequences from other vertebrates are likely to be genes. Gene features (e.g., splice sites) that are conserved in both species can be given special credence, and partial gene models (e.g., pairs of adjacent exons) that fail to have counterparts in both species can be filtered out. TWINSCAN (BlastN + GENSCAN) SLAM DOUBLESCAN SGP-1 and –2 (GENEID + TBlastX) ROSETTA program CEM program Ka/Ks ratio test (MegaBlast + nonsynonymous vs. synonymous) PSEP
 that are conserved in both species can be given special credence, and partial gene models (e.g., pairs of adjacent exons) that fail to have counterparts in both species can be filtered out. TWINSCAN (BlastN + GENSCAN) SLAM DOUBLESCAN SGP-1 and –2 (GENEID + TBlastX) ROSETTA program CEM program Ka/Ks ratio test (MegaBlast + nonsynonymous vs. synonymous) PSEP.")
29
Comparative Methods Big Challenge of these methods: codingnon-coding The conserved sequences include coding and non-coding regions.

30
What is an HMM? An HMM describes the probability of transition between the hidden states of a model. The probability that one base pair is in one particular state depends on the state of the previous base pair. The transition probabilty to another state depends on the appearance of a transition signal (splice site) and/or the average number of bp in a certain hidden state (size of Exon/Introns). Hidden Markov Models (HMM) for gene prediction
 and/or the average number of bp in a certain hidden state (size of Exon/Introns). Hidden Markov Models (HMM) for gene prediction.")
31
Neural Networks for gene prediction (1) What are Neural Networks? – Neural Network is a computer program that given a training set of data that preserve certain pattern learn to recognize given pattern. – The name derives from the fact that originally they ware intended to imitate human brain. – Like a brain cells, neural networks consists of central decision making unit connected to other units with the same topology.

32
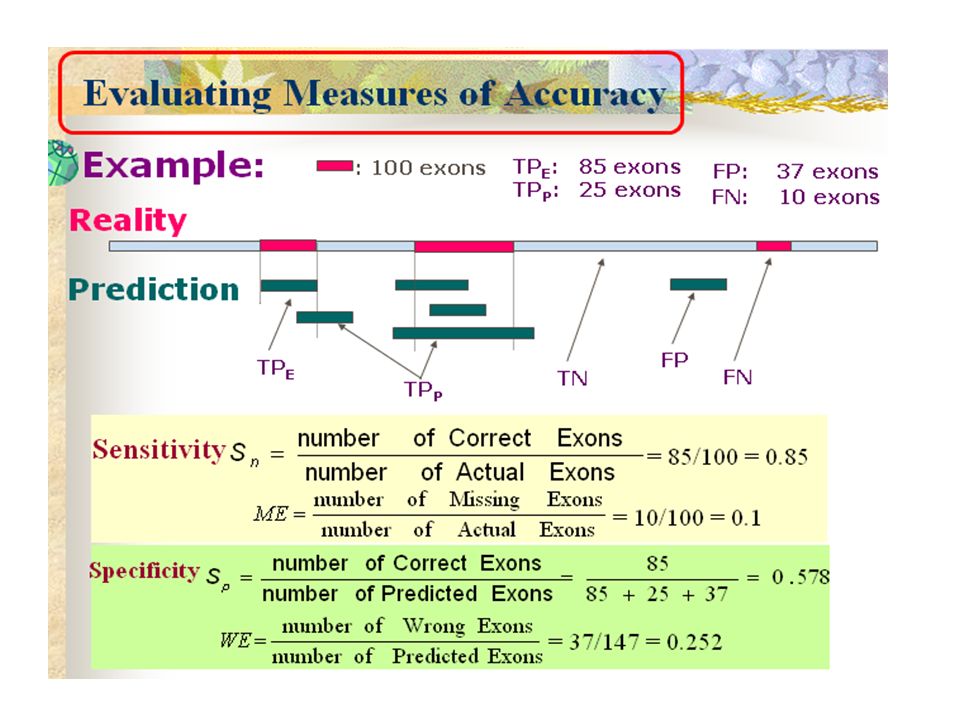
Assessing performance: Sensitivity and Specificity Testing of predictions is performed on sequences where the gene structure is known Sensitivity is the fraction of known genes (or bases or exons) correctly predicted. Specificity is the fraction of predicted genes (or bases or exons) that correspond to true genes.
 that correspond to true genes..")
36
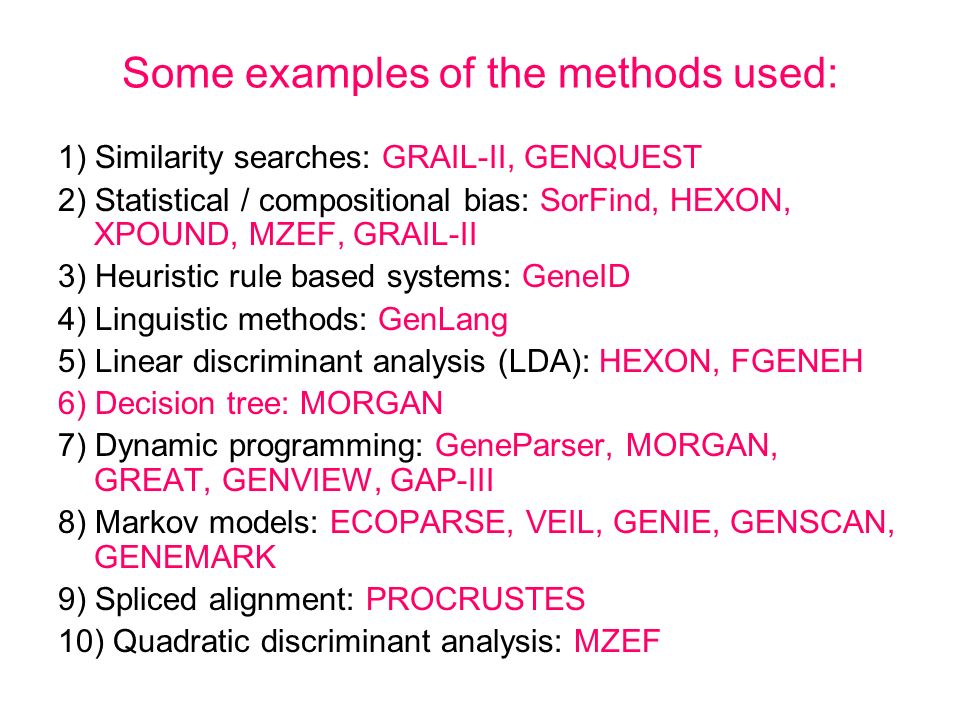
Some examples of the methods used: 1) Similarity searches: GRAIL-II, GENQUEST 2) Statistical / compositional bias: SorFind, HEXON, XPOUND, MZEF, GRAIL-II 3) Heuristic rule based systems: GeneID 4) Linguistic methods: GenLang 5) Linear discriminant analysis (LDA): HEXON, FGENEH 6) Decision tree: MORGAN 7) Dynamic programming: GeneParser, MORGAN, GREAT, GENVIEW, GAP-III 8) Markov models: ECOPARSE, VEIL, GENIE, GENSCAN, GENEMARK 9) Spliced alignment: PROCRUSTES 10) Quadratic discriminant analysis: MZEF
 Similarity searches: GRAIL-II, GENQUEST 2) Statistical / compositional bias: SorFind, HEXON, XPOUND, MZEF, GRAIL-II 3) Heuristic rule based systems: GeneID 4) Linguistic methods: GenLang 5) Linear discriminant analysis (LDA): HEXON, FGENEH 6) Decision tree: MORGAN 7) Dynamic programming: GeneParser, MORGAN, GREAT, GENVIEW, GAP-III 8) Markov models: ECOPARSE, VEIL, GENIE, GENSCAN, GENEMARK 9) Spliced alignment: PROCRUSTES 10) Quadratic discriminant analysis: MZEF")
37
FGENESH FGENES=“Find genes” Linear discriminant analysis Splice sites, exons, promoter elements 1st version: Solovyev et al. 1995 Linear discriminant analysis to identify splice sites, exons, And promoter elements Filtered exons are assembled using a dynamic programming Algorithm that searches paths of compatible exons, with the goal of maximizing the final gene score FGENESH ● HMM-based version ● FGENESH + FGENESH-C incorporate protein and cDNA homology ● Perfrom better than ab initio than FGENESH

38
Procruste PROCRUSTES is based on the spliced alignment algorithm which explores all possible exon assemblies and finds the multi-exon structure with the best fit to a related protein PROCRUSTES successfully recognizes genes with short exons as well as complicated genes with more than 20 exons. Test results demonstrate that the spliced alignment algorithm provides 99% accurate recognition of a mammalian gene if a related gene from another mammalian species is known

Similar presentations


 Start codon Stop codon TATA box ATGACAGATTACAGATTACAGATTACAGGATAG.>")
 Gene Prediction and Regulation.>")
 Larry Hunter, Tom Madej, William Stafford Noble,>")


