Download presentation
Presentation is loading. Please wait.

1
STATS IN THE REAL WORLD Statistics, Representation, and Interpretation

2
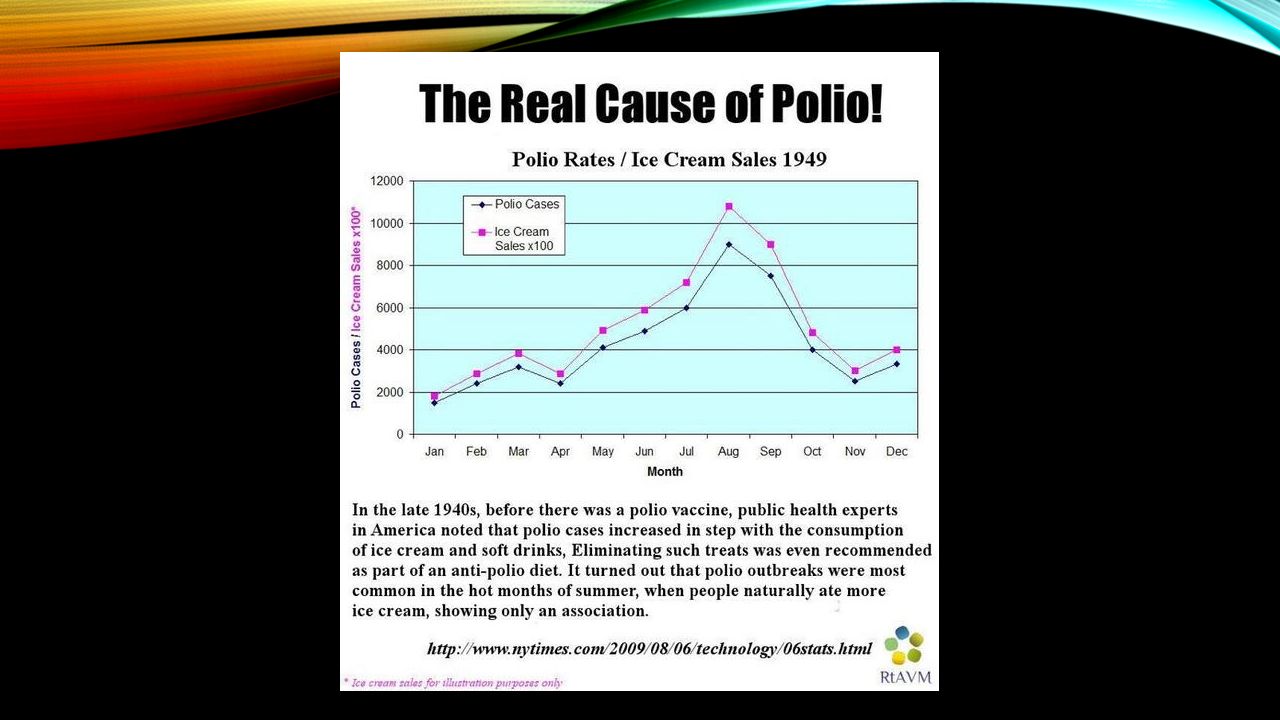
ESSENTIAL QUESTION How can statistics and graphics be used to influence others or make a case?

3
OBJECTIVES The student will be able to: Determine possible biases in the use of statistics to make a case. Identify instances where statistics do not really make the case. Distinguish between correlation and causation in the use of data.

4
BIAS Bias : refers to the tendency of a sample statistic to systematically over- or under- estimate a population parameterstatisticparameter (A parameter is a measurable characteristic of a population, such as a mean or a standard deviation).
.")
5
CAUSES OF BIAS Bias Due to Unrepresentative Samples Selection Bias Bias Due to Measurement Error Response Bias

6
UNREPRESENTATIVE STATS When the survey sample does not accurately represent the population. The bias that results from an unrepresentative sample is called selection bias. 3 examples of selection bias include undercoverage, nonresponse bias, voluntary response.

7
UNDERCOVERAGE occurs when some members of the population are inadequately represented in the sample. A classic example of undercoverage is the Literary Digest voter survey, which predicted that Alfred Landon would beat Franklin Roosevelt in the 1936 presidential election. The survey sample suffered from undercoverage of low- income voters, who tended to be Democrats. How did this happen? The survey relied on a convenience sample, drawn from telephone directories and car registration lists. In 1936, people who owned cars and telephones tended to be more affluent. Undercoverage is often a problem with convenience samples.convenience sample

8
NONRESPONSE BIAS Sometimes, individuals chosen for the sample are unwilling or unable to participate in the survey. Nonresponse bias is the bias that results when respondents differ in meaningful ways from nonrespondents. The Literary Digest survey illustrates this problem. Respondents tended to be Landon supporters; and nonrespondents, Roosevelt supporters. Since only 25% of the sampled voters actually completed the mail-in survey, survey results overestimated voter support for Alfred Landon. The Literary Digest experience illustrates a common problem with mail surveys. Response rate is often low, making mail surveys vulnerable to nonresponse bias

9
VOLUNTARY RESPONSE BIAS Voluntary response bias occurs when sample members are self-selected volunteers, as in voluntary samples.voluntary samples An example would be call-in radio shows that solicit audience participation in surveys on controversial topics (abortion, affirmative action, gun control, etc.). The resulting sample tends to overrepresent individuals who have strong opinions.

10
MEASUREMENT ERROR A poor measurement process can also lead to bias. In survey research, the measurement process includes the environment in which the survey is conducted, the way that questions are asked, and the state of the survey respondent. Response bias refers to the bias that results from problems in the measurement process. Some examples of response bias are given below.

11
LEADING QUESTIONS The wording of the question may be loaded in some way to unduly favor one response over another. For example, a satisfaction survey may ask the respondent to indicate where she is satisfied, dissatisfied, or very dissatified. By giving the respondent one response option to express satisfaction and two response options to express dissatisfaction, this survey question is biased toward getting a dissatisfied response.

12
SOCIAL DESIRABILITY Most people like to present themselves in a favorable light, so they will be reluctant to admit to unsavory attitudes or illegal activities in a survey, particularly if survey results are not confidential. Instead, their responses may be biased toward what they believe is socially desirable.

15
RESOURCES Resources used to create lecture part of lesson: http://stattrek.com/survey-research/survey-bias.aspx http://www.internet4classrooms.com/grade_level_help/misleading_graphs_ math_sixth_6th_grade.htm http://shodor.org/succeed-1.0/curriculum/MCN_NEW/lessons/statistics.html Resource used to let students research and find faulty statistics: http://www.cnn.com/2014/10/13/living/wedding-expenses- study/index.html?hpt=hp_c4 We used Facebook to share link to all students (since we all have laptops and are a part of the group)
")
Similar presentations


. & Methods for Social Researchers in Developing Counries, The.>")


 vs. Franklin D. Roosevelt (D)>")