Download presentation
Presentation is loading. Please wait.

1
Graphs Basics, Formats, Oral vs. Written, Etc. Fig. 1. Grasshopper sparrow (GRSP) territory density in relationship to vegetation density (VOR = visual obstruction readings on Fort Riley, Kansas, 2005. TECHNICAL COMMUNICATONS Spring 2016 - Althoff Lecture 04
 territory density in relationship to vegetation density (VOR = visual obstruction readings on Fort Riley, Kansas, TECHNICAL COMMUNICATONS Spring Althoff Lecture 04.")
2
Figures Meant to ____________ or present technical info that may not be easy to do with text (i.e., lots of text) Definitely the old adage “a picture is worth a 1,000 words” applies to use of Figures. Typically, legends for Figures are at the bottom of the graph, drawing, schematic, picture, etc. vs. the top for Tables.

3
Figures: general tendencies Seldom used in _____________ Frequent in _______________ ex. Country state/region…. Multiple study sites Sometimes to show topography or vegetation types ( common in oral presentations, rare in written ) If in __________, usually diagram of experimental design or sampling design or special equipment Most common in _____________ Almost never in ______________ unless presenting a new model or process/theory
 If in __________, usually diagram of experimental design or sampling design or special equipment Most common in _____________ Almost never in ______________ unless presenting a new model or process/theory.")
4
Include ______ Minimize clutter 1-2 font types max for written, think B & W MAP FIGURES

5
For oral presentations... _____ is often a good option MAP FIGURES

6
be ________ with fonts try to keep things to relative scale __________ balancE detail with simplicity SCHEMATIC FIGURES

7
Figures--schematics: oral presentations If “complex”…then start with basic or first type then “_____” from one slide to the next. May require lots of verbal ‘add on’ commentary to be sure audience understands what you want them to understand or recognize Seldom can do “add” approach for a written publication/report.

8
Point-Intercept Measures distance (length) of plant coverage along line Or, measure GAP between plants (estimate of bare ground) Gives estimate of coverage…. improvement over point-intercept method SCHEMATIC FIGURES ORAL 1

9
Point-Intercept Measures distance (length) of plant coverage along line Or, measure GAP between plants (estimate of bare ground) Gives estimate of coverage…. improvement over point-intercept method Line-Intercept SCHEMATIC FIGURES ORAL 2

10
Point-Intercept Quadrats every 5 m 0.25 m 2 frame for forb frequency, and presence/absence 0.1 m 2 frame set inside 0.25 m2 frame for grass (graminoid) frequency Compared results to point-intercept method Line-Intercept Quadrats Prosser, C.W., K.M. Skinner, and K.K. Sedivec. 2003. Comparison of 2 techniques for monitoring vegetation on military lands. Journal of Range Management 56:446-544. * Done in “transitional” grasslands: between tall- and mixed grass prairie SCHEMATIC FIGURES ORAL 3

11
PHOTO FIGURES label in the “image” if directing reader to specific feature good quality photos are essential Figure legend ____ important than you would think…. Fig. 1. Residual tank tracks evident by earlier green-up of grassland patches in spring than areas not subjected to crushing of vegetation the prior to green –up.

12
Fig. 1. Pre-rehabilitation conditions (A- September 2004) vs. post- rehabilitation (B-July 2005) on a training site on Fort Riley, Kansas. Off- road vehicle tracks visible in 2004 were “filled in” predominately by grasses and forbs in 2005. WRITTEN AB
 on a training site on Fort Riley, Kansas. Off- road vehicle tracks visible in 2004 were filled in predominately by grasses and forbs in WRITTEN AB.")
13
September 2004 July 2005 (10 months later) The off-road tracks visible in 2004 (L) are mostly grass/forb covered by July 2005 (R). ORAL

14
Figures that are data plotted or graphed Clearly label ____ and _____ --including ______ May need _____ to symbols/codes used either on the graph itself or in the figure legend…or both Keep ____________ to 2 or less Font sizes depend on space and importance—but ___ _______________…especially for oral presentations _______________________ for _____ presentations Carefully choose when to “connect the dots”

15
Figures that are data plotted or graphed…con’t Almost always have ______________________ variable on the X-axis Almost always have the ____________________ variable on the Y-axis exception would be if dealing with a “vertical” measure for the predictor variable: ex: height in tree depth in the ground

17
Other Figure-related guidelines on data plotted or graphed Do _____ have to start an axis at zero (either X- or Y-) If multiple graphs in a series, then be consistent with the scale (otherwise…misleading if not noted in Figure legend) Avoid too much on a single graph of data—may need to be multiple years or study sites on separate “identically” formatted graphs Sometimes 2 Y-axes are appropriate—excellent way to show 2 different response variables Careful with _________________—can app ear to be missing if no notation
 If multiple graphs in a series, then be consistent with the scale (otherwise…misleading if not noted in Figure legend) Avoid too much on a single graph of data—may need to be multiple years or study sites on separate identically formatted graphs Sometimes 2 Y-axes are appropriate—excellent way to show 2 different response variables Careful with _________________—can app ear to be missing if no notation")
18
Graph types for Data Bar (histogram): vertical & horizontal Scatter plot Plots with “lines” = line graphs (i.e., connect the dots or trend lines) Plots with error, range bars Pie charts Etc.
: vertical & horizontal Scatter plot Plots with lines = line graphs (i.e., connect the dots or trend lines) Plots with error, range bars Pie charts Etc.")
19
Fig. 1. Grasshopper sparrow (GRSP) territory density in relationship to vegetation density (VOR = visual obstruction readings on Fort Riley, Kansas, 2005. WRITTEN
 territory density in relationship to vegetation density (VOR = visual obstruction readings on Fort Riley, Kansas, WRITTEN.")
20
ORAL Plant Density (biomass) vs. Territory Density
 vs. Territory Density")
22
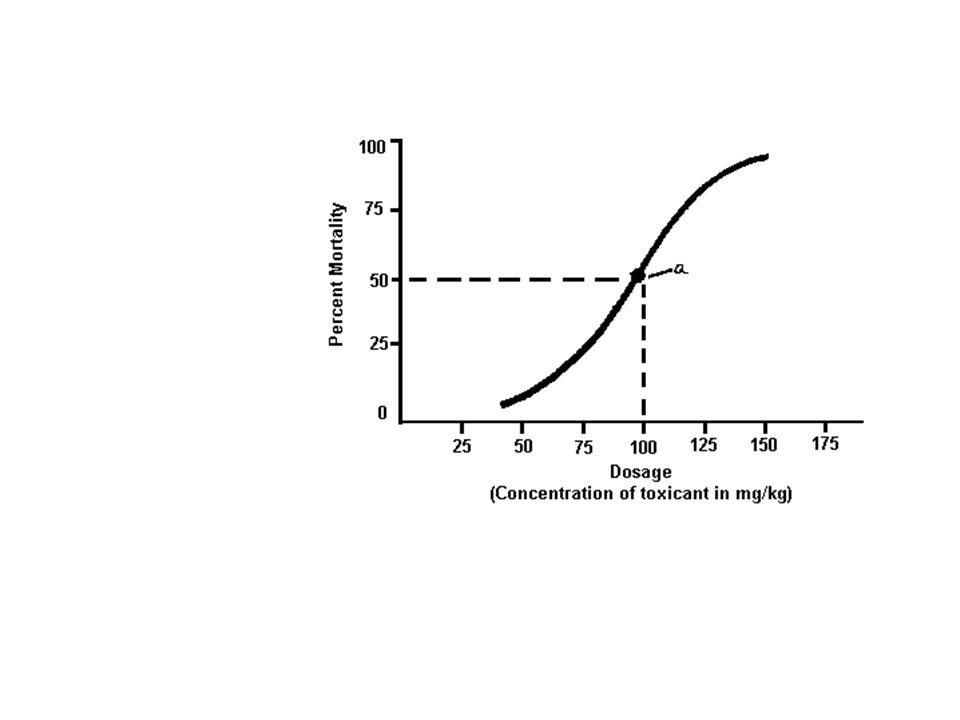
Connecting the dots….good or bad?

23
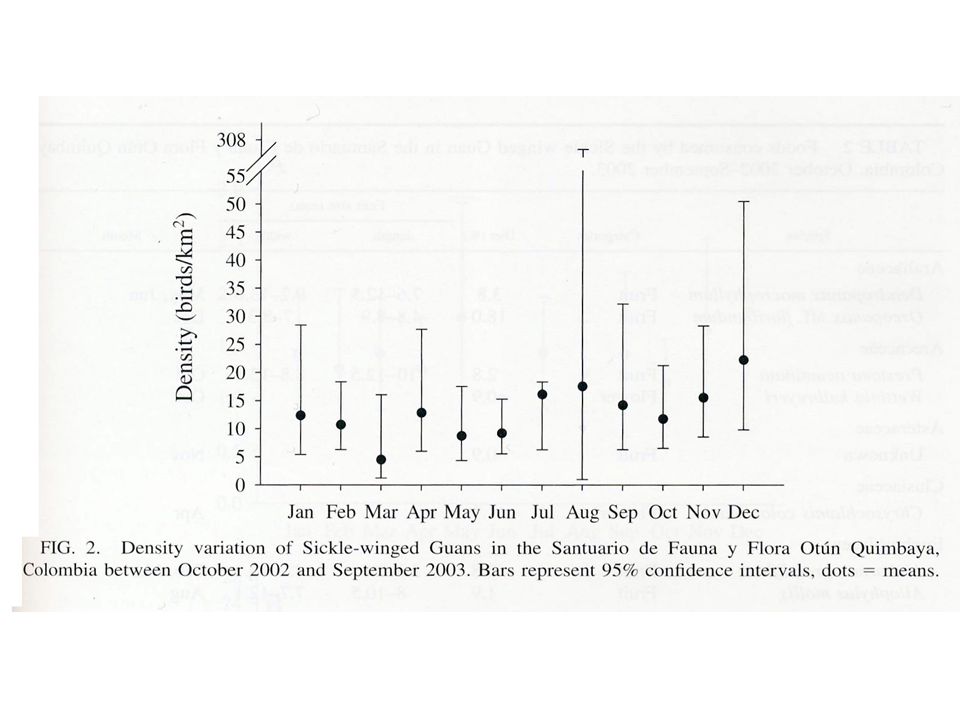
Multiple years….too much on one graph?

24
Fig. 19. Nematode family richness (weighted means with 90% confidence intervals) of soil samples versus the disturbance index (2002: r s =-0.68**, 2004: r s =-0.78***), on Fort Riley, Kansas. WRITTEN
 of soil samples versus the disturbance index (2002: r s =-0.68**, 2004: r s =-0.78***), on Fort Riley, Kansas. WRITTEN.")
25
2002: r s =-0.68**, 2004: r s =-0.78***. ORAL

26
Example: multiple Y-axes

27
In summary… Keep it __________ Keep it __________ as possible Keep it __________ Be sure it does convey a “picture”—even if ______ (vs. photograph)
.")
Similar presentations


 Essential Questions: How do scientists organize data? What graph is appropriate for a type of data? How does graphing help us.>")