Download presentation
Presentation is loading. Please wait.

1
SUCCESSION How do habitats change over time?

2
Primary Succession Succession is the gradual, sequential changing of an area. The habitat changes until the “climax community” is formed. Climax Community – Stable, mature ecosystem. Stays the same a long time. Ex – Forest, prairie

3
Primary Succession 1)Occurs in areas that have no soil 2)No plants or animals in the area 3)1 st inhabitant is called a “pioneer species” – it is usually lichen. Lichen are small and fast growing

4
Primary Succesion 4)Soil is slowly formed and new plants/ animals gradually move into the area 5)Can occur because of a volcano or a new island forms or an icecap recedes
Soil is slowly formed and new plants/ animals gradually move into the area 5)Can occur because of a volcano or a new island forms or an icecap recedes")
5
Primary Succession

6
Secondary succession 1)Occurs in an area that has soil 2)Is usually the result of some disruption to a previous community. (fire, flood, etc…) 3)Happens quicker than primary succession.
 3)Happens quicker than primary succession..")
7
Secondary Succession

8
DO NOW: What kind of factors govern population size? What variables do scientists use to describe populations of animals? DO NOW: What kind of factors govern population size? What variables do scientists use to describe populations of animals?

9
Factors Governing Changes in Population Size Four variables – births, deaths, immigration and emigration Population Change = (births + immigration) – (deaths + emigration) OBJ 9.2
 – (deaths + emigration) OBJ 9.2")
11
Age Structure Stages PREREPRODUCTIVE AGE - Not mature enough to reproduce REPRODUCTIVE AGE - Capable of reproducing POSTREPRODUCTIVE AGE - too old to reproduce

12
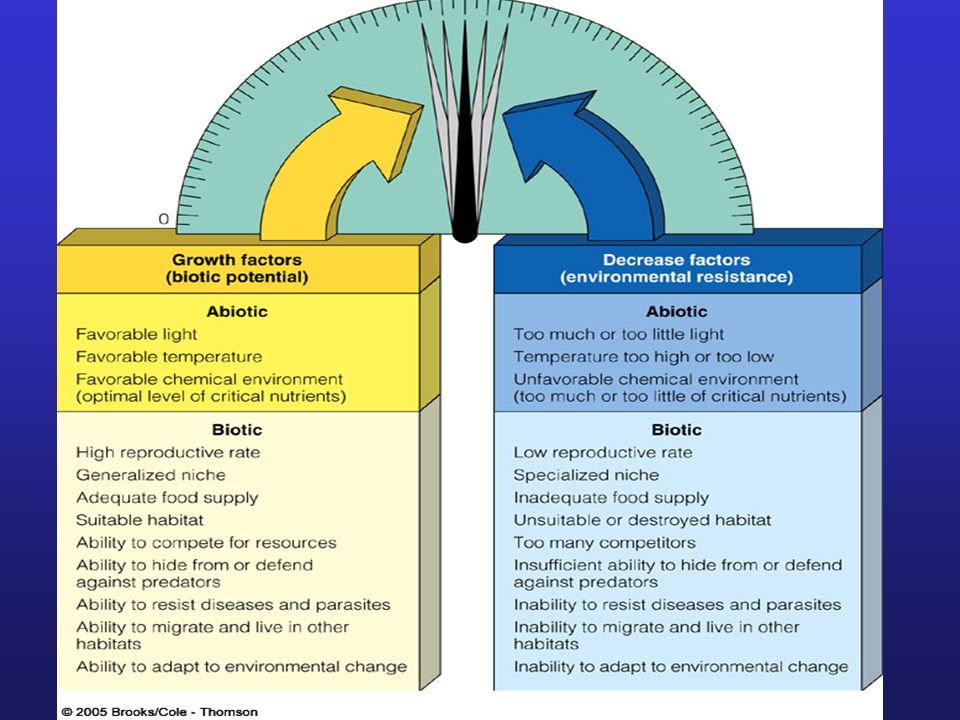
LIMITING FACTOR OBJ 9.3 DEFINITION: anything that tends to make it more difficult for a species to live and grow, or reproduce in its environment ABIOTIC - temperature - water - climate/weather - soils (mineral component) BIOTIC - competition: interspecific and intraspecific - predation/parasitism - amensalism - mutualism
 BIOTIC - competition: interspecific and intraspecific - predation/parasitism - amensalism - mutualism")
13
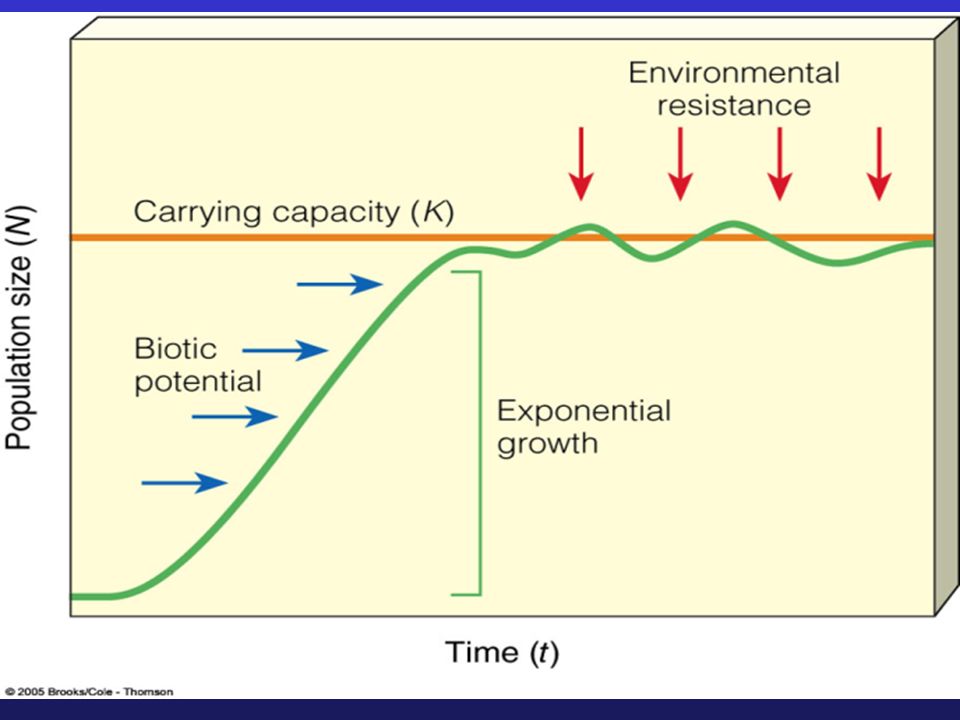
LIMITS TO POPULATION GROWTH: Resources & Competition Fig. 9-3 p. 166 Biotic potential: capacity for growth Intrinsic rate of increase (r): rate at which a population would grow if it had unlimited resources Environmental resistance: all factors that act to limit the growth of a population Carrying Capacity (K): maximum # of individuals of a given species that can be sustained indefinitely in a given space (area or volume)
: rate at which a population would grow if it had unlimited resources Environmental resistance: all factors that act to limit the growth of a population Carrying Capacity (K): maximum # of individuals of a given species that can be sustained indefinitely in a given space (area or volume).")
15
Exponential and Logistic Growth LOGISTIC GROWTH-S Shaped Curve - Rapid exp. growth followed by steady dec. in pop. Growth w/time until pop. Size levels off EXPONENTIAL GROWTH-J shaped curve -Population w/few resource limitations

16
Natural Population Curves Fig. 9-7 p. 168 OBJ 9.7

17
STABLE – pop. Size fluctuates above or below its carrying capacity –Stable population size –EX: undisturbed tropical rain forests IRRUPTIVE –pop. Growth occasionally explodes to a high peak then crashes to stable low level –EX: Algae, insects CYCLIC –Fluctuations occur in cycles over a regular time period –EX: Lynx & snowshoe hare IRREGULAR –No recurring pattern in changes of population size

18
1 1 Do Now: In population ecology, what does each graph represent? What “letter” curve are they? What kind of species’ growth would be indicative of each graph? What does “K” represent in the second graph? What happens if growth goes above the “K” line?

19
The Role of Predation in Controlling Population Size Top-down control - lynx preying on hares periodically reduce the hare pop. Top-down control - lynx preying on hares periodically reduce the hare pop. Bottom-up control - the hare pop. may cause changes in lynx pop. Bottom-up control - the hare pop. may cause changes in lynx pop. Fig. 9-8 p. 168 OBJ 9.8

20
Reproductive Patterns and Survival r-selected species vs. K-selected species Fig. 9-10 p. 170 OBJ 9.10

21
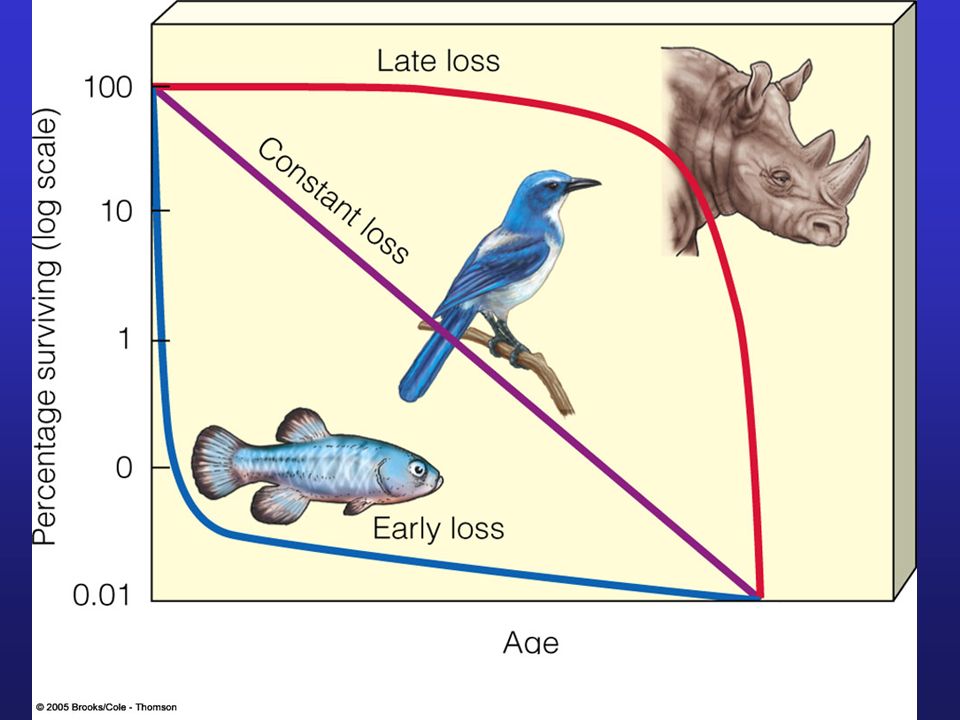
Survivorship Curves Fig. 9-11 p. 171 Shows the % of members in a pop. Surviving at different ages LATE LOSS-TYPE I -High survivorship to certain age; then high mortality -EX: elephants, rhinos, humans CONSTANT LOSS-TYPE 2 -Fairly constant death rate at all ages -EX: songbirds EARLY LOSS-TYPE 3 -Survivorship is low early in life -EX: annual plants, bony fish sp. OBJ 9.11

23
Population Density Effects Density-independent controls - floods, hurricanes, unseasonable weather, fire, habitat destruction, pesticide spraying, pollution - EX: Severe freeze in spring can kill plant pop. regardless of density Density-independent controls - floods, hurricanes, unseasonable weather, fire, habitat destruction, pesticide spraying, pollution - EX: Severe freeze in spring can kill plant pop. regardless of density Density-dependent controls - competition for resources, predation, parasitism, infectious diseases - EX: Bubonic plague swept through European cities in 14 th century Density-dependent controls - competition for resources, predation, parasitism, infectious diseases - EX: Bubonic plague swept through European cities in 14 th century OBJ 9.6

Similar presentations