Download presentation
Presentation is loading. Please wait.

1
Chapter 2 Lecture 4: Motion in One Dimension: Part II HW1 (problems): 1.18, 1.27, 2.11, 2.17, 2.21, 2.35, 2.51, 2.67 Due Thursday, Feb. 11.

2
Instantaneous Acceleration The instantaneous acceleration is the limit of the average acceleration as t approaches 0 The term acceleration will mean instantaneous acceleration If average acceleration is wanted, the word average will be included

3
Instantaneous Acceleration -- graph The slope of the velocity-time graph is the acceleration The green line represents the instantaneous acceleration The blue line is the average acceleration

4
Acceleration and Velocity, 1 When an object’s velocity and acceleration are in the same direction, the object is speeding up When an object’s velocity and acceleration are in the opposite direction, the object is slowing down

5
Kinematic Equations – summary

6
Kinematic Equations The kinematic equations can be used with any particle under uniform acceleration. The kinematic equations may be used to solve any problem involving one-dimensional motion with a constant acceleration You may need to use two of the equations to solve one problem Many times there is more than one way to solve a problem

7
When a = 0 When the acceleration is zero, v xf = v xi = v x x f = x i + v x t The constant acceleration model reduces to the constant velocity model

8
Graphical Look at Motion: displacement – time curve The slope of the curve is the velocity The curved line indicates the velocity is changing Therefore, there is an acceleration

9
Graphical Look at Motion: velocity – time curve The slope gives the acceleration The straight line indicates a constant acceleration

10
The zero slope indicates a constant acceleration Graphical Look at Motion: acceleration – time curve

11
Graphical Motion with Constant Acceleration A change in the acceleration affects the velocity and position Note especially the graphs when a = 0

12
Test Graphical Interpretations Match a given velocity graph with the corresponding acceleration graph Match a given acceleration graph with the corresponding velocity graph(s)
")
13
Freely Falling Objects A freely falling object is any object moving freely under the influence of gravity alone. It does not depend upon the initial motion of the object Dropped – released from rest Thrown downward Thrown upward

14
Acceleration of Freely Falling Object The acceleration of an object in free fall is directed downward, regardless of the initial motion The magnitude of free fall acceleration is g = 9.80 m/s 2 g decreases with increasing altitude g varies with latitude 9.80 m/s 2 is the average at the Earth’s surface In vacuum, a feather and an apple will fall at the same rate.

15
Acceleration of Free Fall, cont. We will neglect air resistance Free fall motion is constantly accelerated motion in one dimension Let upward be positive Use the kinematic equations with a y = -g = -9.80 m/s 2

16
Free Fall – an object dropped Initial velocity is zero Let up be positive Use the kinematic equations Generally use y instead of x since vertical Acceleration is a y = -g = -9.80 m/s 2 v o = 0 a = -g

17
Free Fall – an object thrown downward a y = -g = -9.80 m/s 2 Initial velocity 0 With upward being positive, initial velocity will be negative v o ≠ 0 a = -g

18
Free Fall -- object thrown upward Initial velocity is upward, so positive The instantaneous velocity at the maximum height is zero a y = -g = -9.80 m/s 2 everywhere in the motion v = 0 v o ≠ 0 a = -g

19
Thrown upward, cont. The motion may be symmetrical Then t up = t down Then v = -v o The motion may not be symmetrical Break the motion into various parts Generally up and down

20
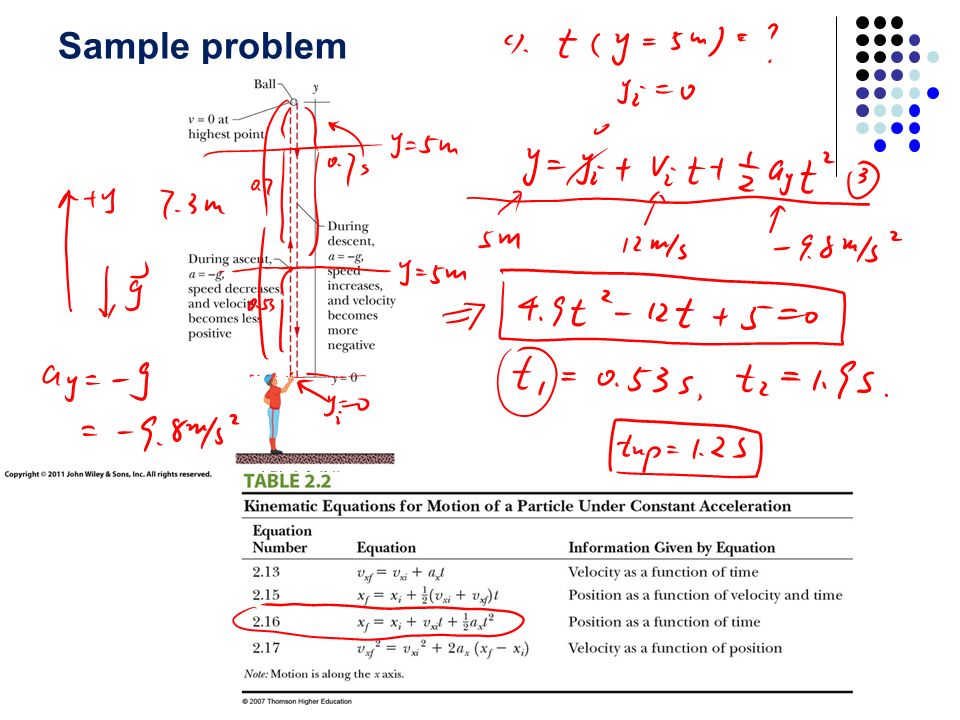
Sample problem

23
Kinematic Equations from Calculus Displacement equals the area under the velocity – time curve The limit of the sum is a definite integral

24
2-10: Graphical integration in motion analysis Starting from we obtain (v o = velocity at time t=0, and v 1 = velocity at time t = t 1 ). Note that Similarly, we obtain (x o = position at time t = 0, and x 1 = position at time t=t 1 ), and
, and.")
25
Chapter 2 Lecture 4: Motion in One Dimension: Part II HW1 (problems): 1.18, 1.27, 2.11, 2.17, 2.21, 2.35, 2.51, 2.67 Due Thursday, Feb. 11.

Similar presentations


 Motion in one dimension Position and displacement Velocity average instantaneous Acceleration motion with constant.>")


 is defined as the rate of change of velocity. It has units of m/s 2 Acceleration can be positive, negative, or zero. An.>")

