Download presentation
Presentation is loading. Please wait.

1
Chad Hart Assoc. Professor of Economics, Iowa State University Steve Johnson ISU Extension Farm Management Specialist Ed Kordick Commodity Services Manager, Iowa Farm Bureau

2
Presentation Objectives: Education on basic marketing tools Introduction to the Marketing Tools Workbook Invitation to continue learning by experience with Iowa Commodity Challenge after this session.

3
Marketing Tools Workbook

4
Crop Marketing Unpredictable events, emotions, volatility Back to the basics: know the tools, have revenue perspective, realistic goals Price is not an adequate measure of success How do you define success? hitting revenue goals, reducing risk,...... Decide what success means to you

5
Futures and Basis Movement

6
Futures Hedging Hedging: taking an equal and opposite position in the futures market than you have in the cash market. When a farmer hedges they take an action now in the futures market that they will take later in the cash market. – If the farmer will sell bushels later in the cash market, the bushels can be sold now in the futures market to protect downside price risk.

7
Why Hedging Works: 5 5

8
Start date End date

9
In this presentation, T diagrams are used in examples to track three market components: Cash Futures Basis over the time period that the hedge is in place.

10
The difference between the cash price and futures price. Many factors influence basis: local supply/demand, etc. The calculation for basis is: Cash Price – Futures Price = Basis $4.80 – $5.10 = - $0.30 $14.20 – $14.70 = - $0.50 Basis

11
Example futures hedge story It’s November: the goal is to sell 5000 bushels of cash corn in late Feb. at $4.30. Estimated basis for late February is -30¢ (cash under March futures). March corn futures are sold at $4.60 Let’s see what happens if the market goes either way !
. March corn futures are sold at $4.60 Let’s see what happens if the market goes either way !.")
12
Hedging Example (market lower) Sell 1 March Corn @ $4.60 Buy 1 March Corn @ $4.15 Late February November Results Goal: $4.30 Cash Corn Sell Cash Corn @ $3.85 - 45 ¢ Estimated: - 30 ¢ 0.00 + 45 ¢ Actual: - 30 ¢ 6 6
 Sell 1 March $4.60 Buy 1 March $4.15 Late February November Results Goal: $4.30 Cash Corn Sell Cash $ ¢ Estimated: - 30 ¢ ¢ Actual: - 30 ¢ 6 6")
13
Hedging Example (market lower) Net Hedge (without commissions and interest cost) 1.Original futures less actual basis = net hedge $4.60 – 0.30 = $4.30 2. Cash sale to buyer +/– futures gain/loss = net hedge $3.85 + 0.45 = $4.30

14
Hedging Example (market higher) Sell 1 March Corn @ $4.60 Buy 1 March Corn @ $5.00 Late February November Results Goal: $4.30 Cash Corn Sell Cash Corn @ $4.70 + 40 ¢ Estimated: - 30 ¢ 0.00 - 40 ¢ Actual: - 30 ¢ 7 7
 Sell 1 March $4.60 Buy 1 March $5.00 Late February November Results Goal: $4.30 Cash Corn Sell Cash $ ¢ Estimated: - 30 ¢ ¢ Actual: - 30 ¢ 7 7")
15
Hedging Example (market higher) Net Hedge (without commissions and interest cost) 1.Original futures less actual basis = net hedge $4.60 – 0.30 = $4.30 2. Cash sale to buyer +/– futures gain/loss = net hedge $4.70 – 0.40 = $4.30

16
Example futures hedge story Story begins the same: November, the goal is to sell 5000 bu. cash corn at $4.30. Estimated basis for late February is -30¢, March corn futures are sold at $4.60 Let’s see what happens if basis is different than expected !

17
Hedging Example (market lower) Sell 1 March Corn @ $4.60 Buy 1 March Corn @ $4.10 Late February November Results Goal: $4.30 Cash Corn Sell Cash Corn @ $4.00 - 30 ¢ Estimated: - 30 ¢ + 20¢ + 50 ¢ Actual: - 10 ¢ 9 9
 Sell 1 March $4.60 Buy 1 March $4.10 Late February November Results Goal: $4.30 Cash Corn Sell Cash $ ¢ Estimated: - 30 ¢ + 20¢ + 50 ¢ Actual: - 10 ¢ 9 9")
18
Hedging Example (market lower) Net Hedge (without commissions and interest cost) 1.Original futures less actual basis = net hedge $4.60 – 0.10 = $4.50 2. Cash sale to buyer +/– futures gain/loss = net hedge $4.00 + 0.50 = $4.50

19
Hedging Example (market higher) Sell 1 March Corn @ $4.60 Buy 1 March Corn @ $5.20 Late February November Results Goal: $4.30 Cash Corn Sell Cash Corn @ $4.80 + 50 ¢ Estimated: - 30 ¢ - 10 ¢ - 60 ¢ Actual: - 40 ¢ 10
 Sell 1 March $4.60 Buy 1 March $5.20 Late February November Results Goal: $4.30 Cash Corn Sell Cash $ ¢ Estimated: - 30 ¢ - 10 ¢ - 60 ¢ Actual: - 40 ¢ 10")
20
Net Hedge (without commissions and interest cost) 1.Original futures less actual basis = net hedge $4.60 – 0.40 = $4.20 2. Cash sale to buyer +/– futures gain/loss = net hedge $4.80 – 0.60 = $4.20 Hedging Example (market higher)
.")
21
Key points: Price does not define marketing success, hitting revenue goals, reducing risk,...... The cash market, futures market and basis can be tracked in futures hedges A futures hedge works in up & down markets Basis is key to result of futures hedge: S tronger basis than expected = Higher price Weaker basis than expected = Lower price

22
Carry and Cost of Ownership

23
Defined: The difference in price between the nearby contact and the more distant delivery months (deferred). Compare the carry offered by the market to the costs of storing grain for the various delivery months. Carry Market

24
In a year like 2012, the limited supply has reduced demand. There is little to no carry in the futures markets. The nearby futures contract is actually higher than the deferred futures. The market provides little incentive for storing the crop. Inverted Market Corn Futures Inverse Soybean Futures Inverse

25
Source: www.cmegroup.com Example Corn Futures Date: Oct. 16 th, 2013 $4.43 Dec. $4.55Mar. $4.63May $4.71 July

26
Source: www.cmegroup.com Example Soybean Futures Date: Oct. 16 th, 2013 $12.75 Jan. $12.63 Mar. $12.49May $12.47 July

27
Corn On-Farm: Monthly Charge = 3¢/bushel Commercial: Monthly Charge = 6¢/bushel Cost of Ownership Soybeans On-Farm: Monthly Charge = 4¢/bushel Commercial: Monthly Charge = 6¢/bushel

28
Key points: Compare the carry offered by the market to the costs of storing grain for the various delivery months The Cost of Ownership will accrue Commercially for both corn and soybeans at 6¢/bushel/month.

29
Forward Cash Contracts

30
Forward Cash Contract Defined: An agreement between a buyer and seller covering a quantity and quality of grain to be delivered at a specified location and time in exchange for a specific price. Example: 5,000 bushel of #2 yellow corn delivered to Local Co-op the last half of February The cash price at delivery will be -$.40 under the March corn futures contract that closed at $4.60/bu. 14

31
Forward Cash Contract A Forward Cash Contract is a binding transaction between the seller and buyer for a later delivery date. Conditions are set including the quantity of bushels, the quality, delivery time and cash price. QuantityQualityDeliveryLocationCash Price 5,000 bu.#2 Yellow Corn Last Half February Local Co-op $4.20 /bu

32
Forward Cash Contract Forward Cash Contracts are widely used and: Set the cash price and delivery terms Are available both before and after harvest Don’t require margin deposits or premiums.

33
Disadvantages Penalties if cannot deliver the contracted amount Locked in price (can’t go higher) Often receive a wider basis. Forward Cash Contract Advantages No margin deposit required Lock in price and delivery terms

34
Hedge-to-Arrive Contract Hedge-to-Arrive (HTA) Contracts are similar to Forward Cash Contracts. The binding transaction sets the: Delivery Date and Location Amount of Bushels to Deliver Quality of those Bushels The Basis is typically not set when the transaction is initiated, however the Futures Price is established. The Seller sets the Basis prior to Delivery.

35
Hedge-to-Arrive Contract Similar to a Forward Cash Contract, an HTA Contract is a binding transaction between the seller and buyer for a later delivery date. Conditions are set including the quantity of bushels, the quality, delivery time but the cash price is not known until the Basis is set. QuantityQualityDeliveryLocationCash Price 5,000 bu.#2 Yellow Corn Last Half February Local Co-op ?

36
Margin Flows

37
Disadvantage Must understand margin calls Commissions Basis risk Futures Contracts Advantages Flexibility, ease of entry and exit Reduces price risk Can improve basis

38
Margin money is “good faith” money that is deposited into the futures account. Performance bond Money that covers changes in the value of the contract position Minimum margins are set by the exchange Additional margin can be collected if the futures contract is losing value for the user Margin Account

39
There are two key margin levels: Initial margin Maintenance margin Key Margin Levels The initial margin is the amount you have to deposit to participate in the futures market. The maintenance margin is the amount you have to keep as a minimum balance.

40
Key Margin Levels CornSoybeans Initial$1,650$3,300 Maintenance$1,500$3,000 $ per contract Let’s go through an example

41
Margin Example Sold 1 corn futures contract at $5.00 per bushel 17 DayPriceChange in Value Computed Balance Margin Call Ending Balance 1$5.00$1,650 2$5.10–$ 500$1,150$ 500$1,650 3$5.30–$1,000$ 650$1,000$1,650 4$4.90+$2,000$3,650 5$5.00–$ 500$3,863$3,150

42
Basic Options, Intrinsic and Time Value

43
An option is the right, but not the obligation, to buy or sell a futures contract. Options Contracts Farmers can buy and sell options. When you buy an option, you get the right. When you sell an option, you face the obligation. Options are tied to specific futures contracts. The strike price is the price in the option at which you may buy (or sell) futures contracts.
 futures contracts..")
44
Types of Options There are two types of options: Puts Calls A put option gives you the right to sell futures. Put options are often used to set price floors. A call option gives you the right to buy futures. Call options are often used to replace cash bushels.

45
Examples Let’s say you buy a $4.50 put on July corn futures. That put gives you the right to sell July corn futures for $4.50 per bushel. If you had bought a $4.50 call, that would give you the right to buy July corn futures for $4.50 per bushel.

46
Example Put Put options pay out when futures prices fall. Here’s the payout schedule for a $4.50 put on July 2014 corn.

47
Example Call Call options pay out when futures prices rise. Here’s the payout schedule for a $4.50 call on July 2014 corn.

48
Premium vs. Margin 22

49
Options Premiums Can be divided into two sections: Intrinsic value What is the option worth today? Time value How much time is left on the option? Intrinsic value depends on the futures price and the strike price of the option. Time value depends on the length of time in the option and the price volatility in the market.

50
Example DayFutures Price Option Premium Intrinsic Value Time Value 1$12.00$0.60$0.00$0.60 2$12.20$0.56$0.00$0.56 3$11.70$0.83$0.30$0.53 4$11.55$0.95$0.45$0.50 5$11.90$0.67$0.10$0.57 Start with an soy put option @ $12.00 per bushel 29

51
Options Features Advantages Options can establish price floors or ceilings Not locked in to a particular buyer Flexible No margin requirements Disadvantages Specific size of contract Commissions and option premiums

52
Store Cash Bushels and Buy Put Option

53
Put Option A put option is the right, but not the obligation to sell futures. The buyer of the option pays a premium for “price insurance” to the downside. Market Lower: Put option gains value to offset cash loss. Market Higher: Put premium is only cost.

54
Store cash bushels and buy put option strategy A combination of a cash position (owning the cash bushels) and a risk management position (buying the put). The put option gains value as market goes lower (as cash bushels lose value). If market moves higher, the cash position gains value and the put option is limited to the loss of the option premium.
. If market moves higher, the cash position gains value and the put option is limited to the loss of the option premium..")
55
Estimated Floor Price Calculation July Corn Put Strike Price less Premium Paid less estimated basis = Est. Floor Price* $4.60 - 26¢ premium - 30¢ est. basis = $4.04 *Option examples do not include commissions and interest

56
Store Cash & Buy Put Option $5.60 $5.35 $5.10 $4.85 $4.60 $4.10 $3.85 $3.60 $4.35 0.00 +0.25 +0.50 +0.75 0.00 +1.00 -0.26 $4.60 -0.26 $5.34 $5.09 $4.84 $4.59 $4.34 -0.30 $5.04 $4.79 $4.54 $4.29 $4.04 Initial Futures 24

57
Key points: Store cash bushels & buy put option strategy The put option gains as market goes lower (as cash bushels lose value). Market higher: cash position gains value and the put option loses only the premium paid. Strike Price – Premium – Est. Basis = Est. Floor Price Basis is key to the net result of the strategy.

58
Sell Cash Bushels and Buy Call Option

59
Call Option A call option is the right, but not the obligation to buy futures. The buyer of the option pays a premium for “price insurance” to the upside. Market Lower: Call premium is the only cost Market Higher: Call option gains value.

60
Sell cash bushels and buy call option strategy This is a re-ownership strategy. This is price risk management since the cash bushels are sold and the limited risk is the call option premium. Call option “replaces” cash ownership Strategy is not considered hedging by IRS.

61
The call option tends to gain value as the market moves higher. Similar to minimum price strategy of buying put options and can be reasonable if conditions are right (avoid storage costs, good basis at harvest, lack of carrying charge). Sell cash bushels and buy call option strategy
. Sell cash bushels and buy call option strategy.")
62
Estimated Floor Price Calculation Cash Sale Price less Premium Paid (to buy July Soy $12.80 call) = Est. Floor Price* $12.20 - 55¢ premium = $11.65 *Option examples do not include commissions and interest

63
Sell Cash & Buy Call Option $14.30 $13.80 $13.30 $12.80 $11.80 $11.30 $10.80 $12.30 $14.80 $12.20 +2.00 +1.00 0.00 +0.50 0.00 +1.50 -0.55 $13.15 $12.65 $12.15 $11.65 $13.65 $12.80 Initial Futures 27

64
Key points: Sell cash bushels & buy call option strategy Re-ownership strategy: price risk transferred from cash market to call option. Minimum price: cash price is set and the call option has the limited risk of the premium. Cash Sale Price – Premium = Floor Price Consider when: want to avoid storage costs, basis is acceptable, lack of carrying charge.

65
Marketing New Crop

66
The 5-year seasonal crop price patterns favor new crop futures to peak during the spring and summer months. Seasonal Patterns 31

67
Historically, corn prices don’t exceed estimated costs of crop production for long periods of time. Consider sales – even before harvest when profit margins are available. Crop Margins - Corn Price = $4.20/bu Cost = $4.46/bu

68
Soybean prices don’t exceed estimated costs of production for long periods, but note the trend in recent years. That opportunity to make sales before harvest is especially attractive in 2012. Crop Margins - Soybeans Price = $10.75/bu Cost = $11.13/bu

69
2014 Costs Annual estimates from ISU Extension Publication A1-20, January 2014 Cost of Production Corn following Soybeans = $4.29/bu Corn following Corn = $4.97/bu Soybeans = $11.13/bu

70
Harvest Delivery Reduced Storage/Drying Costs Bushels that can be sold and moved to market at harvest will result in less bushels to store and perhaps reduce corn drying costs. 10,000 bu. of soybeans valued @ $13/bu 8 cent in/out charge + 3 months of 4% interest 8¢ +12¢= 20¢ per bushel 20¢ X 10,000 bu = $2,000 savings!

71
Key points: Keep good records to determine your cost of crop production; estimate your profit margin and compare to harvest delivery prices. Seasonal crop price patterns favor new crop futures to peak during the spring and summer months. Bushels that can be sold and moved to market at harvest will result in fewer bushels to store, perhaps reduced corn drying costs and an opportunity to generate cash flow needs.

72
Conquer Marketing Concerns 38

73
Revenue Protection = Over 90% of Iowa’s Insured Acres Crop Insurance Coverage

74
Marketing Strategy Pre-Harvest Sell for Delivery up to 136 Bu/A Price Guarantee is Higher of the Projected Price vs. Harvest Price Slight Basis Risk Must Plant the Crop (Prevented Planting = 60%) 170 Bu/A Actual Production History (APH) RP @ 80% Level of Coverage 136 Bu/A Guarantee X $4.62/bu Projected Price Deductible 20% = 34 Bu/A = $628/A Revenue Guarantee Selling Insurance Bushels
 170 Bu/A Actual Production History (APH) 80% Level of Coverage 136 Bu/A Guarantee X $4.62/bu Projected Price Deductible 20% = 34 Bu/A = $628/A Revenue Guarantee Selling Insurance Bushels.")
75
Corn Actual Production History (APH) of 170 bu/A Revenue Protection @ 80%(170 X.80 = 136 bu/A) Revenue Guarantee:136 bu/A X $4.62/bu = $628/A Drought: Actual yield is 100 bu/A, price = $7.50/bu New Revenue Guarantee: 136 bu/A X $7.50/bu = $1,020/A Revenue to Count: Harvests 100 bu/A X $7.50/bu = $750/A Indemnity Payment: $1,020 - $750 = $270/A Shortfall of Delivery Bushels: Settle by Nov. 1 st Corn Indemnity Payments

76
Corn Insurance Prices

77
Soybean Insurance Prices

78
Key points: Revenue Protection (RP) can easily be used in combination with a pre-harvest sales strategy that commits guaranteed insurance bushels to delivery. Use of forward contracts and/or HTA contracts are common tools for selling crop insurance bushels committed to delivery. Bushels that you prefer not to commit to delivery, consider protecting prices using futures hedges and/or buying put options..

79
Marketing New Crop

80
The 5-year seasonal crop price patterns favor new crop futures to peak during the spring and summer months. Seasonal Patterns 31

81
The traditional 5-year seasonal crop price pattern favored new crop futures peaking during spring & summer months. Recently, it appears the seasonals have flattened. Market with revenue margins as the objective! Seasonal Patterns 31

82
Crop Marketing Matrix Futures Price Basis 1.Store & wait 2.Delayed price contract 3.Minimum price contract (open basis) 1.Basis contract 2.Sell Cash Bushels and Buy Futures or Call Option 3.Minimum price contract (fixed basis) 1.Hedge 2.Non-roll hedge to arrive 3.Buy put option 1.Cash sale now 2.Forward Contract 43
 1.Basis contract 2.Sell Cash Bushels and Buy Futures or Call Option 3.Minimum price contract (fixed basis) 1.Hedge 2.Non-roll hedge to arrive 3.Buy put option 1.Cash sale now 2.Forward Contract 43")
83
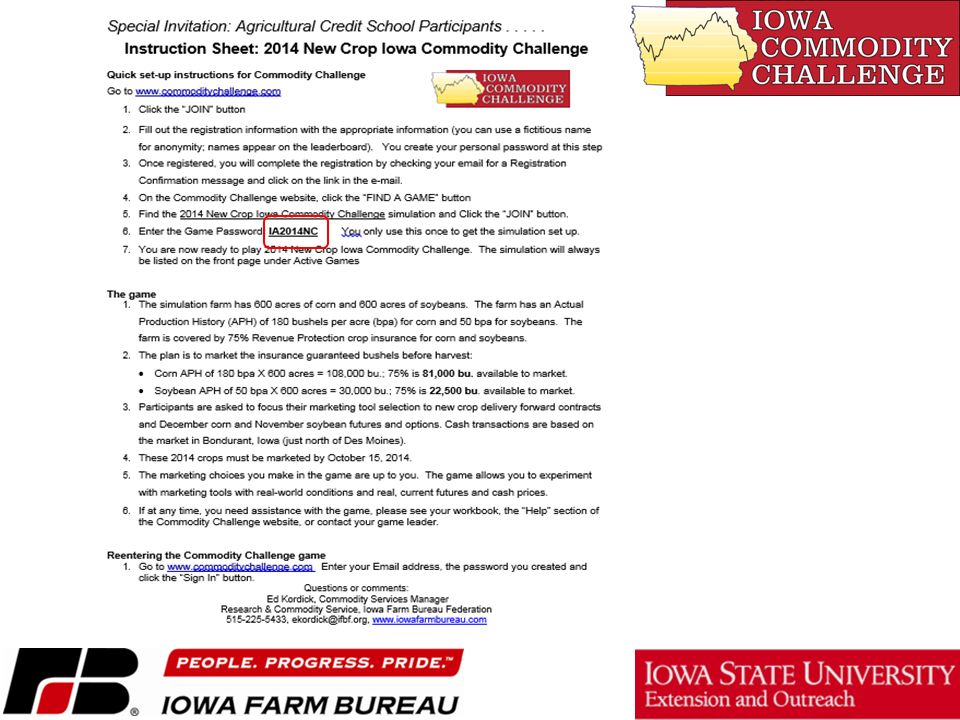
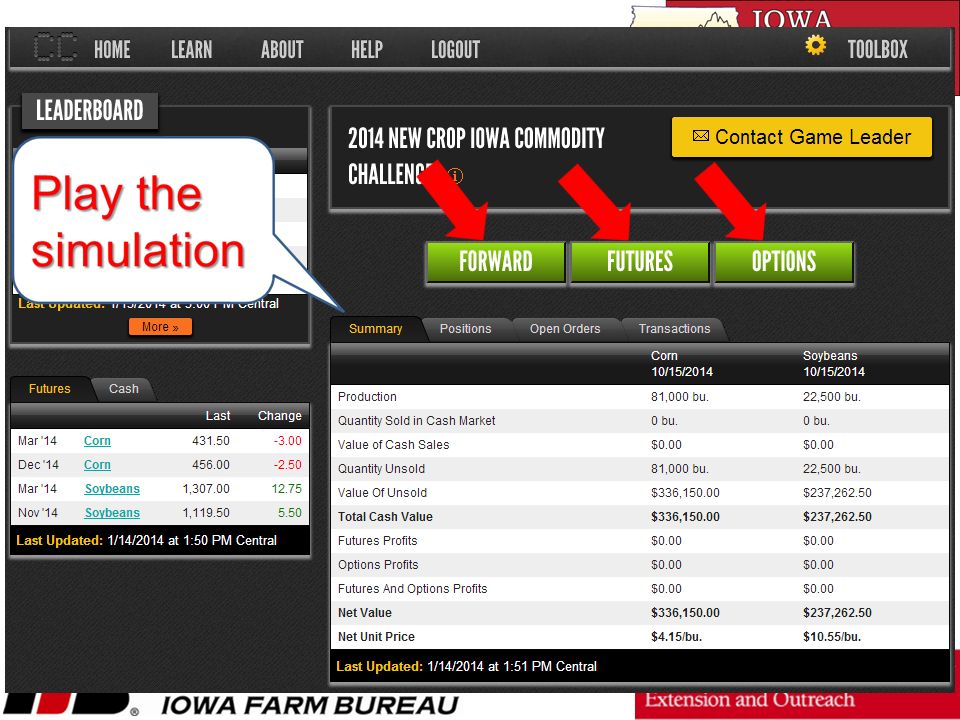
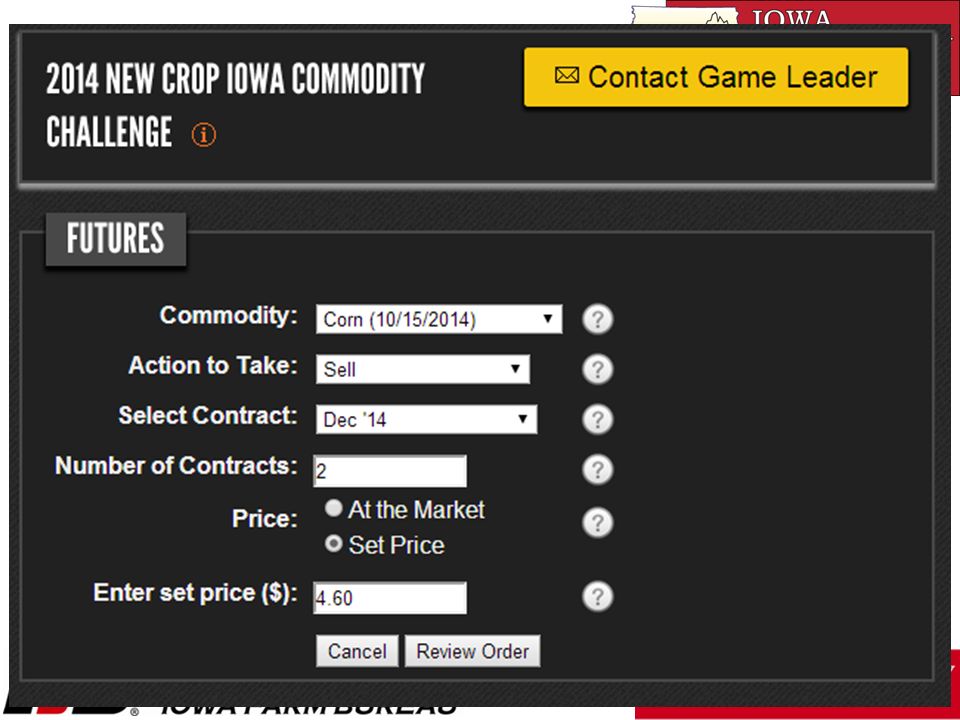
Corn and soybean marketing simulation Practice with forward contracts, futures & options Periodic e-mails to support learning The simulation will end in October, 2014. Participants are invited to play the Commodity Challenge simulation to experiment with marketing tools and planning.

84
The plan is to market the insurance guaranteed bushels before harvest: Corn APH of 180 bpa X 600 acres = 108,000 bushels; 75% is 81,000 bu. available to market. Soybean APH of 50 bpa X 600 acres = 30,000 bushels; 75% is 22,500 bu. available to market. 2014 New Crop Iowa Commodity Challenge

86
Click Join Go to www.commoditychallenge.com

87
Click Join Fill out the form Including password you create

88
Click Find a Game, select the Click Find a Game, select the 2014 New Crop Iowa Commodity Challenge and click join and click join

89
Enter the game password

93
www.extension.iastate.edu/agdm/info/icc.html Web address on page #47

94
Written Plan to manage emotions

95
Marketing Tools Workbook

96
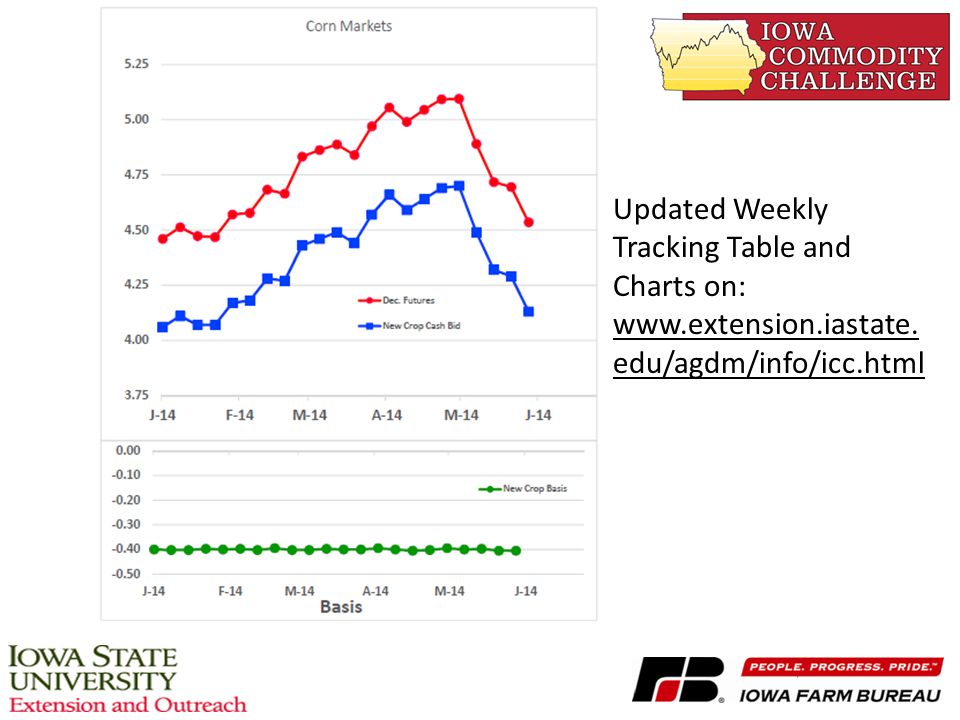
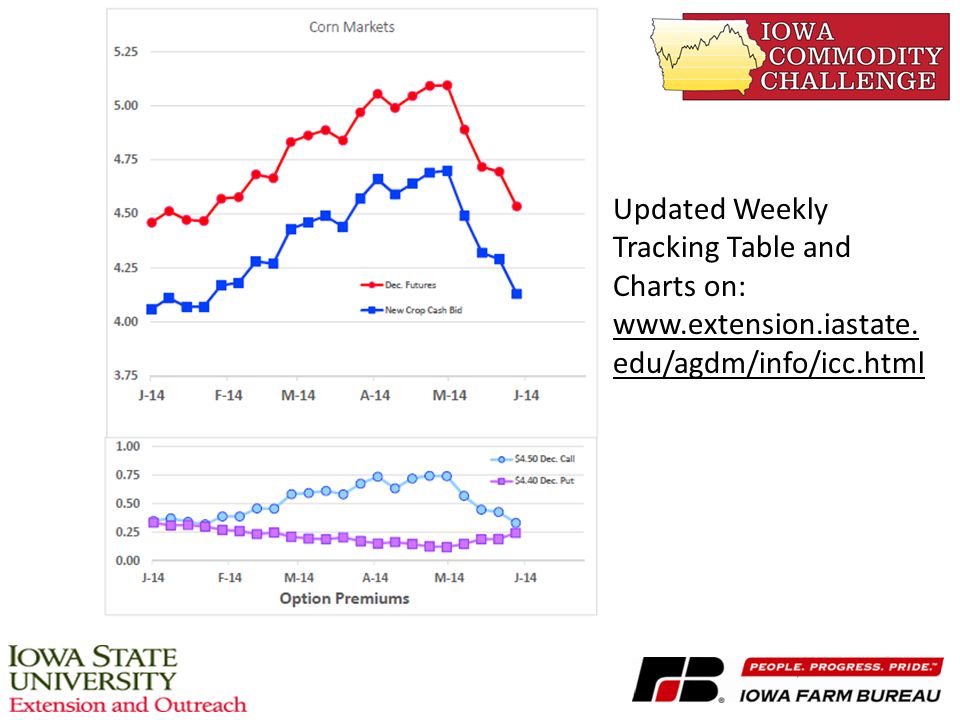
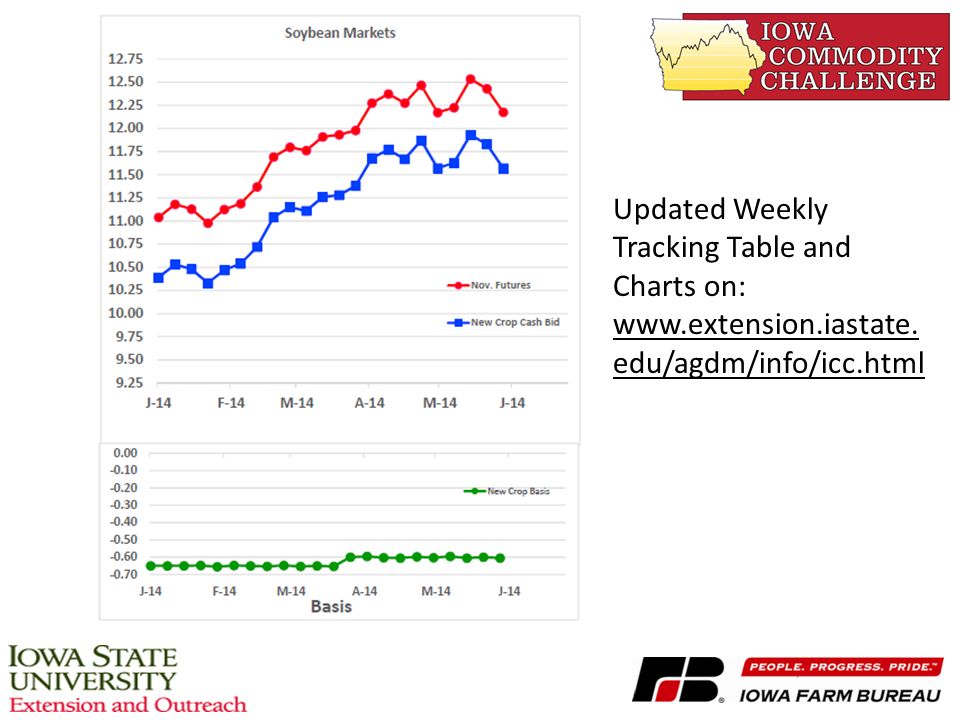
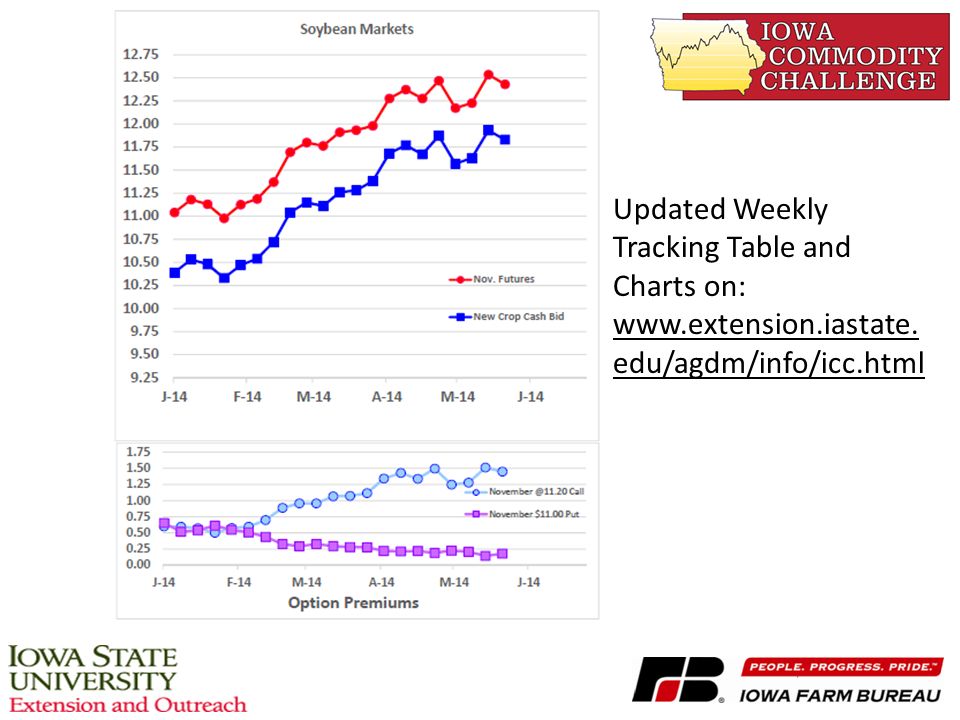
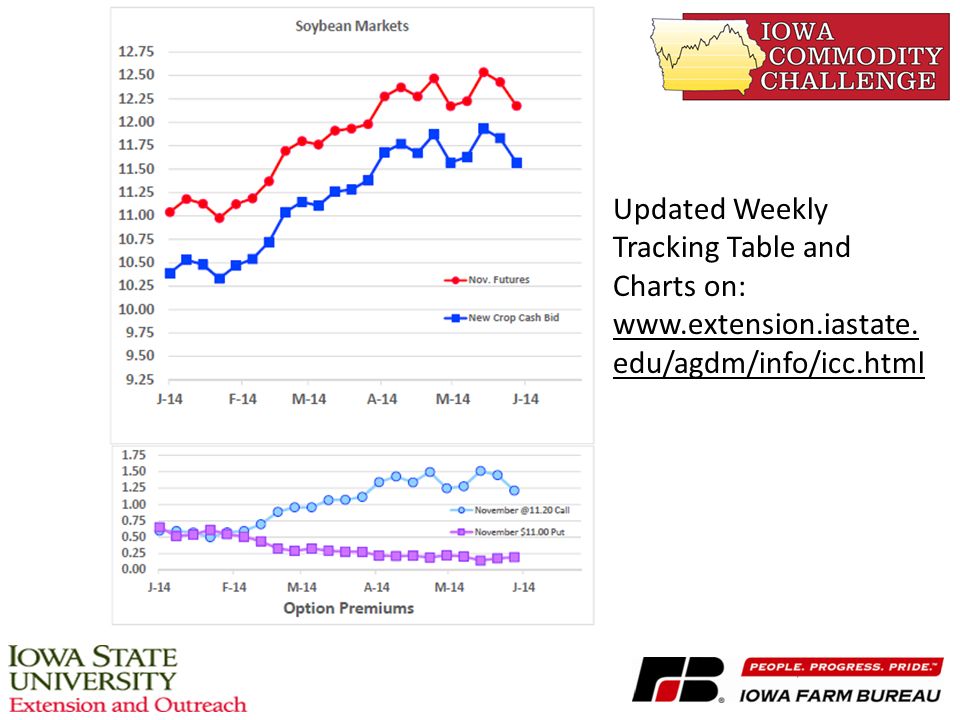
Updated Weekly Tracking Table and Charts on: www.extension.iastate. edu/agdm/info/icc.html

103
Online Curriculum www.extension.iastate.edu/agdm/info/icc.html

104
Marketing Tools Workbook

105
For Questions about this program, please contact: Chad Hart Assoc. Professor of Economics, Iowa State University chart@iastate.edu Steve Johnson ISU Extension Farm Management Specialist sdjohns@iastate.edu Ed Kordick Commodity Services Manager, Iowa Farm Bureau ekordick@ifbf.org

Similar presentations


 957-5790>")


